The service component of the U.S. economy has been growing continually for the past several decades. National economic development moves through stages of growth in agriculture, manufacturing, and service. The dominance of service is influenced by the role of support functions, value-sourcing, and evolving servicing enterprises. These support functions may include sales, purchasing, design, and human resources; value-sourcing really implies sourcing for value irrespective of national boundaries; and servicing enterprises include the service sector, such as finance, insurance, and real estate. More than two-thirds of the U.S. gross domestic product (GDP) has service components. Major corporations, like GM and GE, are shifting manufacturing and focusing more on the service side of the business, to the point where most of their profits are realized through service elements.
The transformation of the U.S. economy from an agricultural-based to manufacturing-based leading to a service-based economy has a profound impact on the way corporate performance should be measured. The agricultural process is inherently nature-dependent and supplemented by machines and people. The process of agriculture was originally learned through apprenticeship. In manufacturing, on the other hand, the definition, measurements, and improvement became more exact and, thus, a science. As a result, the manufacturing processes became learnable, repeatable, and measurable. Thus, the performance of the manufacturing processes improved over time to virtual perfection (i.e., Six Sigma level).
The service processes consist of interaction and transaction elements. The transaction-heavy service processes are similar to the manufacturing processes; however, the interaction-heavy service processes have their intricacies. Even the transaction-heavy service processes contain elements of interaction that make their definition and measurement somewhat difficult. The transaction processes are typically high-volume, process-dependent, formatted customer input; thus, they are more efficient and have a low value per transaction. On the other hand, the interaction processes contain low-volume, extensive-people-dependent, flexible customer input; thus, they are more responsive and have a high value per service. Interaction-based services could be classified as traditional services, such as a retail setting or financial services, or as experiences such as theme parks. The length and extent of interaction with the customer separates these types of interaction services.
Based on these types of services, we could describe services as a transaction or as an experience. Considering services as a transaction, the inputs to a service process include customer information, systems, methodologies, interpersonal skills, work environment, and response time. The output of a service process may be a transaction record document or personal service to a customer. The performance of the transaction record can be measured in terms of its accuracy, but the performance of a personal service can be somewhat difficult to measure because of human emotions and perceptions. Considering services as an experience, the firms usually “stage” the experience with customer involvement, and customers leave with a “memorable perception.”
A business is a collection of business processes. Each business contains common processes as well as unique processes. The common processes include management, sales, purchasing, human resources, quality, and customer support. The unique processes represent the focus of the business. In financial services, for example, these unique processes could relate to stock buying or selling transactions, loan applications review, dividends distribution, banking services, and many more. Both transaction- and interaction-heavy businesses will contain common as well as unique service processes. The process errors observed in the transaction- and interaction-heavy businesses include information accuracy and integrity errors, product performance errors, delinquencies, errors in the misapplication of a tool, customer service errors, and other human errors.
The leadership of a service organization faces the challenge of measuring business performance. In a manufacturing business, the leadership tracks the number of turns, customer satisfaction, inventory levels, and/or asset utilization. Service businesses, however, do not have inventory levels, the number of turns, or significant assets to measure utilization. The most critical asset—human resources—is difficult to measure. Some companies attempt to remedy this challenge by measuring productivity in terms of revenue per employee, but doing so can have its drawbacks.
As an example, the leadership in one company hired a productivity consultant, and one of us was hired as a quality or performance consultant. During a casual discussion, we were told that whenever the productivity consultant met with employees or analyzed employee productivity, employees slowed down. Measuring human productivity has a negative connotation associated with it and is sometimes perceived to be detrimental to employee dignity. In addition, human productivity is difficult to measure for further improvement. If one measures revenue per employee as a measure of productivity, the only way to improve the productivity without any process improvement is to reduce head count or improve sales. Such action implies that scorecards must identify process-based measurements rather than events or outcome-based measurements.
Beginning with the simple measurements of profit, growth, or customer satisfaction, to a series of financial measurements, there has been a perceived continual need for more nonfinancial measurements. The need for measurements is growing due to the increased expectation of more process knowledge coupled with the lack of information about the process. Both for-profit and not-for-profit organizations use a variety of scorecards. Whenever an activity is performed, interest in measurement begins with a need to know the “goodness” of the activity’s outcome. Measurements are taken related to the activity’s consistency and the “goodness” of inputs to the activity. A challenge with the outcome-related measurements, however, is the lack of information due to the nature of the measurements and their application.
Financial measurements are easier to assess than the output measurements because of commonality across processes and industries. The Balanced Scorecard was introduced by Robert Kaplan and Ken Norton in the early 1990s as a framework for diversifying measurements beyond financial measurements. Since its inception, many companies have implemented or attempted to implement the Balanced Scorecard; however, its impact is not known yet. The Balanced Scorecard consists of four perspectives: Customers, Financial Operations, Internal Operations, and Learning and Growth. After reviewing its performance in the field, the following observations are apparent:
The Balanced Scorecard was designed as a Strategic Management System and thus geared toward the organization’s executives instead of toward operations. As a strategic management system, it does incorporate various aspects of the organization; however, it is not useful at the operations level.
Employees at the operations level cannot relate to the Balanced Scorecard, thus causing a gap in communication between executives and employees.
The Balanced Scorecard does not relate to the organization’s structures; thus, it appears to be an imposed set of measurements. No actual business is organized as four perspectives with clear responsibility for each perspective. Therefore, successful implementation of the Balanced Scorecard appears to be questionable in the absence of clearly identified responsibilities.
The Balanced Scorecard does not provide guidance for implementation at the process level. Although it can identify measures at the process output level, it does not clearly help in identifying relevant measurements at the process level, where all the opportunities in performance improvement reside.
The Balanced Scorecard does not address the intangibles of an organization and thus remains incomplete. It does not address the issues of leadership, employee innovation, and improvement.
In several conferences we have asked the audience to raise their hands about using the Balanced Scorecard. Invariably, everyone raised their hand to demonstrate their use of the Balanced Scorecard. When we asked them how good they felt about the Balanced Scorecard’s impact on their company’s bottom line, no hand went up. In other instances when one of us asked about implementation of the Balanced Scorecard, we rarely saw any hand go up. Instead we got responses like, “It has been implemented in our Finance department,” or “It is for our management.” Such responses simply show that people are calling their measurements “the Balanced Scorecard” without using it as intended, implying that the Balanced Scorecard has been unable to address real business needs.
During the past 10 to 15 years, the business model has significantly changed. Factors such as globalization, increased competition, arrival of the Internet, outsourcing, and strength of Asian economies have all disrupted the current business model. In addition, the Balanced Scorecard has not changed its methodology since its inception. Although continual change is now fundamental to a business, the Balanced Scorecard has maintained its status quo. The measures of business performance within the Balanced Scorecard must change to represent the present reality.
Because the Balanced Scorecard, consisting of the four perspectives of Customers, Internal Operations, Financial Operations, and Learning and Growth, is the known measurement system to date, its variations have been implemented in several industries, such as human resources, healthcare, municipalities, and information technology. The conceptual breakthrough highlighted in the Balanced Scorecard led to diverse measurements. For example, when implemented at Halifax Regional Municipality in 2004, the Balanced Scorecard was diversified based on the priorities of the municipality’s business strategies. Challenges faced in diversifying the scorecard included too many priorities, conflicting demands, and operational versus strategic emphases.
According to Dean Spitzer, the author of Transforming Performance Measurements, performance measurement has evolved into a purely technical area using methodologies (i.e., the dashboard). Measurement specialists lead the measurement initiative, and everyone else in the organization just becomes an observer of performance measurement. The complete cycle of performance measurement must instead be implemented effectively to realize its dual purpose of organizational learning and business transformation.
According to documents at the Performance Measurement Resources Center at The Enterprise Solutions Competency Center, which provides support for the Department of Defense Executive Branch, the current business environment is very different from what it was ten years ago. Performance measures drive accountability, visibility, and transparency; inspire and motivate all employees; provide direction for the organization; and encourage alignment from top to bottom. Strategy sets the direction for execution, and performance measurement allows for improvement. In a nutshell, performance measurement is the process of developing indicators using metrics for driving progress toward business goals.
Fundamentally, enterprises realize that their primary challenge is the disconnect that exists between strategy and execution. Strategy, initiatives, resources, and risk are addressed at the senior executive level of an organization, but they are not directly tied to the day-to-day activities. As a result, organizations can measure performance, but they are unable to manage it.
One of the reasons an organization has a performance measurement system without a significant impact on the bottom line is a lack of understanding of the role of measurements. Table 1.1 shows how the measurements have historically been utilized. These measurements were reviewed for various aspects such as basic purpose, driver, methodology, type, example, outcome, challenge, and beneficiaries. The need for a different set of measurements is apparent when you study the trend from the industrial age to the knowledge age. Interestingly, even the purpose of establishing measurements subtly changed from productivity, quality, and profit to profitable growth.
Table 1.1. Evolution of Performance Measurements
Aspects | Industrial Age | Quality Age | Information Age | Knowledge Age |
|---|---|---|---|---|
Objective/Scope | Increase productivity | Improve quality | Improve bottom line | Sustained profitable growth |
Driver | Basic needs | Expectation | Shareholders driven | Customer value driven |
Methodology | Metrics | KPIs | Balanced Scorecard | Business Scorecard |
Type | Output | In-process | Organization wide | Supply Chain |
Purpose of Establishing Measurements | Quantity—Units (Cost per unit) | Yield % Good (Defects per unit) | % Profit (Profit per unit) | % Profitable Growth (Value per unit) |
Outcome | Fulfill customer needs | Get customer business through quality | Increase market value through profit | Achieve business growth through innovation |
Challenge | Orders shipped | Quality received | Financials achieved | Performance achieved |
Beneficiaries | Producer | Consumer | Shareholder | Stakeholders |
Productivity increase was required to keep up with the customer demand, which led to sacrifices in quality and resulted in focusing on quality improvement. The quality improvement was related to the cost of poor quality deducted directly from the profit, thus leading to a focus on profit. Excessive focus on profit led to adverse actions, such as layoffs, outsourcing, supplier squeeze, price wars, and the eventual demise of the business.
While the business progresses through its life cycle, experience and information are gained, technology is developed, and responsiveness becomes critical. Now customer delight—not just customer satisfaction—is expected. The explosion of knowledge has led to informed customers, intense competition, and more demand for better, faster, and more (not cheaper) value. This shift requires operation optimization, continual innovation, and mass customization. As a result, the leadership must become adept at multitasking, comprehending business complexity, and responding optimally.
All of this evolution in business development highlights the need for profitable growth, which requires measurements that represent all segments of the business—objective and subjective, machines and people, and strategy and execution. Kaplan and Norton’s Balanced Scorecard was designed to improve the bottom-line performance of companies by focusing on nonfinancial measures of the vision, strategy, objectives, targets, and actions. Experience shows that most Balanced Scorecard measurements follow the “SMART” (specific, measurable, action, realistic, and target) principle. However, the real business also consists of difficult-to-measure, difficult-to-quantify, knowledge-driven, and subjective measurements. Service industries and operations are bound to have more subjective performance measurements.
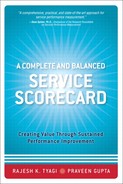
The Six Sigma Business Scorecard book (Gupta, 2006) presented a holistic business scorecard framework consisting of seven categories and ten measurements. The seven categories and measurements are shown in Table 1.2.
Table 1.2. The Six Sigma Business Scorecard
Category | Measurements | Significance (%) | Comments |
|---|---|---|---|
Leadership and Profitability | Profit CEO Recognition | 15% 15% | 12% profit implies 100% score. CEO recognition is accorded for significant value creation. |
Management and Improvement | Rate of Improvement | 20% | Each department must set an aggressive goal for improvement. |
Employees and Innovation | Number of ideas per employee | 10% | Idea generation implies employee engagement; thus, it is critical that employees continually input their ideas for improvement. |
Purchasing and Supplier Management | Quality (Sigma) Cost of Purchase | 5% 5% | The aim is to have suppliers achieve higher quality. Cost of Purchase is measured as % of sales. |
Operational Execution | Quality (Sigma) Cycle time variance | 5% 5% | Internal operations must aim toward established performance targets. Cycle time variance requires setting delivery or activity completion targets. |
Sales and Distribution | % new sales | 10% | Emphasis on new sales for revenue growth. |
Service and Growth | Customer Satisfaction | 10% | This could be a measure of multiple internal measures leading to customer satisfaction and loyalty. |
As with any scorecard, the Six Sigma Business Scorecard needs to be adapted to various industries. The seven categories are applicable to most businesses; however, measurements need to be customized to represent needs of various industries. For example, in banking industries or similar service industries, physical inventory may not exist; thus, the purchasing performance could be measured differently.
Evolving business conditions continually highlight the outsourcing processes, growing collaboration or partnerships trends, and intellectual engagement of employees. In addition, service processes do have different dimensions and attributes of their own, especially in terms of the roles of people and machines. Unlike in manufacturing, which is equipment- or machines-heavy, service processes are more people-driven. Table 1.3 demonstrates the differences between service and nonservice businesses.
Table 1.3. Service and Nonservice Business Differences
Business Attributes | Nonservice Businesses | Service Businesses |
|---|---|---|
Customers | Customer requires tangible outputs, measurable performance, and ability to easily get it corrected; customer is less engaged from operations. | Customer requires intangible outputs; it is difficult to measure performance and easier to redeliver rather than repair; customer is likely to be involved in the delivery operations. |
Outputs | Products, parts, or systems create experience. | Experience creates the output. |
Processes | Series of operations involving machines, material, method, and people. | Series of activities involving people, material, tools, and methods. |
Inputs | Tangible raw material. | Intangible information. |
Suppliers | Many suppliers depend upon the complexity of the solution. | Fewer suppliers with stronger relationships. |
Recent emphasis on business governance, such as the Sarbanes Oxley (SOX) Act, has imposed compliance requirements regarding the business performance. Accordingly, public companies are required to evaluate and disclose the effectiveness of their internal controls and be audited by a third party to disclose their performance specifically relating to financial reporting. Privately held firms, on the other hand, have not been affected by the SOX Act. Industry perceptions of the SOX Act indicate it has an associated cost that has adversely affected business performance. However, the general perception is that SOX has improved awareness of the dependability of the reported business performance. Thus, having effective performance measures will help any type of governance regulations.
The post-information age trend is to use information or extract business intelligence. This initial emphasis on using the information led to the concept of dashboards. While dashboards remain, the necessary business intelligence is lacking without a comprehensive business scorecard model. Most of the dashboards are creative in displaying and reporting the information; however, they are difficult to utilize on the operations side due to an inability to extract business intelligence from them.
Thus, there is a growing need for intelligent scorecards that can predict information. According to Jeff Hawkins in his On Intelligence book, intelligence implies the ability to predict. Therefore, holistic and comprehensive business scorecards that include leading indicators (rather than lagging indicators) provide the intelligence to optimally manage business performance.
The Six Sigma Business Scorecard, as shown in Figure 1.1, offers a predictive indicator of business performance, called BPIn (Business Performance Index), that is determined based on a set of ten measurements used to identify areas for improvement and to set goals to achieve overall business performance. The BPIn, which is based mainly on the operational measurements, can provide a good indicator of the company’s financial performance. An operations-based index can predict the financial performance, so the management team can take preventive actions to achieve the desired financial results.
The BPIn can also be used to determine the corporate sigma levels, which are essential to sustain Six Sigma initiatives at a corporation. In the absence of the business-level performance measures, any corporate strategic initiatives become difficult to track, thus affecting their chances of success. According to Kaplan and Norton, only about 10 percent of strategies are successfully executed.
The Service Scorecard should balance cost and revenue, improvement and innovation, management and employees, and execution and growth. This Service Scorecard must also balance the objective and subjective measurements, which are sometimes difficult to measure but that must be measured.
No performance scorecard with only objective measures can present a complete picture of the performance, because all businesses incorporate tangible and intangible assets. Actually, the ratio of intangible to tangible assets increases from manufacturing to service operations. In other words, service operations deal with more intangibles than tangibles, because the service operations are more dependent on people and, thus, are more subjective in nature. In the manufacturing sector, the objective is to reduce the cost of each widget and make it more reproducible. However, in the case of service operations that are more customized, more flexibility and variations to delight customers are required.
With the integration of technology and globalization, certain shifts occur from manufacturing to service operations (i.e., from the Business Scorecard to the Service Scorecard). For example, the manufacturing operations deal with suppliers of parts, material, and services. In the service industries, however, the focus is on intangible relationships involving various stakeholders and even customers. Establishing partnerships and collaborating with customers and suppliers is the goal.
Another shift occurs from manufacturing to service industries in the sense of execution. In manufacturing the focus of execution is excellence first before timeliness to minimize waste. In the service industries, however, the focus is often on responsiveness before perfection. Customers being served like to feel cared for before being served. Thus, the focus of execution in service operations must be on agility, care, and creativity in delivering customers what they love to have, which may be different every time a customer needs service.
The Service Scorecard Architecture presented in this book has seven categories or elements: Growth, Leadership, Acceleration, Collaboration, Innovation, Execution, and Retention (GLACIER). The Service Scorecard was created for achieving the fundamental strategy of any business: sustained profitable growth. Instead of focusing on making money (or profit at any cost), the leadership must focus on realizing profitable growth. This shift requires the utilization of other aspects of the business. A good performance scorecard must trigger critical aspects of the business for achieving its fundamental strategy, which must be constantly articulated for successful internalization by everyone on the executive team.
Growth requires critical thinking at the leadership level for assessing industry position and caring for customer needs. To grow the business, the leadership must clearly understand what its customers would love to have. Only when we care enough to listen to the customer’s love-to-have requirements will we establish a successful and profitable relationship with the customer. Knowing the future needs of current customers and the needs of potential customers allows the service provider to develop new solutions to serve its customers.
Leadership is considered great when it can bring out the best in its followers, be it 1, 10, 100, or 1,000s in number. Unless people are mobilized to achieve the fundamental business strategy and objectives, sustaining profitable growth will be a daunting task. One of the best known ways to bring out the best in people is to recognize the best of people. Good breeds more good, and success breeds more success; thus, recognition of success will bring out more success. Besides, the leadership must ensure that the business is profitable while it is growing; otherwise, employees will perceive their work as a waste of their time.
Acceleration is defined as the rate of improvement to achieve ideal or desired business objectives. Accelerating improvement and reduction in waste will continually contribute to the bottom line of the company. Besides, customers ask for better, faster, and more value—not cheaper service. To provide more value faster and better requires each department manager to focus on producing more, better and faster. Ultimately, the best corporate performance will be governed by the worst departmental performance. Basically, the worst of a company is the best it can deliver to its customers. Acceleration in performance improvement continually raises the bar for higher value to the customer.
Collaboration is an imperative when accelerating performance. If a department or process has a goal to improve 5 percent per year, people usually wait for the change to come by itself; they generally do not challenge themselves to achieve improvement. The 5 percent improvement is not aggressive enough to challenge them and cause them to seek help. However, if the goals for improvement are set aggressively, collaboration from other departments, processes, or people will be required to accelerate improvement. Achieving 50 percent or more improvement requires passion to collaborate for achieving desired results.
Innovation is an outcome when people collaborate. When people work together, new ideas abound, creativity is cultivated, and innovative solutions are the outcome. Innovation to achieve growth through R&D (research and development) functions has been inefficient and slow at best. Typically, an R&D department develops a new product or service that is delivered through operations with a ton of challenges. The resulting quality and efficiency degradation leads to unsatisfactory results and delays delivery of products or services. Thus, the involvement of operations throughout the service life cycle accelerates improvement at any level.
Execution represents producing or providing service with optimum resources on time and delighting the customer. In service businesses, the customer experiencing joy matters because people are involved. Customers tend to be sensitive to receiving service without a smiling attitude. Thus, in service execution, people processes must be designed to facilitate agility, care, and creativity, as well as a sense of going the extra mile to please the customer. Basic process management principles still hold true for service processes as well; the people aspects just need extra attention.
Repeat business from customers receiving service, or Retention, is fundamental to survival as well as achieving sustained profitable growth. The cost of new customer acquisition in the service sector is much higher than that of keeping a repeat customer. Thus, effort must be invested in listening to the customer for growing requirements and customer feedback to identify opportunities for improvement. Repeat business pays for the expenses, and the new business pays for the profit. A service business cannot survive without repeat customers. Thus, specific strategies must be developed to bring the customer back continually, irrespective of the nature of the service.
Identifying and establishing Service Scorecard measurements requires that we identify the purpose of the Service Scorecard and its expected value proposition. Is the purpose of the scorecard to display some information in the form of some dashboard, or to analyze and use the information to identify and exploit opportunities for improvement? The Service Scorecard can be used for realizing the fundamental business strategy of achieving sustained profitable growth, to monitor profit, or to communicate information with stakeholders. To establish measurements in different areas, answering the following questions can be helpful:
What does one do?
Why does one do it?
Who does one do it for?
How will one know one has done it?
The measures are identified based on strategic outcomes, client benefits, and the process outputs. Another way of establishing measurements for an element of the scorecard includes answering the following questions:
What is the purpose of the Service Scorecard for an organization?
What is the purpose of each element of the scorecard?
What is the expected deliverable as a result of each element of the scorecard?
What is the measure of success for each element of the scorecard?
What are the activities to be performed in implementing the required measurement?
What are the critical elements of the activities to be performed?
What are measures of success for critical elements in question 5?
Opportunities abound for a service operation to be striving for excellence. In the so-called “service economy,” our experience shows more customers are dissatisfied with the service due to a variety of reasons. The Service Scorecard can create the “love” for customers, improve business performance, and foster high employee participation and joy.
The service sector is an important sector in world economy.
Service can be defined as a transaction or as an experience.
Measuring the performance of services is challenging, and traditional models are inadequate for this purpose.
The Six Sigma Business Scorecard needs to be adapted to the services context.
The Service Scorecard Architecture has seven elements: Growth, Leadership, Acceleration, Collaboration, Innovation, Execution, and Retention (GLACIER).