Chapter 2. Process and Quality Fundamentals
What is the Objective of This Chapter?
The objective of this chapter is for you to have fun while we teach you the meaning of: (1) a process or system, (2) variation in a process or system, and (3) quality of a process, product, service, policy, procedure, etc. These concepts will prepare you for what is to come in the rest of the book. Before you can improve a process, it is crucial that you understand the building blocks of process, variation in a process, and the definitions of quality, and their significance.
Process Fundamentals
What is a process?
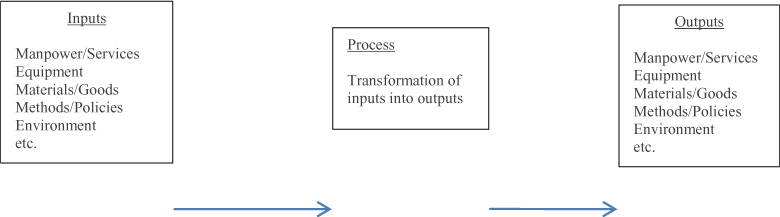
A process is a collection of interacting components that transform inputs (elements that the process needs to execute) into outputs (the results of the process) toward a common aim, called a mission statement (Gitlow and et.al, 2005). A mission statement for a hospital could be “to be a world class provider of medical services to the community”. A mission statement for an individual, in this case one of the authors, is “to generate positive energy into the universe”. For example, this is helpful when I am driving. I am an impatient driver and get frustrated when someone is in my way. My mission statement directs me to just relax and take it easy; getting to my destination 2 minutes later isn’t worth the frustration. Figure 2.1 shows how a process transforms inputs into outputs.
Figure 2.1. Transforming Inputs into Outputs
Where do processes exist?
Now that we know what a process is, the next question is: where do processes exist (Gitlow and et. al., 2005)? Well, processes exist in all facets of organizations, as well as everyday life. An understanding of processes is crucial if you want to improve the quality of your organization and/or the quality of your life. Remember, work and life processes are not mutually exclusive, so feel free to improve them both at the same time! Many of us mistakenly think only of production processes. However, if you think about it: processes are everywhere - administration, sales, service, human resources, training, maintenance, paper flows, interdepartmental communication, and vendor relations are all processes you will see at work. Importantly, relationships between people are also processes. How about your daily life? From when you wake up in the morning to when you leave for school or work is a process, cleaning your house is a process (not exactly a fun one), making plans with your friends is a process (depending on your friends it can be a complicated one!).
It is critical for top management of an organization to have a process oriented view of their organization, and life, if they are to be successful with the style of management we will be presenting in this book.
Why does understanding processes matter?
Most processes can be studied, documented, defined, standardized, improved, and innovated. Any situation in your life or work, where an input is turned into an output, involves a process. Consequently, acquiring the tools to improve processes is going to make your life and work a whole lot better!
What is a feedback loop and how does it fit into the idea of a process?
A feedback loop is the part of a system that takes the actual outputs (data in one form or another) of a step in a process and feeds them back/forward/sidewise to another step in the process to determine if the desired outputs were generated by the process step (Gitlow and et. al., 2005). The purpose of a feedback loop is use the data from it to close the gap between what was desired of the process output and what outputs were actually delivered by the process. In layman’s terms, did you get what you wanted out of the process; if not, the feedback loop is going to provide data to help you improve the process. As a result of the process improvement, the next time there is a better chance you will get the desired process output.
Some process examples to bring it all together!
Let’s review some examples that will really help you understand the process concepts we have covered so far namely inputs, outputs, feedback loops and aims/missions.
Process example #1 – The Background Check Process
An example of a process that is an important human resources process is the background check that is usually the last major process completed before hiring a new employee. The hiring manager will give human resources the name of the person they would like to hire and then human resources begins the background check process. The aim of this process is to make sure the new employee does not have any showstopper skeletons in their closet that will put the organization at risk. Figure 2.2 shows the inputs, process, and outputs of performing a background check on an employee. The inputs that include: the candidate’s hiring application, their consent form for the background check and the recommendation to hire by the hiring manager. The process involved in this transformation of inputs into outputs includes: reviewing criminal records, reviewing educational records, reviewing driving records and so on. The output in this example would be the completed background check report. An important aspect of this process is the feedback loop that enables the human resources manager to report back to the hiring manager on the employee’s appropriateness for a given job.
Figure 2.2. Background Check Process

Process example #2 – Leonard’s head searching process
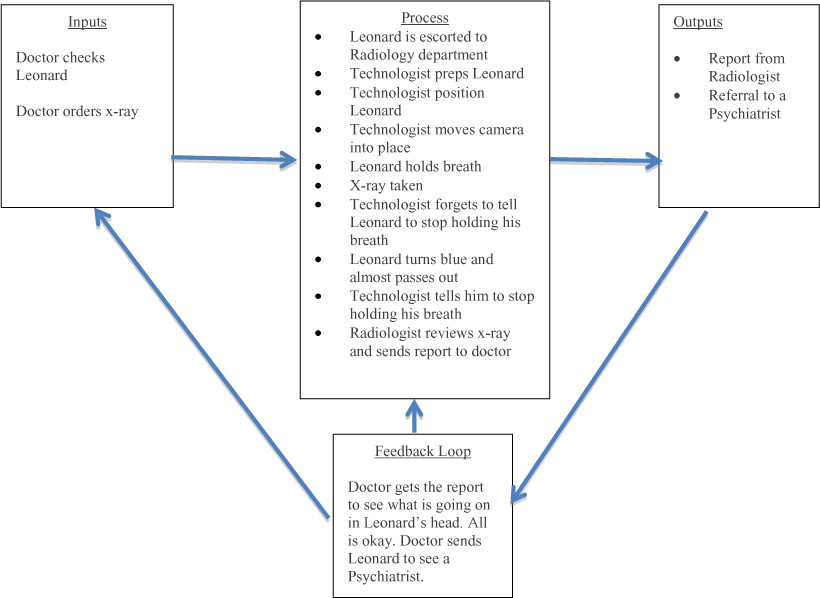
The execution of different types of diagnostic testing can also be thought of as processes. Consider the case of Leonard who goes to the doctor. The doctor senses something is really ‘off’ with Leonard, so his aim is to figure out what it is. The inputs to the process are the doctor checking Leonard, looking at his past medical records, and ordering an MRI of Leonard’s head. The process involves Leonard being escorted to the Radiology department, the technologist prepping and positioning Leonard, the technologist telling him to hold his breath, and then taking his picture. Unfortunately, the technologist does not tell Leonard to stop holding his breath, so his face starts to turn blue and he almost passes out. Luckily, the technologist is on her game so she immediately tells him to breathe and he quickly recovers. The radiologist then reads the report and the output involves the report being sent to the doctor. As for the feedback loop, it seems like the doctor’s hunch was correct as to what is going on in Leonard’s head – nothing!! Since there is nothing going on in Leonard’s head, the doctor sends Leonard to see a Psychiatrist.
Figure 2.3 depicts the process of trying to figure out what is going on in Leonard’s head.
Figure 2.3. Leonard’s Head Searching Process
Process Example #3 – Patient’s day of surgery process
Another example of a process is the pre-surgery process that a patient goes through the day of surgery. The aim is to ensure that the patient is ready to proceed with the surgery as planned. Figure 2.4 shows the inputs, process, outputs, and feedback loop of the patient’s day of surgery process. The inputs which include: the patient’s surgery information packet, the blood bank band (if required), medications currently taken and pre-op testing clearance form. The process involved in this transformation of inputs into outputs includes: being driven to the hospital by a responsible adult, waiting, filling out necessary paperwork, waiting, filling out more paperwork, waiting, receiving ID bracelet with your name misspelled, waiting, receiving new ID bracelet with your name now spelled correctly, waiting, getting in awkward looking gown, waiting, giving your belongings to a nurse, praying you will see your belongings again, waiting, speaking to anesthesiologist, waiting, go to pre-op area and confirming with staff the procedure you are having with them, waiting. The output in this example would be the patient ready for surgery. An important aspect of this process is the feedback loop that enables the pre-op area to give feedback to staff upstream in the process if the patient is not ready for surgery.
Figure 2.4. Patient’s Day of Surgery Process

An Anecdote about No Feedback Loops
John and Mary have a really troubled marriage, and they have had it for 40 years. They never talk to each other; in other words, they have no feedback loops in their marriage to use to possible make their lousy situation better. Over time, their relationship continues to deteriorate; now they have a loveless marriage highlighted by angry silence.
An Anecdote about only common cause feedback loops
One of the authors grew up in a two-story house. My bedroom was on the second floor. When I was about 5 years old, one night I snuck downstairs to see what my parents were doing. Lucky for me they weren’t making me a baby sister, so I missed that trauma. Well, they were having a conversation about my father’s upcoming trip to China. He said to my mother: “I have to get a Gama globulin shot and the needle is a foot long.” At that point two things stuck in my mind. First, was that I heard a really big word and wanted to brag to my friends that I knew a big word like Gama globulin, even though I had no idea what it meant. Second, was that needles existed that were a foot long, and I hoped I would never see one.
Fast forward 50 years, and I am booked to go on a trip to China and my physician tells me that I need a Gama globulin shot. As amazing as it may seem, I actually remembered that the needle was a foot long. Dear reader please understand that this foot long fact was hard wired into my brain; I didn’t think about it rationally; I just unconsciously accepted it.
Needless to say, I was sweating bullets when I went to get the shot. I assumed the position for the shot; arms on the examining table with my pants and underwear around my ankles, butt pushed out and ready for the railroad spike to be inserted into my butt cheek. In my opinion, the nurse was taking too long to give me the shot, so I angrily said to her: “Give me the damn shot’. She said: “I already did.” I called her a liar because if someone was going to stick a railroad spike in my butt I would be the first to know about it. She got extremely offended and came over to me and flicked my butt where she had given me the shot, and sure enough she wasn’t lying. Well, I went from hating her to thinking she was Florence Nightingale; the best nurse and shot giver ever born.
I left the office and sent an email to my physician, who also is the Chief of the Clinic, saying that the nurse was the best shot giver in the world and they should all congratulate themselves on being world class!
The next part of the story is my fantasy of what happened after the email was sent. In reality I have no idea what happened, but here is my fictional account of the transpiring events. Everyone in the office knew that I was an expert in process improvement, so my email may have carried some weight. My doctor went out into the office and read the email out loud to the entire office staff, congratulating them on jobs well done.
The next bit of the story takes a dark turn; I imagined that another patient came in and got a Gama globulin shot and moved while it was being inserted into his or her butt, causing great pain. She yelled at the nurse and complained about the horrible and painful medical service delivered by the clinic to my doctor; the Chief of the Clinic. At this point he assembled all the office staff and berated them for sloppy work. They went from elated to depressed. The moral to this story is that if you always respond to common cause of variation as if they were special causes of variation you are micro managing people, and it will drive them crazy, and increase the variation in their performance of their jobs.
Variation Fundamentals
What is variation in a process?
As we saw in our examples above, each process has one or many outputs and each of these outputs may be measured. The distribution of these measurements will vary and the differences between these measurements are what we call process variation.
Anecdote about your Daily Moods
Each day you wake up and your mood is slightly different, or maybe a lot different than it was the day before, and the day before that, and so on. Your daily moods form a distribution of daily moods. Most of the time your mood is around your average mood. The further your daily mood is from your average daily mood, the less frequently this particular mood will happen. Your daily moods may well form a bell shaped distribution. If the distribution is skinny, then your daily mood may well be predictable into the near future with a high degree of belief. If the distribution is fat, then your daily mood may not be so predictable into the near future with any degree of belief. That’s life! Process improvement is largely about making your distribution of daily moods skinny around a mean of high happiness. Remember, that 10% of the time you will be in your bottom ten percent of your moods; this is a mathematical fact. The only way you can do anything about this is to shift your mood distribution further in the direction of your happiness metric. Process improvement can help.
Why does variation matter?
Variation matters because it is a fact of life. All processes exhibit variation, even if it is too small to measure. When making a plan, you must consider whether the assumptions of your plan will be in place when you execute the plan. Unfortunately, each assumption of your plan is the output of some process, which will exhibit variation.
For example, I plan to go to a 7:00pm movie with my friend Neal, but he shows up at 7:25pm. Variation has ruined my movie plans. Variation matters; it needs to be reduced so prediction into the near future is possible with some degree of comfort.
Figure 2.5. Variation is Everywhere!
Source: managementwisdom.com
What are the two types of variation?
The two types of variation (Deming, 1982, 1986, and 1994; Gitlow and Gitlow, 1987) are common causes and special causes of variation.
Common variation is variation due to the design, management, policies and procedures of the system itself; this type of variation is the responsibility of management. An employee cannot change the system he or she works in; only management can do that,
Special variation is variation that is external to the system; it disrupts the system from its routine generation of common variation. Special variation is the responsibility of front line employees; however, front line employees may need management’s help sometimes to deal with a special cause of variation.
The outputs from all processes and their component parts vary over time. Your body has a process that does a very good job of generating and removing heat. The measurement that is used to measure your body’s ability to do this is your body temperature. Despite large variation in temperatures outside of you, your body does a great job of keeping your body temperature within a safe and stable range. If your body is too hot your blood vessels expand to carry the excess heat to the surface of your skin in the form of sweat and when the sweat evaporates it cools your body. If your body is too cold your blood vessels contract so that the blood flow to your skin slows to conserve heat, your body may shiver in response to create more heat. Under normal conditions both sweating and shivering help keep your body temperature within safe and stable levels.
Normal body temperature is said to be 98.6 degrees Fahrenheit, so it can go as high as 99.6 degrees Fahrenheit and as low as 97.6 degrees Fahrenheit throughout the day depending on the time of day and how active you are. This slight variation in your body temperature occurs all the time and is an example of common variation, or variation due to the system.
Now, let’s say you get sick and your body temperature jumps up to 101 degrees Fahrenheit. This would be a special cause of variation because it would have been caused by a change external to your body’s heat management process - that is, getting sick.
If you hadn’t of gotten sick your body’s heat management process would have continued on its former path of common variation. Note that if you get sick a lot then it might be a common cause of variation. Later in the book we will give you specific tools to understand how to distinguish between special and common causes of variation.
The capability of a process is determined by inherent common causes of variation such as poor hiring or training processes, inadequate work environments, poor information technology systems, or a lack of policies and procedures to name just a few. Front line employees cannot change those types of processes, so they should not be held accountable for their outcomes. Managers need to realize that unless changes are made to those processes, the capability of the outcomes will remain the same. And, only they can change the processes!
Special causes of variation on the other hand are due to events outside of the system such as a natural disaster, problematic new supplies or equipment, or problem with a new IT system to name just a few. Please note that special variation is ALWAYS detected by statistical signal, not human logic.
Due to the fact that variation causes the customer to lose confidence in the reliability of the dependability and uniformity of outputs, managers need to understand how to identify and reduce variation. Using statistical methods, employees can identify different types of variation so that special causes of variation can be resolved (they can be good or bad) and common variation can be reduced via process improvement projects resulting in more uniform and reliable outputs.
Anecdote on special versus common causes of variation
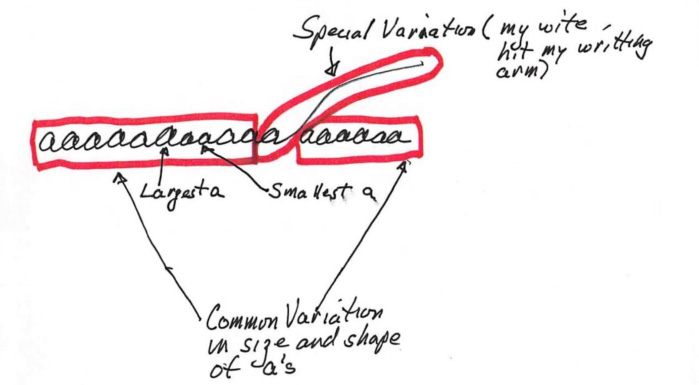
To demonstrate the difference between special and common causes of variation let’s give another example. A friend of the authors was sitting at the kitchen table on a Sunday morning practicing his penmanship, more specifically his little letter ‘a’. He kept writing the little ‘a’ over and over hoping he could perfect it when all of a sudden his wife walked by and accidently hit the arm he was writing with causing a much larger tail on one of the ‘a’s. This example helps explain the difference between special and common causes of variation. Most of the variation in the size and shape of the a’s is due to common causes of variation as they are all pretty close in size and shape but when something external happens to the process (his wife hitting his arm) you see a big difference in the size and shape of that letter ‘a’. You are probably wondering why someone would spend time actually practicing one letter, the only explanation we can come up with is that he is a Type a personality!
How to demonstrate the two types of variation
Dr. Deming used to conduct workshops to demonstrate special and common causes of variation; the workshops are called the Funnel Experiment and the Red Bead experiment.
The Funnel Experiment
Purpose and Introduction
The Funnel Experiment (Boardman and Iyer, 1986; Gitlow and et.al, 2005)) to show that adjusting (or tampering with) a stable process that is exhibiting only common causes of variation will increase the variation in the output of the process, depending on how the process is adjusted.
In the experiment a marble is dropped through a funnel onto a piece of paper that has a point that serves as the designated target. The objective is to get the marble as close to the target as possible, the experiment uses various ‘rules’ to attempt to minimize the distance between the spread of the marble drops (results) and the position of the target. For each ‘rule’, the marble is dropped 50 times and its landing spot is marked on the piece of paper.

Conclusion and takeaways
• The Funnel Experiment illustrates how a system behaves when it is tampered with.
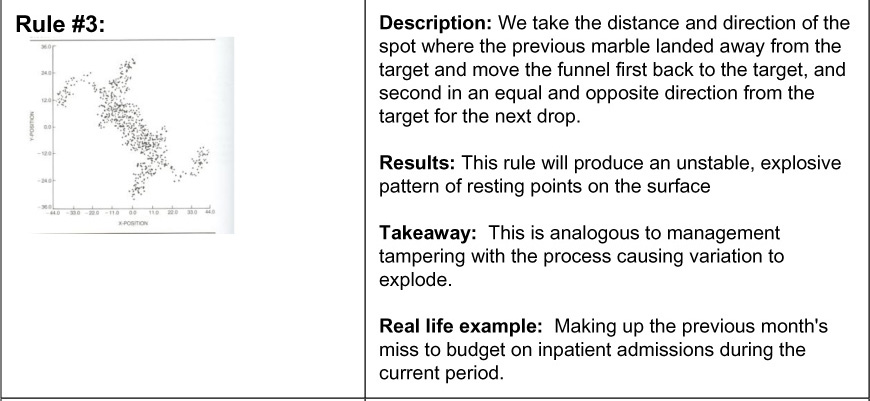
• Rules #2, #3, #4 are analogous to management tampering with a process without profound knowledge of how to improve the process through statistical thinking. This will increase the process’s variation and reduce their ability to manage that process.
• Instead of using Rules #2, #3, 4, the better approach would have been to create a control chart of the output of Rule #1. We would have seen that the process was stable and in control and instead of tampering, the best course of action would be to improve the process. Some ways to improve the process could be lowering the height of the funnel or using a funnel with a smaller diameter.
An Anecdote About Rule 4 of the Funnel Experiment
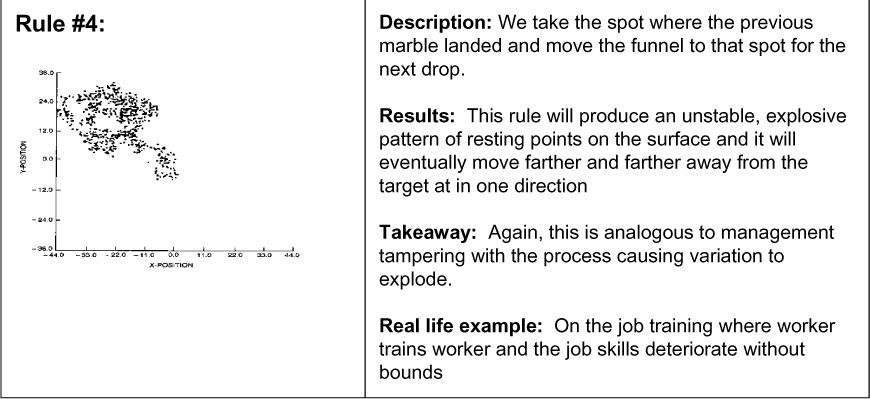
One of the authors was consulting for a factory and met an engineer who was working 12 to 14 hour days, seven days a week, for many years. He was still married which surprised me. One day he asked me a statistics question that didn’t seem to have anything to do with his job. I answered his question, but started to observe him so I could understand his job better. What I discovered was that every time a manager senior to him changed positions, which was relatively frequently given the number of years he was on the job, the new manager would give Doug some new tasks to do. Doug was a “get things done” kind of guy. As the years progressed his list of things to do increased to the point of absurdity. Doug’s job is a perfect example of rule 4 of the funnel experiment; it kept expanding without bounds. He never asked his new manager if all the data he was collecting and the reports he was writing were still desired by the his new manager. Most likely, the new manager would have eliminated many of the tasks he was doing for previous bosses, but he never asked and the manager never questioned Doug about his workload. Doug was a wheel that didn’t squeak. This is a perfect example of rule 4 in operation.
Red Bead Experiment
Purpose and Introduction
W. Edwards Deming used the Red Bead Experiment to show the negative effects of treating common variation as special variation. It is discussed in this section to further enhance your understanding of common causes and special causes of variation (Deming, 1994; Gitlow and et. al., 2005).
The experiment involves using a paddle to select beads from a box that contains 4,000 beads. The box contains 3,200 white beads and 800 red beads. This fact is unknown to the participants in the experiment. Components of the experiment include a paddle with 50 bead size depression, another box for mixing the beads, as well as a foreman in the Quality Bead Company who hires, trains, and supervises: four “willing workers” to produce white beads, two inspectors of the willing workers’ output, one chief inspector to inspect the findings of the inspectors, and one recorder of the chief inspector’s findings.
The job of the workers is to produce white beads, since red beads are unacceptable to customers. Strict procedures are to be followed. Work standards call for the production of 50 beads by each worker (a strict quota system): no more and no less than 50. Management has established a standard that no more than three red beads (6%) per worker are permitted on any given day. The paddle is dipped into the box of beads so that when it is removed, each of the 50 holes contains a bead. Once this is done, the paddle is carried to each of the two inspectors, who independently record the count of red beads. The chief inspector compares their counts and announces the results to the recorder who writes down the number and percentage of red beads next to the name of the worker.
The Results
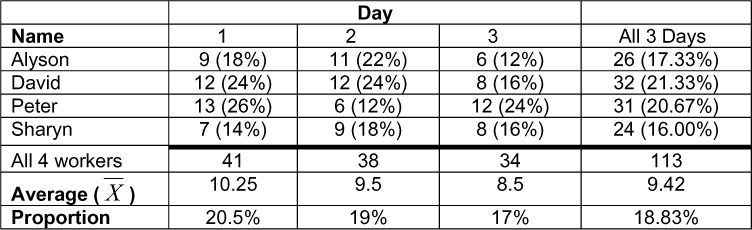
On each day, some of the workers were above the average and some below the average. On day one, Sharyn did best with 7 red beads, but on day 2, Peter (who had the worst record on day 1) was best with 6 red beads, and on day 3, Alyson was best with 6 red beads. The results for the four workers over three days are displayed in Table 2.1 below:
Table 2.1. Red Bead Experiment Results for 4 Workers Over 3 Days
Takeaways from the Red Bead Experiment
1. Common variation is an inherent part of any process. The variation between the number of red beads by worker by day is only due to common variation.
2. Managers are responsible for the common variation in a system; they set the policies and procedures. If managers are unhappy with the number of red beads, then they should take actions; for example, get a new supplier of white beads with less red bead per load.
3. Workers are not responsible for the problems of the system, that is, common causes of variation. The system primarily determines the performance of workers. The quota of no more than 3 red beads per day per worker is insane. This is the case because it is beyond the capability of this company to achieve that quota; 20% of the beads are red, so in a load of 50 beads you would expect an average of 10 red beads per worker, per day.
4. Some workers will always be above the average, and some workers will always be below the average.
5. Some workers will always be in the bottom 10% because all distributions have a bottom 10% of units.
Quality Fundamentals
Definition of Quality
Quality is a term we hear frequently: that is a quality automobile, she is a quality person, and this is a quality stock. Most people equate high quality with a big price tag, and low quality with a small price tag. The purpose of this section is to debunk this outdated notion of quality and to explain what it really means.
Goal Post View of Quality
When watching a game of American football, as long as the ball is kicked between the goalposts, no matter how close to either goalpost, it is considered ‘good’ (Gitlow and et. al., 2005).
In quality the same used to be true as quality meant “conformance to valid customer requirements.” That is, as long as an output fell within acceptable limits (the goalposts), called specification limits, around a desired value, called the nominal value (denoted by “m”), or target value, it was deemed conforming, good, or acceptable. The nominal value and specification limits are set based on the perceived needs and wants of customers.
Figure 2.6 shows the goal post view of losses arising from deviations from the nominal value. That is, losses are zero until the lower specification limit (LSL) or upper specification limit (USL) is reached. Then, suddenly they become positive and constant, regardless of the magnitude of the deviation from the nominal value.
Figure 2.6. Goal Posts View of Losses Arising from Deviations from the Nominal Value
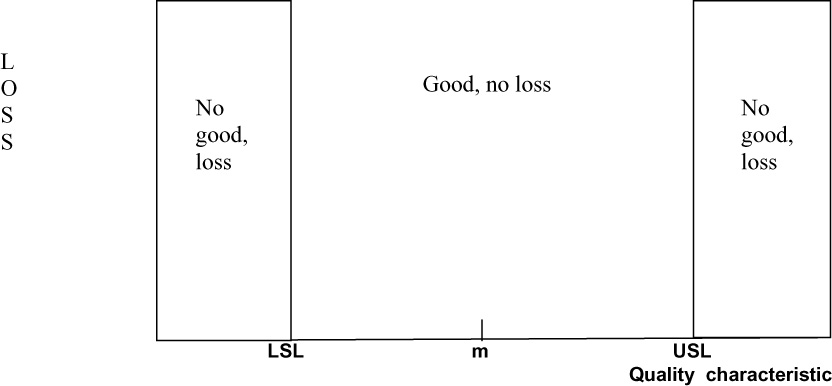
Quality characteristic
As an example of the goal post view, the desired diameter of a prescription container in a hospital pharmacy is 25 mm (the nominal value). A tolerance of 2 mm above or below 25 mm is acceptable to pharmacists. Thus, if the diameter of a prescription container measures between 23 mm and 27 mm (inclusive), it is deemed conforming to specifications. If the diameter of a prescription container measures less than 23 mm or greater than 27 mm, it is deemed not conforming to specifications as the lids will hardly fit, and is scrapped at a cost of $1.00 per container which is a stiff pill to swallow. In this example, 23 mm is the lower specification limit and 27 mm is the upper specification limit.
Takeaway: Output merely has to be between specification limits; that is, the diameter of the prescription container must be anywhere from 23 to 27 inclusive.
Continuous Improvement Definition of Quality – Taguchi Loss Function
As the definition of quality has evolved, its meaning has shifted. A modern definition of quality states that: “Quality is a predictable degree of uniformity and dependability, at low cost and suited to the market.” (Deming, 1982) Figure 2.7 shows a more realistic loss curve developed by Dr. Genichi Taguchi in 1950 (Taguchi and Yu, 1980), called the Taguchi Loss Function (TLF). Using the TLF view of quality, losses begin to accrue as soon as a quality characteristic of a product or service deviates from the nominal value. As with the goal post view of quality, once the specification limits are reached the loss suddenly becomes positive and constant, regardless of the deviation from the nominal value beyond the specification limits.
Figure 2.7. Continuous Improvement View of Losses from Deviations from the Nominal Value
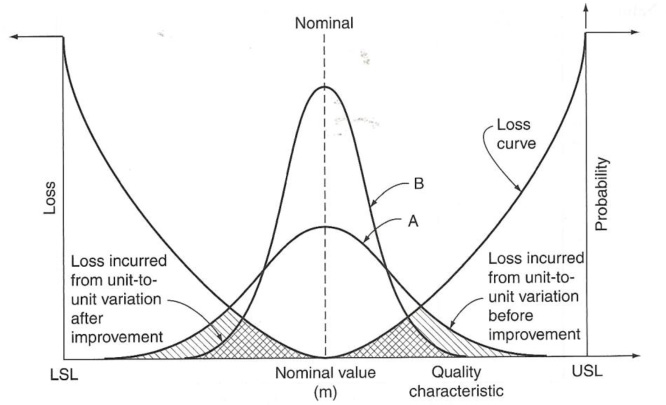
Curve A represents the distribution of output of the process before process improvement. Curve B represents the distribution of output of the process after process improvement. The hatched area under the loss curve framed by the distribution of output represents the cost of poor quality. As you can see, the area under the Taguchi Loss Function for curve A is both single and double hatched; however, the area under the Taguchi Loss Function for curve B is only double hatched. So, decreasing the variation in the distribution of output (from curve A to curve B) decreases cost, absent capital investment.
Takeaway
Reducing unit to unit variation around the nominal value always makes sense, absent capital investment. At that point it becomes a cost-benefit decision for management.
More Quality Examples
An individual visiting an outpatient clinic expects to wait an hour to see the physician but if she has to wait five hours she will perceive the quality to be poor and she probably won’t come back.
If a materials management worker receives orders from a supplier without any missing supplies, her needs will be met and she will perceive the quality of that supplier as good, that is unless the supplies are bad.
If a patient in the hospital finds a clean, comfortable room on a quiet floor, he will feel that his expectations were met. But if the room is not clean or there is constant noise that affects his ability to sleep, the patient will perceive that the quality is poor and seek revenge by giving the hospital crappy patient satisfaction scores.
Takeaways from This Chapter
• Processes transform inputs into outputs.
• Processes are everywhere in our lives and our jobs, improving our lives and/or jobs is accomplished by improving our processes.
• Feedback loops utilize data to help us improve our processes.
• Variation consists of the differences in the distribution of the measurements of outputs from a process.
• Variation limits your ability to predict the future outcomes of a process.
• There are two types of variation; special causes and common causes.
• Common causes are inherent to the system and are the responsibility of management.
• Special causes are external to the system and the responsibility of front line workers.
• Dr. Deming used the Funnel Experiment to show that tampering with a process makes things worse and the Red Bead Experiment to show that common causes of variation are inherent in any system and that you cannot expect employees to produce beyond the capability of the system.
• The goalpost view of quality states that as long as the output is within specification limits it is considering good or conforming no matter how close it is to either specification limit.
• The Taguchi loss function shows that it is always advised to reduce variation around nominal, absent capital investment.
References
T. J. Boardman and H. Iyer, The Funnel Experiment, (Fort Collins, CO: Colorado State University, 1986.)
W. E. Deming (1982), Quality, Productivity, and Competitive Position (Cambridge, Mass.: Massachusetts Institute of Technology).
W. Edwards Deming (1986), Out of the Crisis, (Cambridge, MA: Massachusetts Institute for Technology Center for Advanced Engineering Study).
W. Edwards Deming (1994), The New Economics for Industry, Government, Education, 2nd edition (Cambridge, MA: Massachusetts Institute for Technology Center for Advanced Engineering Study).
H. Gitlow and S. Gitlow (1987), The Deming Guide to Quality and Competitive Position (Englewood Cliffs, N.J.: Prentice-Hall).
Gitlow, H., Oppenheim, A., Oppenheim, R., and Levine, D. (2005), Quality Management: Tools and Methods for Improvement, Richard D. Irwin, Inc., (Homewood, IL), 3rd edition.
[G. Taguchi and Y. Wu (1980), Introduction to Off-Line Quality Control (Nagoya, Japan: Central Japan Quality Control Association).