Chapter 13. Dmaic Model: ‘I’ is for Improve
What is the Objective of This Chapter?
The objective of this chapter is to take you through the various steps of the Improve phase of the Six Sigma DMAIC model so that you can apply them on projects at your organization. We will use a case study to demonstrate how the steps of each phase are executed in real world projects.
Purpose of the Improve Phase
Let’s go back to our equation CTQ is a function of one or more Xs or CTQ = f(X1, X2, Xi,....Xn) where:
• CTQ is a measure of your problematic key indicator.
• Xi represents the ith factor that causes your CTQ to be problematic.
First, we completed the Define phase and identified our CTQ(s). Second, we completed the Measure phase by operationally defining, conducting measurement systems analysis, collecting baseline data, and determining the capability of our CTQ(s). Third, we completed the Analyze phase by identifying potential Xs, and then we tested our theories on the Xs to determine which ones are most critical to improve the distribution of the CTQ(s).
This chapter focuses on the fourth phase of the DMAIC model, called the Improve phase. The purpose of the Improve phase is to identify alternative methods for performing each problematic step in a process as measured by an X; the alternative methods are called change concepts. A change concept is a new method for performing a step in a process to which that Xs is a metric, or a revised method for performing a step in a process for which that X is a metric. Change concepts are aimed at improving the stability, shape, variation, and mean of each CTQ.
The seven main deliverables for the Improve phase are:
• Generate alternative methods for performing each step in the process represented by one or more Xs to improve the stability, shape, variation, and mean of all of the CTQs
• Select the best alternative method (change concept) for all the CTQs
• Create a flowchart of the new improved process
• Identify and mitigate risk elements for the new process
• Run a pilot test of the new process
• Collect and analyze the pilot test data
• Implement the revised process on a trial basis
At the end of the Improve phase, the team conducts a tollgate review with the Project Champion, Process Owner, and Black Belt. This is where the team reviews what they have learned in the pilot test phase and a ‘go-no go’ decision is made by the Project Champion, Process Owner, and Black Belt. In other words, after comparing pilot test data with the baseline data are we happy enough to move to the Control phase and lock in our new process with documentation and training? If yes, and if everyone is satisfied with the team’s work, the team proceeds to the Control phase. If not, we return to the Analyze phase and try to find another set of Xs that can improve the distribution(s) of our CTQ(s).
The Steps of the Improve Phase
Generate alternative methods for performing each step in the process represented by one or more critical Xs to improve the stability, shape, variation, and mean for all the CTQs
The first step in the Improve phase is to identify alternative methods for performing each step in the process (called change concepts) represented by one or more critical Xs to improve the stability, shape, variation, and mean of each CTQ. The most important part of this step is to make sure you involve stakeholders who perform the process on a daily basis both for their process knowledge, as well as to get their buy-in when you go to pilot test, and then implement the revised process on a trial basis. There are various ways to identify potential solutions that we will cover below including: brainstorming, list of 70 change concepts, simulation, and experimental design.
Brainstorming
We use brainstorming in the Improve phase to elicit alternative methods for performing each step in the process represented by one or more critical Xs to improve the stability, shape, variation, and mean of each CTQ. Recall that brainstorming was discussed in detail in Chapter 6: Understanding Non-Quantitative Techniques: Tools and Methods.
List of 70 change concepts
While all changes do not lead to improvement; all improvement requires change. The ability to develop, test, and implement changes is essential for any individual, group, or organization that wants to continuously improve. But what kinds of changes will lead to improvement? Usually, a unique, specific change concept in one or more critical Xs is required to obtain improvement in one or more CTQ(s). Recall that the 70 change concepts were discussed in Chapter 6: Understanding Non-Quantitative Techniques: Tools and Methods.
Simulation
Simulation is a tool used to build a model (usually a computerized flowchart with arrival times and services times, etc.) of a process, and to perform experiments on the process to understand the behavior of the change concepts (critical Xs) on the stability, shape, variation and mean of the CTQ(s). A number of off-the-shelf simulation software products (for example, Arena) have significantly reduced the programming effort of building a simulation model. Now, users can allocate more time studying “what-if” scenarios. For more about simulation see: Gitlow, H., Levine, D., and Popovich, E. (2006), Design for Six Sigma for Green Belts and Champions: Foundations, DMADV, Tools and Methods, Cases and Certification, Prentice-Hall Publishers (Saddle River, NJ).
Experimental Design
Design of Experiments (DoE) is a collection of statistical methods for studying the relationships between the critical Xs, and their interactions with each other, on the distribution(s) of the CTQ(s). Experimental designs are used to study processes, products or services. The purpose of an experimental design depends on a level of knowledge available concerning the process, product or service being studied. For more information about experimental design (Gitlow and Levine, 2004).
Benchmarking
Benchmarking is a technique that can be used to discover alternative settings of the critical Xs (change concepts) to improve the distribution of the CTQ(s). Benchmarking was discussed in detail in Chapter 6: Understanding Non-Quantitative Techniques: Tools and Methods.
Lean Tools and Methods
Recall from chapter 7 that Lean tools and methods include: the 5Ss, Total Productive Maintenance (TPM), Quick Changeovers, Poka-Yoke, and Value Stream Mapping. Although we only discussed these briefly in chapter 7, it is important to realize that any or all of the lean tools and methods could be used as potential change concepts for one or more Xs that could be used to improve the distribution of the project’s CTQ(s). Please see the references in chapter 7 to learn more about Lean Thinking.
Select the best alternative method (change concepts) for all of the CTQs
Now that you have generated change concepts for each critical X that may optimize the stability, shape, variability, and mean of all of the CTQs, it is time to select the change concepts that you will implement in your pilot test. Team members will want to involve the people who work closely on the process to leverage their process knowledge and to facilitate buy-in in the process changes chosen. Often times the best solution will be obvious, so you just go with it. Other times there may be debate among team members as to which is the best set of change concepts. If this happens, team members will want to use a more objective method of selecting the optimal configuration of the process. Two alternatives for selecting potential configurations of the process are impact/effort matrices or decision matrices.
Impact/effort matrix
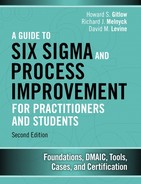
An impact/effort matrix, see Figure 13.1 below, is a tool used to assess the impact of potential configurations of the process based on the effort needed to execute them. It is setup as a 2x2 grid with effort needed to implement the solution on the horizontal axis and impact of the solution on the vertical axis.
Figure 13.1. Impact/Effort Matrix
After you place each configuration of the process in an appropriate cell, the next step is to determine the best one following impact-effort combinations:
Cell #1: High Impact, Low Effort: These are the solutions you probably want to go with.
Cell #2: High Impact, High Effort: You will need to further study the solutions, perhaps using a decision matrix.
Cell #3: Low Impact, Low Effort: You will need to further study the solutions, perhaps using a decision matrix.
Cell #4: Low Impact, High Effort: These are the solutions you probably want to avoid.
Decision matrix
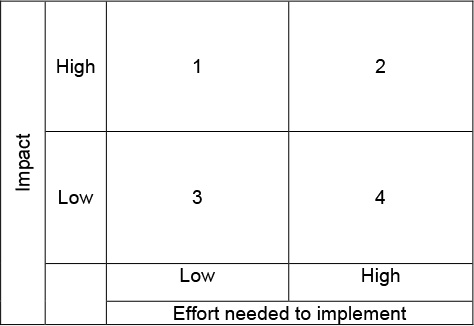
A decision matrix, see Table 13.1, is a tool used to choose among potential configurations of the process. The potential change concepts for a critical X are selected using a matrix that weighs the importance based upon certain criteria. The criteria are selected by the Process Owner and the Black Belt, with possible assistance from a person from the Finance department and a person from the IT department. The weights are frequently selected by the Finance department. You are free to use whatever criterion makes sense to the team members, the Black Belt, the Process Owner, and the Champion.
The cell values are assigned by process experts and are defined as follows: 0 = no relationship, 1 = weak relationship, 3 = moderate relationship, and 9 = strong relationship. The weights of the criteria are multiplied by the values in the cells in each column to get a weighted average for each alternative configuration (flowchart). Team members use this information to determine which is the best configuration for all of the CTQs. The example in Table 13.1 clearly indicates that configuration 1 (weighted average = 8.4) is the best configuration for the revised process.
Create a flowchart for the future state process
The next step in the Improve phase is for the team to complete a detailed future state flowchart of the process under study that takes into effect the change concepts proposed by team members. Remember, flowcharting was discussed in Chapter 6: Understanding Non-Quantitative Techniques: Tools and Methods in detail.
The two questions below will help you modify the current state flowchart into the future state flowchart:
What is the revised method (change concept) for each critical X?
Who is responsible for the revised method for each critical X?
Identify and mitigate the risk elements for new process
Now that you have selected the best set of change concepts for each X (the best practice flowchart) that optimizes the stability, shape, variability, and mean of all of the CTQs, it is smart to use risk management to identify risk elements. Risk elements address potential issues that may arise from proposed best practice flowchart of the process. One tool that you can use to identify potential risk elements and address potential solutions is to use Failure Modes and Effects Analysis (FMEA). FMEA was discussed in detail in Chapter 6: Understanding Non-Quantitative Techniques: Tools and Methods.
Run a pilot test of the new process
For many DMAIC projects it is beneficial to conduct a pilot test of the newly improved process before rolling it out on a full scale (Gitlow and Levine, 2004). The effect of the optimized and risk proofed revised best practice process are tested using a pilot study. A pilot study is a small scale test of the new best practice process. It can be in a limited number of locations for a trail period of time, or in all locations for a limited period of time. Whichever type of pilot study is used, its purpose is to validate the results from the newly identified best practice process on the distribution of all of the CTQs. Additionally, a pilot study is important to facilitate buy-in by stakeholders of revised best practice process.
The steps in conducting a pilot test of a revised best practice method are as follows:
STEP #1: PILOT TEST CHARTER
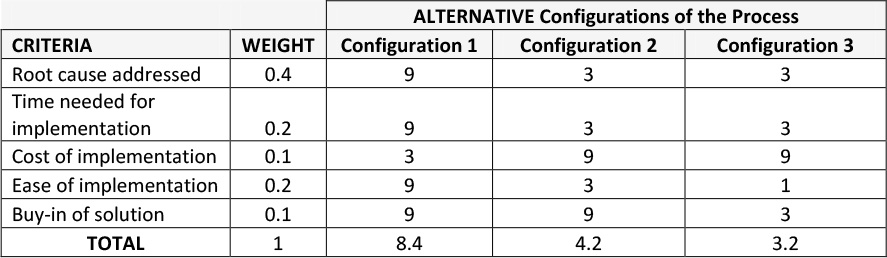
Team members prepare a charter for the pilot study, see figure 13.2 below. The charter answers the “5W1H” questions about the pilot study: Who, What, Where, When, Why and How.
Figure 13.2. Improve Phase Pilot Test Charter
STEP #2: PILOT TEST COMMUNICATION PLAN
Team members inform all stakeholders of the revised best practice process of the impending pilot study. This communication answers any questions the stakeholders may have about the pilot study. Recall that communication plans were discussed in Chapter 6: Understanding Non-Quantitative Techniques: Tools and Methods.
STEP #3: TRAIN RELEVANT EMPLOYEES
Team members train all relevant employees in the revised best practice process.
Collect and analyze the pilot test data
Next you are going to assess the extent of the improvement by collecting and analyzing data from a pilot test of the revised process. The steps for the pilot test are shown below.
STEP #1: CONDUCT PILOT TEST
Team members and appropriate employees conduct the pilot study on a small scale and/or for a limited time frame.
STEP #2: STUDY PILOT TEST RESULTS
Team members evaluate the results of pilot study on the distribution(s) of the CTQ(s). Several tips that may make a pilot study more effective are:
• First, it is important that team members are present when the pilot study is performed to uncover and observe problems.
• Second, team members should make sure that the test conditions are as similar as possible to actual conditions.
• Third, team members and appropriate employees should be sure to record the treatment levels for the critical Xs to highlight any unanticipated relationships between the critical Xs and CTQ(s).
• Fourth, all involved employees should collect control chart data and log sheet (diary) data from the pilot study.
• Fifth, team members should expect problems in the revised best practice method that did not surface during in the pilot study.
• Sixth, team members should compare the before and after control charts to determine the effect of the revised best practice process on the distributions of all of the CTQs
Go / No Go Decision Point
If the results from your pilot test were not to your satisfaction, you will want to understand what did not go as planned; tweak the process and conduct another pilot test. However, if the results of the pilot test met or exceeded your expectations, you will want to implement the newly improved process full scale.
At this point, once all of the tasks and sub-tasks of the Improve phase have been completed the project leader (Black belt) reviews the project with the Master Black Belt who critiques the Six Sigma theory and method aspects of the project. Then, a member of the Finance Department may want to critique the financial impact of the project on the bottom-line, a member of the Information Technology department critiques the computer/information related aspects of the project, a member of the Legal department comments on legal issues, if any, the Process Owner critiques the process knowledge aspect of the project, and the Champion critiques the political/resource aspects of the project. Finally, if all of the elements are acceptable a tollgate review is scheduled where the Six Sigma team presents its project to their Champion and the Process Owner for approval, see Table 13.2 below.
Table 13.2. Improve Phase Tollgate Review Checklist
At this point a go-no go decision on the project must be made. Are the benefits what we thought they were? Do they justify the time and resources we are spending on the project to the level that we want to continue? Do we want to change the focus of the project? The Project Champion and Process Owner will typically make this decision keeping in mind the mission of the organization while making this decision.
Keys to Success and Pitfalls to Avoid
• Tools like the Impact/effect matrix and decision matrix are useful when you have multiple best practice processes.
• Include stakeholders and opinion leaders when deciding on the best practice process will help facilitate critical buy-in to the new best practice process.
• Create a future state map for the new best practice process to help people understand how it works, and what expectations will be placed on them. This will facilitate buy-in by all stakeholders.
• Document the revised best practice process so you can train new and future employees.
• You may have to run multiple pilot tests to refine the process, don’t get discouraged, sometimes you have to almost run a mini-PDSA cycle during the Improve phase.
• Make sure the team is present during the pilot test(s) so they understand what is working and what is not working in the revised best practice process.
• It is important to ensure that the conditions experienced during the pilot reflect the conditions of the full process to ensure that all aspects of process variation are tested.
• Implementation of the process full scale is an exercise in project management; the more detailed your action plan can be in terms of tasks, who is responsible, status and timeline, the more successful it will be.
Case Study: Reducing Patient No Shows in an Outpatient Psychiatric Clinic
Improve Phase
Generate alternative methods for performing each step in the process represented by one or more critical Xs to improve the stability, shape, variation, and mean of all of the CTQs
The first step of the Improve phase for the team was to generate potential solutions for each of the critical Xs discovered in the Analyze phase. The following Xs were determined to be critical: X1: Reminder calls made to patients and X5: Age of patient and time of appointment. The team used brainstorming and benchmarking to come up with revised change concepts (methods) for the critical Xs.
Brainstorming
X5: Age of patient and time of appointment
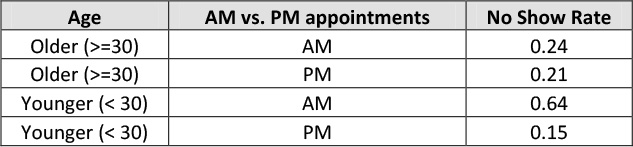
Well this was a no-brainer! The team again looked at the Analyze phase data for X5 in Table 13.3 below and decided it was obvious that patients younger than 30 years old should be scheduled in the afternoons. Their solution would be to modify the decision tree that their schedulers would use to ensure, if possible, patients younger than 30 years old were no longer scheduled in the morning.
Table 13.3. No Shows By Age and Time of Appointment
Benchmarking
X1: Reminder calls made to patients
Again, the team looked at the data from the Analyze phase, see Table 13.4 below. However, the data wasn’t as helpful as it was with X5.
Table 13.4. Data on Reminder Calls
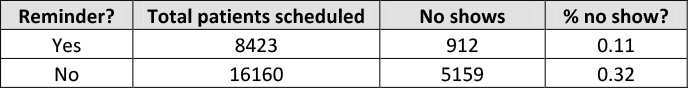
In this case the team knew that reminder calls were successful in reducing no shows, but that they were costly in terms of time required by their staff to make them. They wondered if there were other ways to remind patients without using so much of their scarce employee resources to make them. The team performed some benchmarking on other options available to them which included:
• Reminder calls by staff to all patients
• Automated reminders
• Email reminders
• Text reminders
The next step would be to select the best possible solution that could be implemented by the team.
Select the best alternative method (change concept) for all the CTQs
The team chose to use a Decision matrix, see Table 13.5 below, as there were several factors they wanted to take into consideration, namely cost.
Table 13.5. Decision Matrix for no Shows
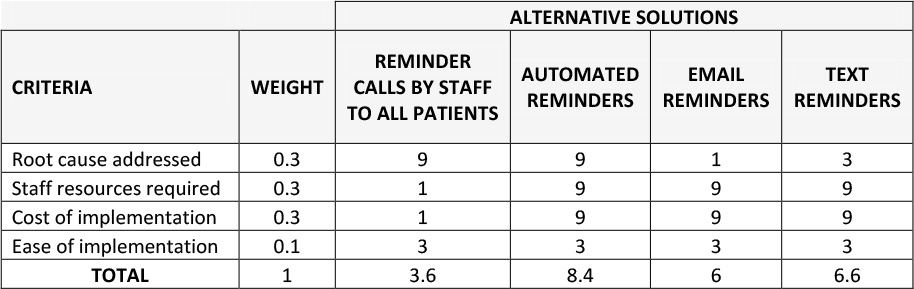
The criteria the team used to select the best solution was:
1. Root cause addressed – the degree to which the solution would address the problematic issue
2. Staff resources needed – the team created this criteria as they wanted to understand the amount of staff resources that would be needed to execute each solution
3. Cost of implementation – the financial cost of implementation for each solution.
4. Ease of implementation – the ability to quickly and successfully implement each solution
Reminder calls by staff would definitely address the root cause, however calling all patients by staff members would take an inordinate amount of time and the labor cost would be substantial, the ease of implementation would be moderate as staff would either need to be reallocated or hired.
Automated reminders would address the root cause as well as calls by staff, but would require no staff. The cost of the service would be an ongoing monthly expense but a minimal one with a return on investment supported by the finance department and the ease of implementation would be quite seamless.
The email reminder and text reminders were seen as alternatives that while fairly cheap and not utilizing staff resources would not be as effective as reminder calls. This was due to the fact that some patients may not check their email frequently enough and some older patients may not be into text messaging.
After assigning weights and completing the matrix, the team found that the automated reminders solution was their best alternative (average weight = 8.4).
Create a flowchart of the new improved process
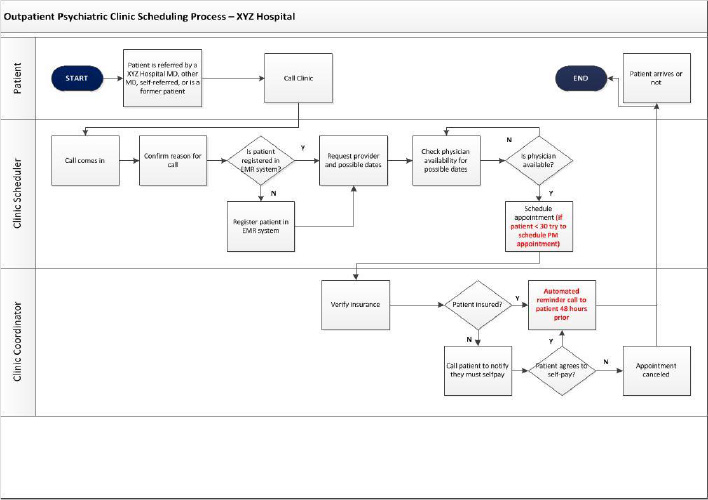
The next step for the team was to create a deployment flowchart of the future state process, see Figure 13.3 below. The flowchart reflects the process changes needed by the solutions selected in the previous section. The two questions below helped the team modify the current state flowchart into the future state flowchart:
What is the revised method (change concept) for each critical X?
For X5: Age of patient and time of appointment. The new method for doing this step in the process would be to have an alert in the electronic medical record system that alerts the scheduler if the patient is less than 30 years of age and if so the scheduler should try to schedule the patient for an appointment in the afternoon, if possible.
For X1: Reminder calls made to patients. The new method for doing this step in the process would be to set up an automated reminder system which would call patients 48 hours prior to their appointment.
Who is responsible for the revised method for each critical X?
For X5: The schedulers will be responsible for X5 (Age of patient and time of appointment).
For X1: The clinic coordinator will take responsibility for X1 (Reminder calls made to patients),.
Figure 13.3. Future State Deployment Flowchart for no Shows
Identify and mitigate the risk elements for the new process
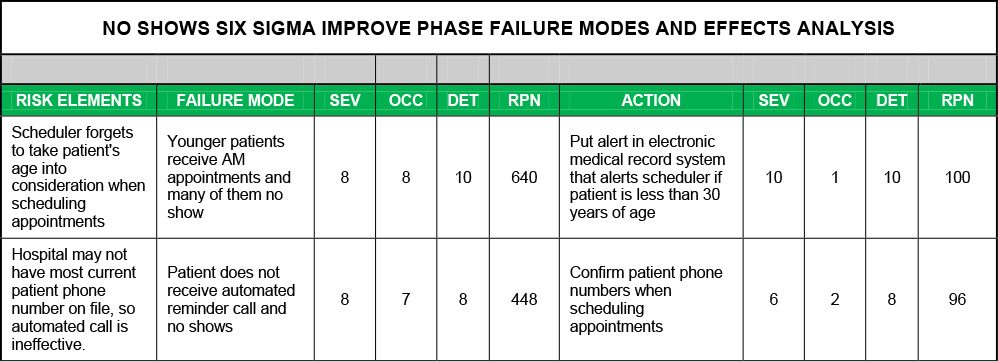
The team then completed a Failure Modes and Effects Analysis, see Table 13.6 below, to identify risk elements and address potential issues that may arise from proposed best practice method.
Table 13.6. Fmea for no Shows Solutions
Run a pilot test of the new process
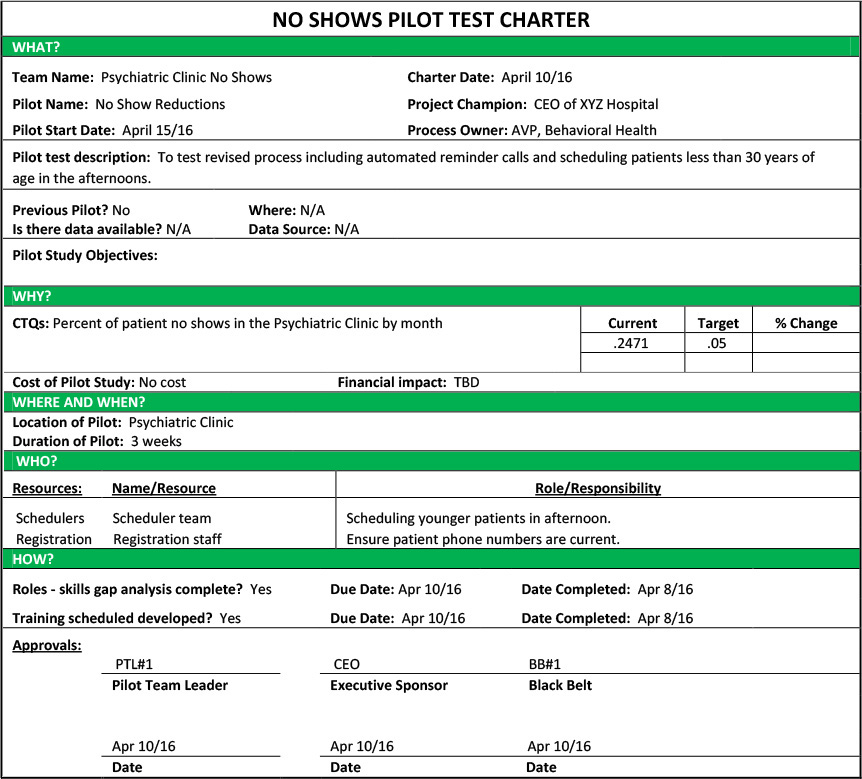
Step #1: Pilot Test Charter
Team members prepare a charter for the pilot study, see figure 13.4 below. The charter answers the “5W1H” questions about the pilot study: Who, What, Where, When, Why and How.
Figure 13.4. No Shows Pilot Test Charter
Step #2: Pilot Test Communication Plan
Team members created a communication plan to inform all stakeholders of the revised best practice process of the impending pilot study.
Step #3: Train Relevant Employees
Team members train all relevant employees in the revised best practice process.
Collect and Analyze the Pilot Test Data
STEP #1: CONDUCT PILOT TEST
Team members and appropriate employees conducted the pilot study for a period of time deemed appropriate by the Black Belt and Master Black Belt.
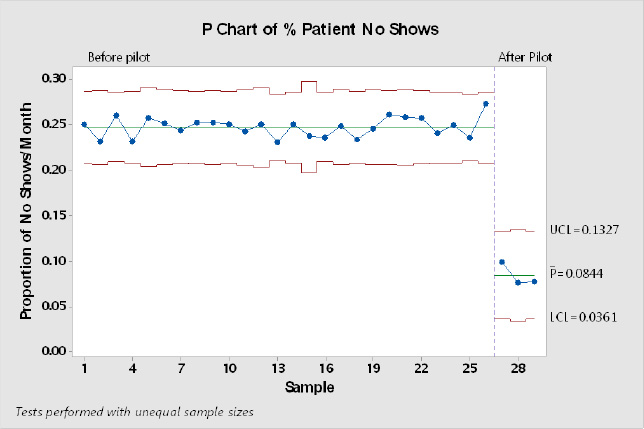
STEP #2: STUDY PILOT TEST RESULTS
Team members evaluated the results of the pilot test in the CTQ(s) by creating the control chart in Figure 13.5 below. As you can see the pilot test was highly successful, as the no show rate dropped from 24.71% in the Measure phase to 8.44% during the pilot test.
Figure 13.5. Pilot Test Control Chart
Tollgate Review - Go / No Go Decision Point
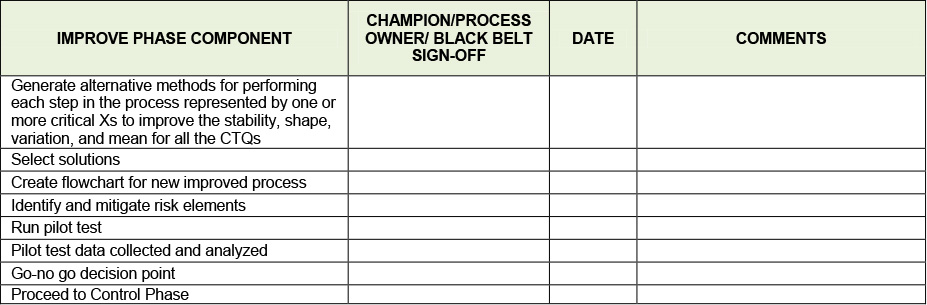
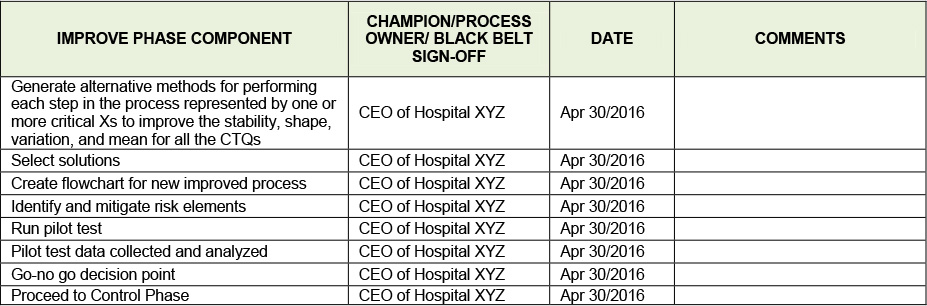
The team conducts the Improve phase tollgate review using the Improve phase checklist seen in Table 13.7 below with the Project Champion (the hospital CEO), the Black Belt, the Process Owner, and the rest of the team on hand. Based on the immense success of the pilot test both the Project Champion and the Process Owner urged the team to move to the Control phase to implement the process full scale and lock it in with documentation and training. Already seeing the potential financial impact, the CFO also reminded the team to quantify the hard benefits of the project in the Control phase.
Table 13.7. Improve Phase Tollgate Review Checklist
Takeaways
• The Improve phase is the fourth of the 5 phases of the DMAIC model
• The steps of the Improve phase are:
• Generating potential solutions for each of your critical Xs to stabilize and improve the shape, variation and mean of each CTQ via various methods such as brainstorming, change concepts, simulation, experimental design and benchmarking to name just a few
• Selecting the optimal solution for each critical X, some solutions are obvious while some require more rigorous methods to help select your solution such as an impact/effort matrix or a decision matrix
• Create a flowchart of the future state process to help stakeholders understand how the new solutions will impact the process and to help educate and train employees on the new process
• Identify and mitigate risk elements for the new process using Failure Modes and Effects Analysis (FMEA)
• Run a pilot test of the new process (if necessary)
• Collect and analyze pilot test data
• Go-No Go Decision on whether to implement the new process full scale
References
Gitlow, H. and Levine, D. (2004), Six Sigma for Green Belts and Champions: Foundations, DMAIC, Tools and Methods, Cases and Certification, Prentice-Hall Publishers (Saddle River, NJ).
Additional Readings
Rasis, D., Gitlow, H. and Popovich, E., ““Paper Organizers International: A Fictitious Six Sigma Green Belt Case Study – Part 1,” Quality Engineering, volume 15, number 1, 2002, pp. 127-145. 2,” Quality Engineering, vol. 15, no. 2, pp. 259-274.
Rasis, D., Gitlow, H. and Popovich, E., ““Paper Organizers International: A Fictitious Six Sigma Green Belt Case Study – Part 2,” Quality Engineering, vol. 15, no. 2, pp. 259-274.