
Views are the single tabs (windows) that you can see inside your Eclipse perspective. For example, when you created your first project, you saw the project in the Project Explorer view. This view has a tree of projects and objects. There are many different types of views, such as form base views, table views, browser views, etc.
There are built-in standard Eclipse views and many others that you installed with the ABAP Development Tools. This chapter covers the most important views for ABAP developers. When I describe the standard views, I describe how they work with ABAP. This does not mean they will act the same way in other programming languages. The behavior of the view depends on the Editor view, which is different for each language supported by Eclipse.
Project Explorer
When Chapter 1 described the creation of the ABAP and ABAP Cloud projects, the Project Explorer view was introduced. This is the base view that will probably stay open in most of your perspectives, as it allows you to navigate through all the objects using the package or object type folders.
Project Explorer with ABAP and ABAP Cloud projects
ABAP Repository Trees

Comparing E80 and Project Explorer
The default Favorite Packages folder contains the $TMP package with the user’s local objects linked to the project. By using the context menu (right-click the Favorite Packages node), you can add other packages to your favorites as well as add other users’ local objects to your favorites. To do so, use the context menu, then choose Add a Package… or Add Local objects of User….
The Add a Package action will open a separate popup window, which you saw when creating the project. It will allow you to search for the packages by name.
Add Local Objects of User will also open a separate popup window, but only to select the user whose local objects you want to see in your favorites.
The Favorite Packages folder is extremely helpful if you work on a larger development, and if you use one or several packages only for the purpose of this project. When you have huge packages in your company that contain development objects for one big module, for example, it’s no longer useful to use the Favorite Packages folder. Too many unconnected objects make it difficult to navigate through.
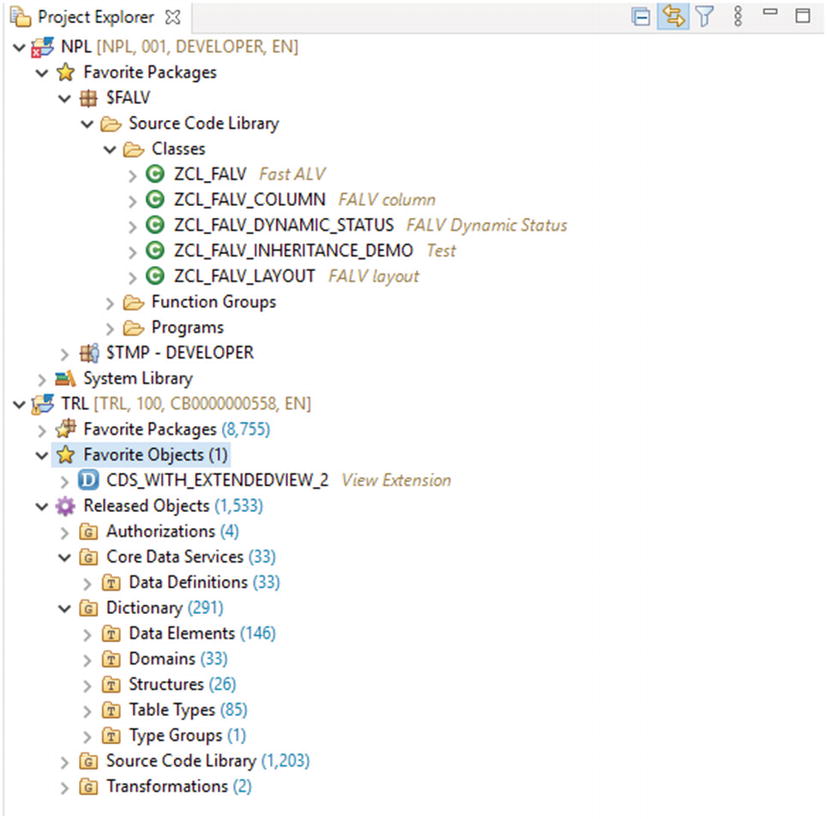
Systems that already work on SAP NetWeaver 7.51 or higher and with the SAP HANA database have a different structure. By default, they have Favorite Packages, Favorite Objects, and Released Objects repositories. Of course, the Favorite Packages node works exactly the same as before.
Favorites Objects works very similarly to Favorite Packages, but it contains only the single repository objects, not the packages. This means you can add function groups, function modules, classes, programs, and other repository objects there, but not packages. You can add objects to the favorites by selecting them from the Project Explorer, either from Favorite Packages, Released Objects, or any other ABAP Repository Tree.
Released Objects contains all released objects in the cloud environment. These objects can be released by SAP or by anyone else from your company.
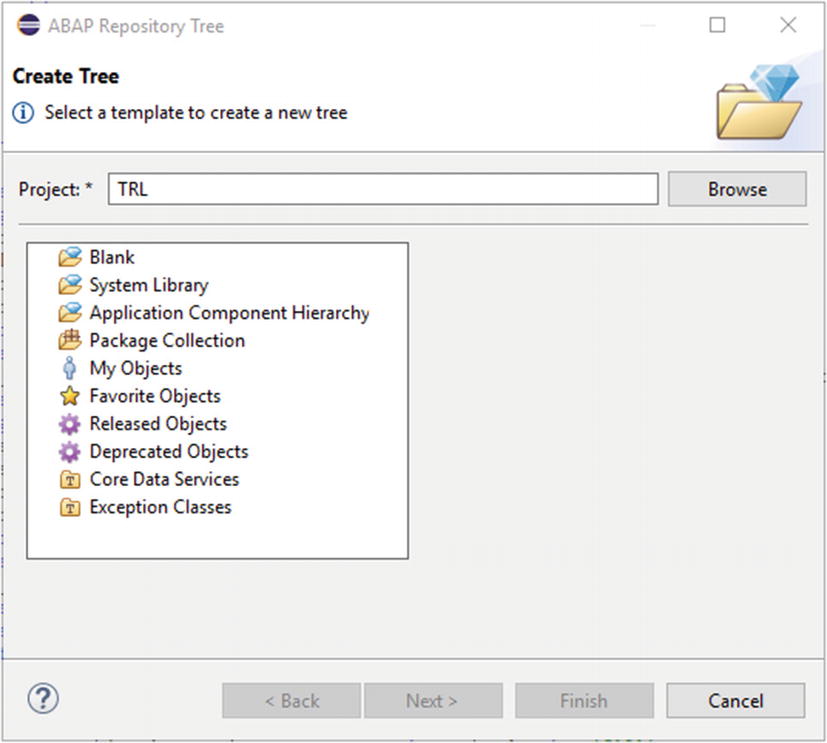
New ABAP Repository Tree
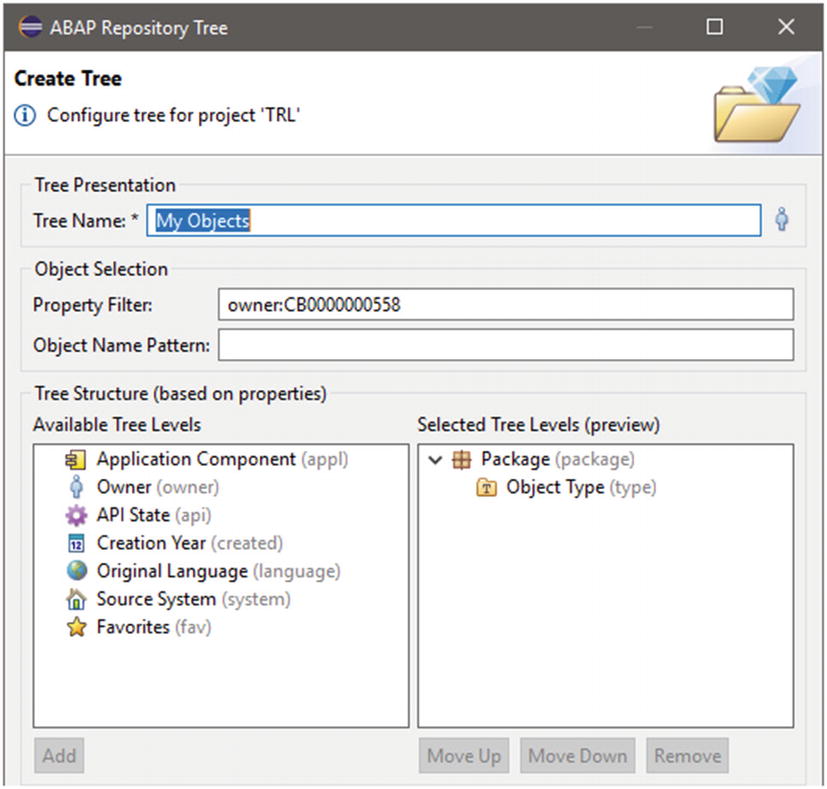
My Object template for the ABAP Repository Tree
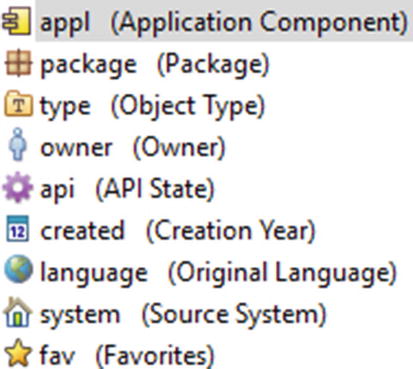
Property filters of the ABAP Repository Tree
The property filter, together with the naming filter, allows you to create useful repositories for your daily work.
Although you may be able to add GUI transactions to the Favorite Objects, or see them if you add one of the standard SAP packages to your favorites, you will not be able to use the GUI transactions in cloud projects, as GUI is not allowed with ABAP Cloud projects.
Context Menu Actions
Project Explorer Context Menu Actions
Action | Usage |
|---|---|
Duplicate | This action can be triggered not only on ABAP repository objects, but also on the projects themselves. It will copy the chosen object under the new name. |
Open With | Expand this action to see the possibilities to open an object in SAP GUI (for on-premise systems), Data Preview, Activation Graph, Dictionary Log, Active Annotations, Annotations Propagation, or Dependency Analyzer views. |
Open in Project | Choose in which of the ABAP projects the object should be opened. |
Open ABAP Type Hierarchy | Open the selected object in ABAP Type Hierarchy view. |
Coverage As | When you expand this action and you see ABAP Unit Tests, this means you can run a unit test for the selected objects and open the ABAP Unit & ABAP Coverage views at the same time. |
Run As | You will use this action to run the object in the SAP GUI (ABAP Application), call ABAP Test Cockpit with default or selected check variant, and run ABAP Unit Test or ABAP Application in Console (for cloud development). |
Get Where-Used List | With this function, a use of the selected object will be shown in the Search view. |
Share Link | You can share the object using HTTP Link or ADT Link. HTTP Link will display the object in any browser for display only purposes, and ADT Link will be opened by Eclipse. |
Profile As | Activate the profiling of the object using one of the three methods—ABAP Application for GUI or Console and as ABAP Unit. |
Change Package Assignment | A very useful function to switch the package of the objects. |
Change API State | Change the API state for example to released. |
Compare With | You can compare the selected object with the previous revisions (versions) or between systems. The compared source code will be displayed in a separate view. |
Export | Export the ABAP Doc documentation into HTML files. It is very similar to JAVA Doc. Just run the action, expand the ABAP folder, and select ABAP Doc. |
Expand Folder By | Available only on the releases in which you can create your own ABAP Repository Trees. Allows you to switch the type of expansion from current one to owner, object type, API state, and some more. |
Configure Tree | Available only on the releases in which you can create your own ABAP Repository Trees. Gives you the possibility to customize the current tree. |
SQL Trace | You can activate or deactivate SQL Trace from here. |
SQL Console | You can launch SQL Console view for the current project, which allows you to test SQL statements outside of ABAP objects. |
Properties | Run the project specific configuration. |
Toolbar and View Menu
If you thought we were done covering Project Explorer, then you were wrong. There are still a few important functionalities that you can run from the toolbar and the View menu.
The toolbar can always be found close to the view tab. If there is enough space, it is visible on the right side of the view tab name; in other cases, it can be found below the tab. This behavior is the same for any view.

Project Explorer toolbar and View menu
In the Project Explorer view, the toolbar consists of Collapse All, Link with Editor, Filter, View menu, and the Minimize and Maximize buttons.
Collapse All is helpful when you have opened several projects during the day and you want to collapse every node. When this is used, all tree nodes will be collapsed.
The Link with Editor function is quite common in Eclipse views. The behavior can be a bit different between the views, but basically the content of the view will change to show information linked to the active editor. In the Project Explorer, the aim of the linking is to navigate through the whole structure of the project to the currently opened object.
It may not be clear to you yet that you can open objects in several ways, not only from the Project Explorer. That is why, when you open the object using other ways, the Project Explorer can show you the place where the object is placed. Depending on whether I am working from home using VPN or at office, I switch this option on or off, as it can be very frustrating on a slow network connection.
The filter is not useful in ABAP projects, but it can be with other ones. Here you can set up what kind of content you want to see in your project.
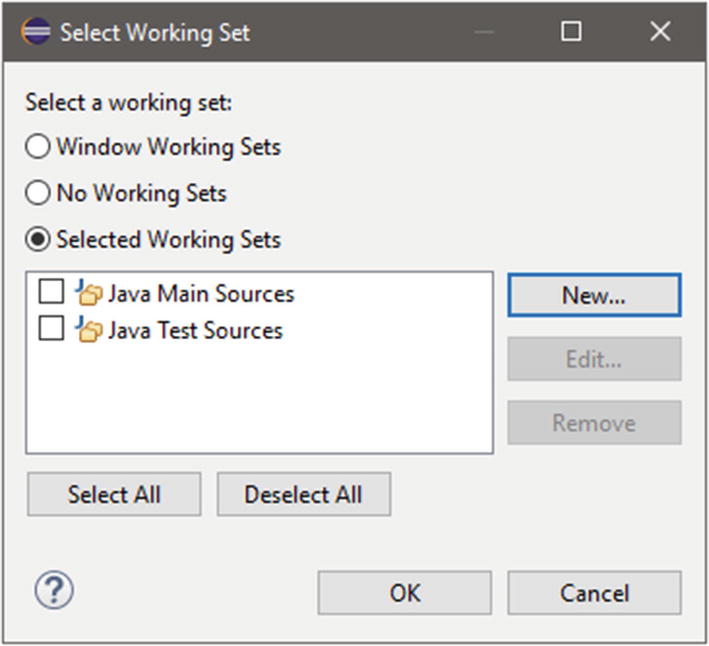
Selecting working sets
There are no built-in ABAP working sets, so you need to create your own. To do so, just click the New… button and select Resource as the working set type. In the next step you will be able to give it a name and select which projects should be included in it.
In my example, I created two working sets. On-premise, which contains the project NPL, and Cloud, which contains TRL. You can create different working sets, and the split and grouping depends only on you. In order to display your working sets, you need to select the checkbox close to their names from the working sets list.
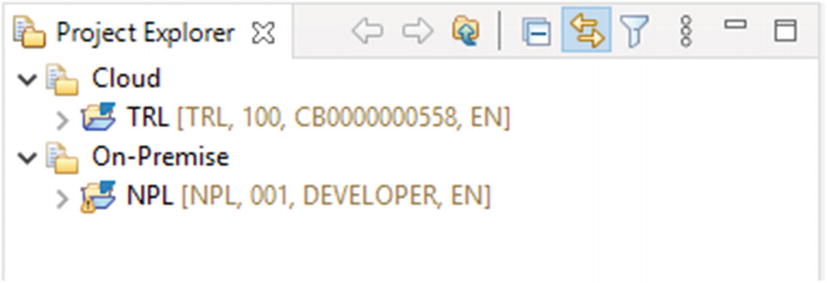
Project Explorer with working sets
Outline
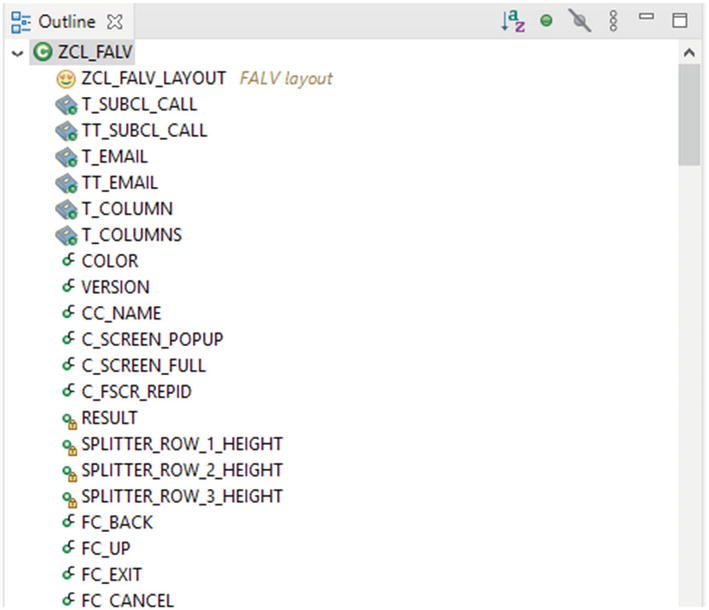
Outline view
This may be strange, but you should know it from the start: you will not see the components of the includes here if your editor currently handles the main object (program). But of course you will see the list of the includes and you will be able to navigate to them. You will see types, variables, local classes, events, friends, forms, and methods, but only for the current object. This might seem a disadvantage, but in most cases, it is not. After more than 20 years of availability of the object orientation in ABAP, I hope that you are familiar with it and will miss only inherited members on this view, in comparison to SE80.
When you select any of the object members from the Outline view, the code editor will navigate to the position of the selected member.
You can choose to sort the displayed members. By default they are sorted by type, visibility, and placement in the code, but you can use the Sort button on the toolbar to sort them by type and name only.
You can also show only public members of the object using the Hide Non-Public Members button.
By default, this view is linked to the editor, which means when you switch the editor tab to another object, it will be refreshed and members of the selected object will be displayed. You can unlink it from the View menu.
Problems
This view is also one of the basic. It is helpful during programming, as all messages will be visible here. You will see syntax errors and warnings here, as well as error messages found when activating an object (Figure 2-10).

Problems view
By default, this view shows all the errors of the objects opened in the workspace. You can customize it by clicking the Filters button on the view toolbar or selecting it from the View menu. You can customize the filters, as shown in Figure 2-11, by choosing the scope of the view, setting the severity of the messages, and setting the types of the issues. This can be quite useful when you work with several systems and are mainly in maintenance mode, or when you use Eclipse to create Java or another type of application and you keep all of them in one workspace.
Errors/warnings on project
Errors/warnings on selection
Warnings on selection
All errors on workspace

Filters of Problems view
You can switch between this configuration using the Show action of the View menu, where all configurations will be listed. You can also create your own configurations using the New button on the Filters area.
One last thing you can do, besides sorting and grouping, is create an additional Problems view. You can do this by using the View menu and choosing the New Problems View action. You will be able to give the view a name and set up its configuration, but this additional view will only be available in the current perspective.
Properties
Usually , we do not make many changes to the attributes of ABAP objects, but if you need to change the object description or some specific object type settings, you need to use the Properties view.
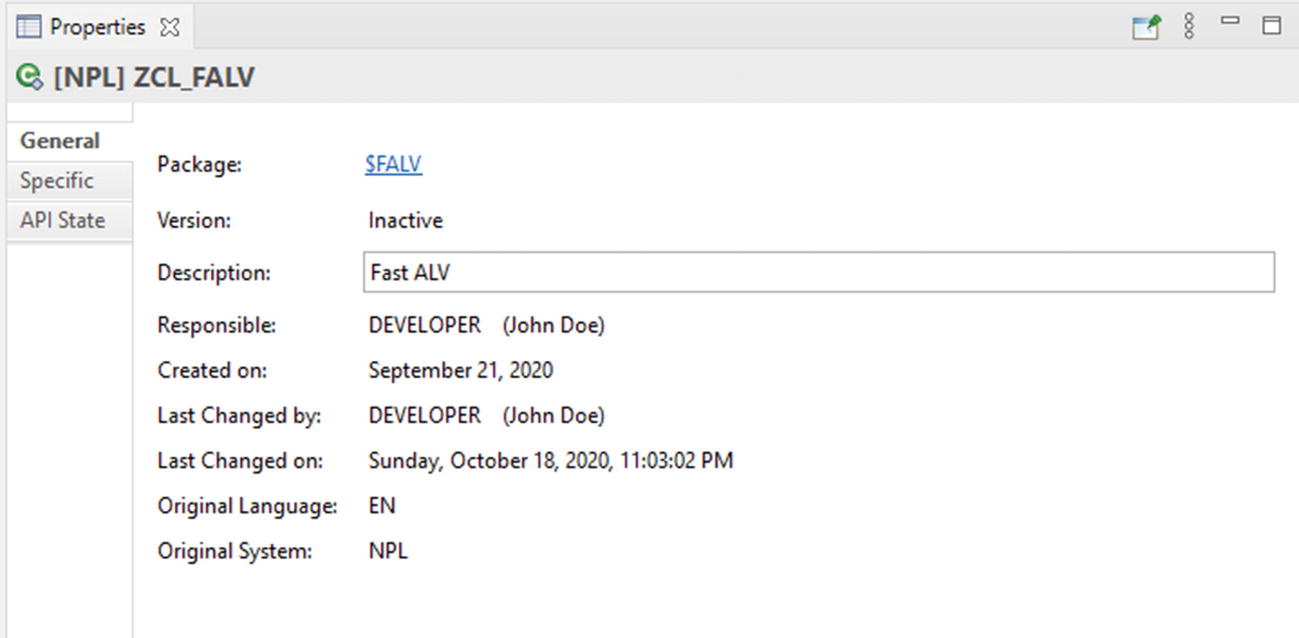
General tab of properties for the ABAP class
The Specific tab shows different attributes for different object types. For example, in the case of classes, it will show ABAP Language Version, Fix Point Arithmetic, Shared Memory Enablement, Status, and Message Class. For function modules, you will find Processing Type (Normal, RFC, Update) and Release State here. In the case of programs, it will show the ABAP Language Version, Fix Point Arithmetic, Start Using Variant, Status, Authorization Group, Logical Database, and Selection Screen Number. Unfortunately, the visibility of the attributes depends on the NetWeaver stack.
The API State will be visible in classes, CDS views, and function modules, but only if your system is using a HANA database.
It’s the same with the Chart tab: if you’re using systems with a HANA database, you can see the graphical representation of the object type differentiation. This tab will be visible if you select a package or any of its subfolders in the Project Explorer.
Templates
When you are reusing parts of your code, but naming objects and variables differently, and you want to speed up the code-writing process, you can use templates. They allow you to prepare code snippets and containers for quick refactoring.
SAP prepared some default templates, but you are free to create some on your own. I bet you will create at least one—a program or class signature that your company or client wants to have at the beginning of each object.
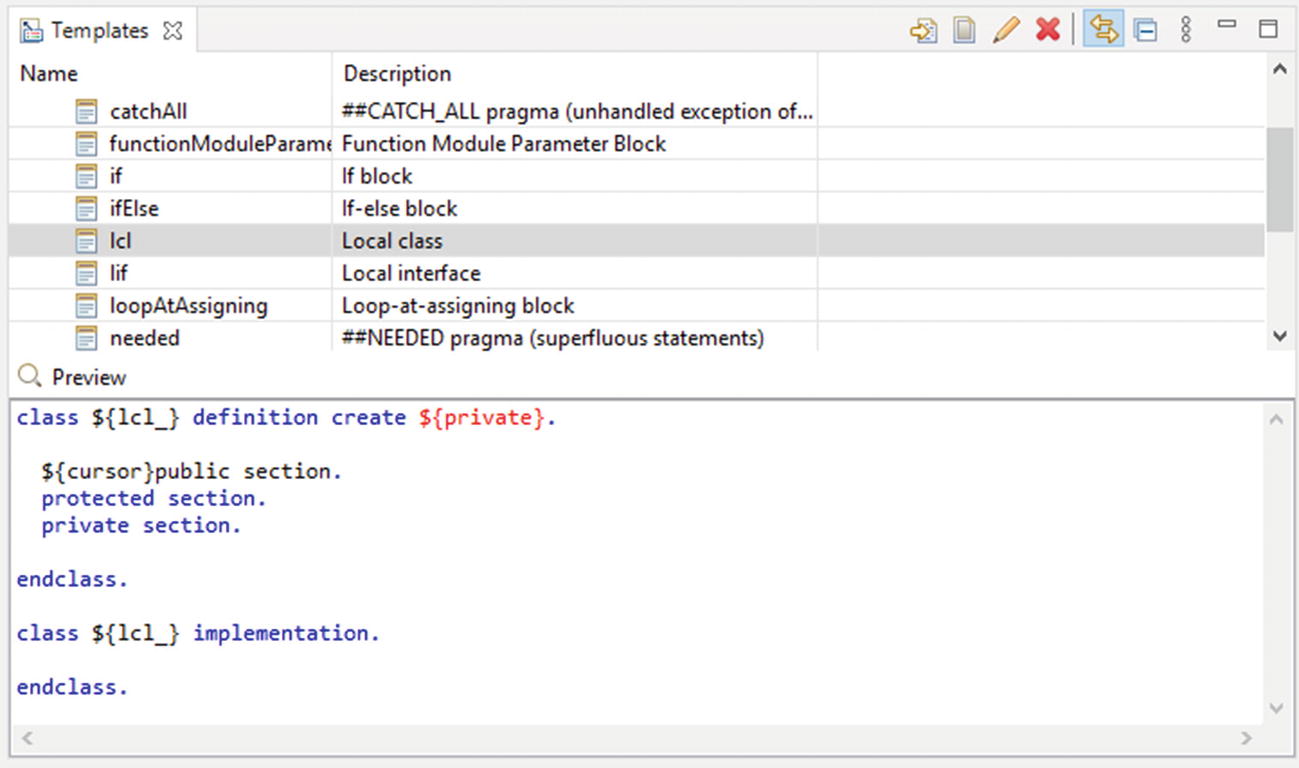
Templates view
Creating new templates is quite simple; you need to click the Create New Template button on the view toolbar, then fill out the name, description, and pattern. The pattern can be simple, static text, or you can use variables that enter some default values for you or allow you to rename them after inserting the template into your object.
Sample Template for Object Signature

Template after inserting it into the code
Possible Eclipse Variables in Templates
Variable | Description |
|---|---|
${date} | Enter the date. When used in short form ${date} it will put it in default system locale, but you can force the format using any of the java.text.SimpleDateFormat. For example, ${iso:date('yyyy-MM-dd HH:mm:ss Z')} will insert the date in the format 2020-10-19 23:12:15 +0200, ${d:date('EEEE dd MM yyyy', 'en_GB')} will insert Monday 19 10 2020 |
${time} | Insert the current time. |
${year} | Insert the current year. |
${user} | Insert the current user name (sy-uname). |
${enclosing_object} | Insert the current object name, for example class or program name. |
${enclosing_package} | Insert the package of the current object. |
${system_id} | Insert the system ID (sy-sysid). |
${word_selection} | You can also use a selected piece of code as a part of your template. To do so, use ${word_selection} in the template, and before inserting, select the code that you want to include and insert the template. If you want to have some default text inserted if the selection is not done, use the following syntax ${currentWord:word_selection('"Default text"')} |
${line_selection} | It works exactly the same as ${word_selection}, but for multiple lines. If you want to use this with a default text value, you need to use the following syntax ${currentLine:line_selection('"Default text"')} |
${cursor} | Specify where the cursor will be placed after you leave edit mode of the inserted template. |
$$ | Insert a $ sign . |
Bookmarks
When I was describing the Project Explorer, I mentioned a context menu function called Add Bookmark, which you could use to store the object for later use. They are stored in Bookmarks views, which can be used as a kind of favorites list.
You can add each object from the Project Explorer as a bookmark. They will be added with the name that matches the resource name. When you right-click the bookmark entry and choose Properties, you will be able to change the description. When you double-click the bookmark entry, the object it points to will be opened in the associated editor.

Bookmarks view with a few items
As it was with the Problems view, you can set up filters to change the scope of the view, or you can create several Bookmarks views, each with a different configuration.
This view is handy with small numbers of entries. However, because there is no search functionality and no way to group entries, it is very difficult to handle many entries in this view.
Search
Using the where-used list is very common task in a developer’s life. There are many use cases for it and it is nice to have a good tool for it. You can call it from the Project Explorer view or from the editor by using the Get Where-used List function.
As a result, you receive a tree with all occurrences of the selected object or its part (field of table, attribute of class, etc.). The Tree view is a nice solution here, as it shows the objects in which at least one occurrence of the searched object was found. You can expand the object to see the next level, which can be a method, a function module, an include, or the place of occurrence.

Where-used list of the ZCL_FALV class
When you double-click the line with the occurrence, the editor will open the place of occurrence. You can also navigate through the results using the up and down arrow buttons from the view toolbar, or using the Ctrl+, and Ctrl-. keyboard shortcuts. Using them will switch to the next/previous result and directly open the result in the editor.
If you want to scroll down quickly through all of the results, you can use the Expand All button. It will call the SAP backend to get details for all results and will expand the tree to the last level, giving you information about the total number of occurrences.
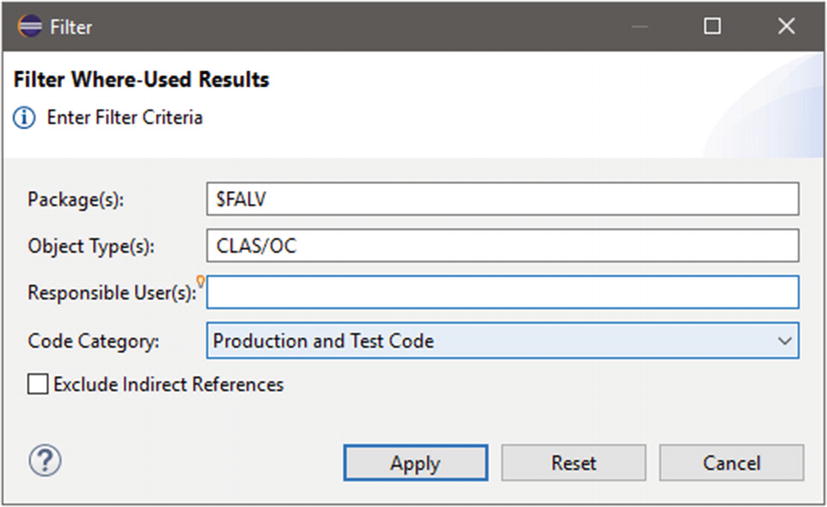
Search view filter settings
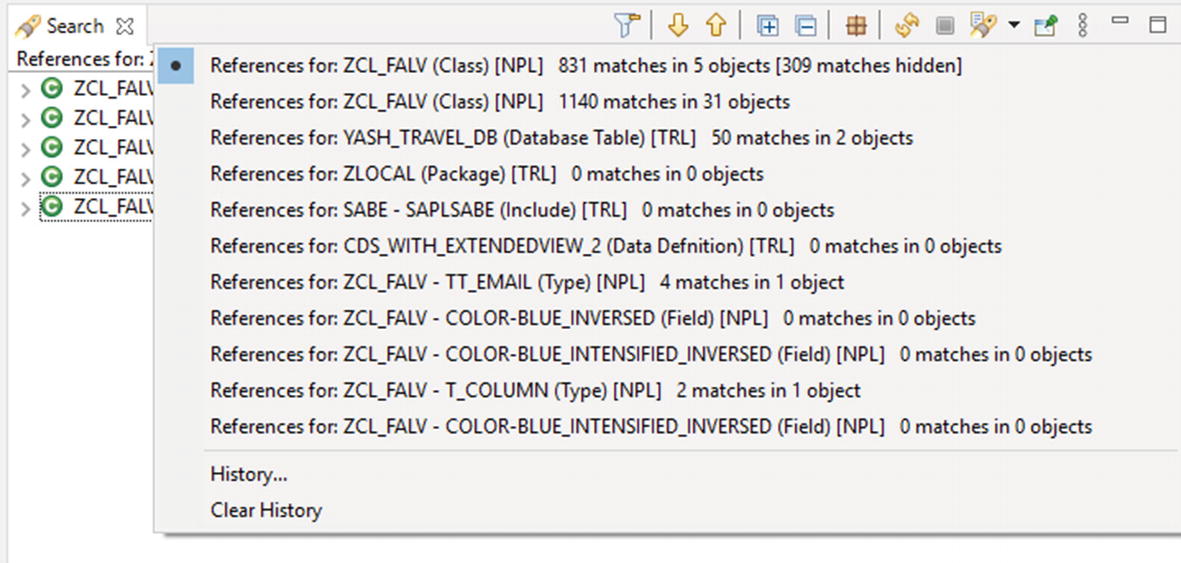
Search history
By using the Pin button, you can ensure that the current results stay in the current view when you use the where-used functionality again. The results for the new search will be opened in a separate view.
History
Say you want to check the last changes in the object, to see if part of the code was removed. In SE80, you used Version Management for that purpose, but in Eclipse you use the History view. Like the Outline view, it can be linked to the editor, so whenever you change an active editor tab, the view will be updated with the history of the active object. As with the Search view, it allows you to pin it and to see the previously displayed results.

History view for the ZJSON2ABAPTYPE program

Comparing two revisions
Debug
This view is very small, but it’s always used during debugging. It will always show up when an ABAP breakpoint is reached. If you have more than one debugging session open, all of them will appear here.
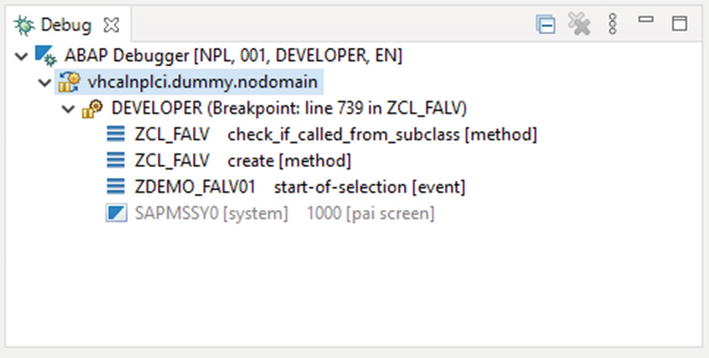
Debug view with a call stack
Terminate: Stop current debugger session and close application
Disconnect: Stop current debugger session, but continue with application
Terminate and Remove: Stop debugger, close application, and remove the session from the Debug view list
Terminate/Disconnect All: Stop all active debugger sessions and close all applications
I am not sure why the terminated debugger sessions are still kept in the view, but if you want to get rid of them, simply choose the Remove All Terminated action from the context menu.
Breakpoints
When you set up a breakpoint in the editor using the vertical ruler (not by using the BREAK-POINT statement in ABAP), all the breakpoints will be collected into the Breakpoints view. They will be visible there, no matter if you are logged onto the system or not.
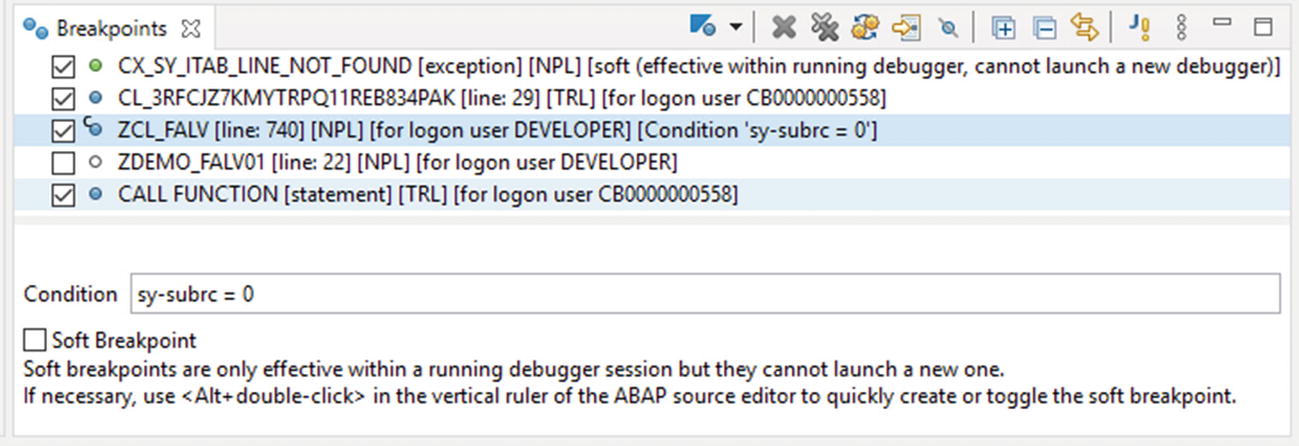
Breakpoints view with default settings and four breakpoint types
You can also create statement and exception breakpoints. To do so, click the Add ABAP Breakpoint button and choose one of the two breakpoint types. If you have a statement breakpoint, you will need to select one of the existing ABAP statements. Whenever this statement is called, the debugger will stop in this place. It works similarly to the exception breakpoints. You choose where the debugger should stop and whenever it will be raised, it will stop.
Possibilities for Breakpoint Conditions
Type | Usage |
|---|---|
Variables | You can use any variable, field symbol, structure or structure component, internal table or static class attributes that are available in the current scope of code. For example: • variable = 5 • <field-symbol> CP 'AB*' • structure-component > 15 • structure-string(1) = 'A' • object->attribute IS NOT INITIAL • itab[9]-component CS 'PP' • {C:class_name}-static_attr = 'X' |
Literals | There are three literals you can use: • '' for character literals • `` for string literals • Numeric literals with or without the ‘-‘ sign |
Built-in functions | So far only four functions are available for conditions in breakpoints: • LINES( itab ): Returns the number of table lines • STRLEN( string ): Returns the string length • XSTRLEN( xstring ): Returns the xstring length • INEXACT_DF( ): Returns ‘X’ when the result of an operation (for example, COMPUTE or MOVE) is inexact due to rounding |
Operators | Possible types of operators are: • Comparison: =, <, >, <=, >=, <> or EQ, LT, GT, LE, GE, NE • Logical: NOT, AND, OR and brackets () to combine several conditions • String analysis: CO, CN, CA, NA, CS, NS, CP, NP • Binary: IS [NOT] INITIAL, IS [NOT] BOUND, IS [NOT] ASSIGNED |
Sample Breakpoint Condition
Two last possibilities of the Breakpoints view are to skip all breakpoints and to group them. Skipping All Breakpoints is nice when you want to continue running your code until the end, but you don’t want to remove the breakpoints. You just activate this by using the button on the toolbar. Until you deactivate it, the debugger will not care about the set breakpoints.
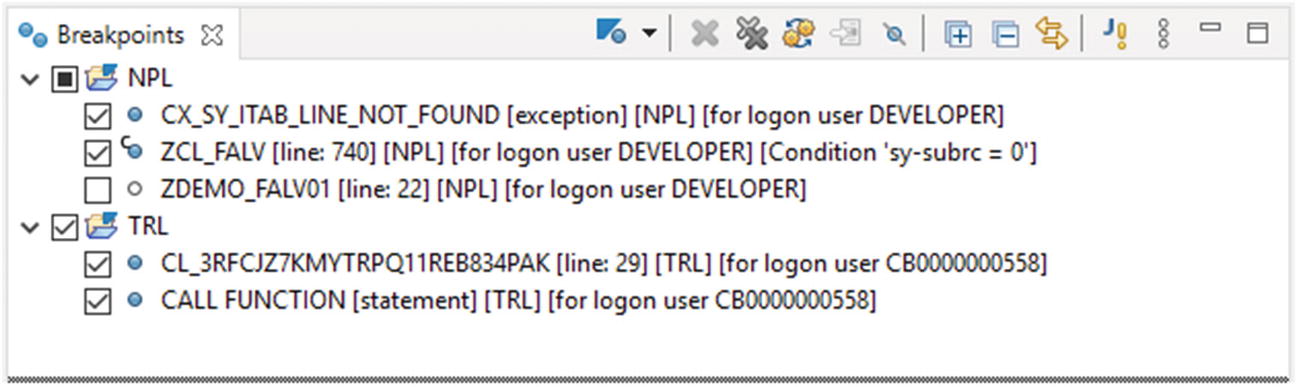
Breakpoints with grouping by project
Variables
This view is available during debugging. You can watch and change variables values from here. When it starts, you will have the following entries: SY-SUBRC, Locals and/or Globals nodes, ME (if the debugger stopped in a class object), and the <Enter Variable> field, which allows you to enter variable names manually.
Locals will show you the local variables in the method, form, and function module. Globals will show the global variables for the program or function group. ME will show you the whole object and all of its attributes.
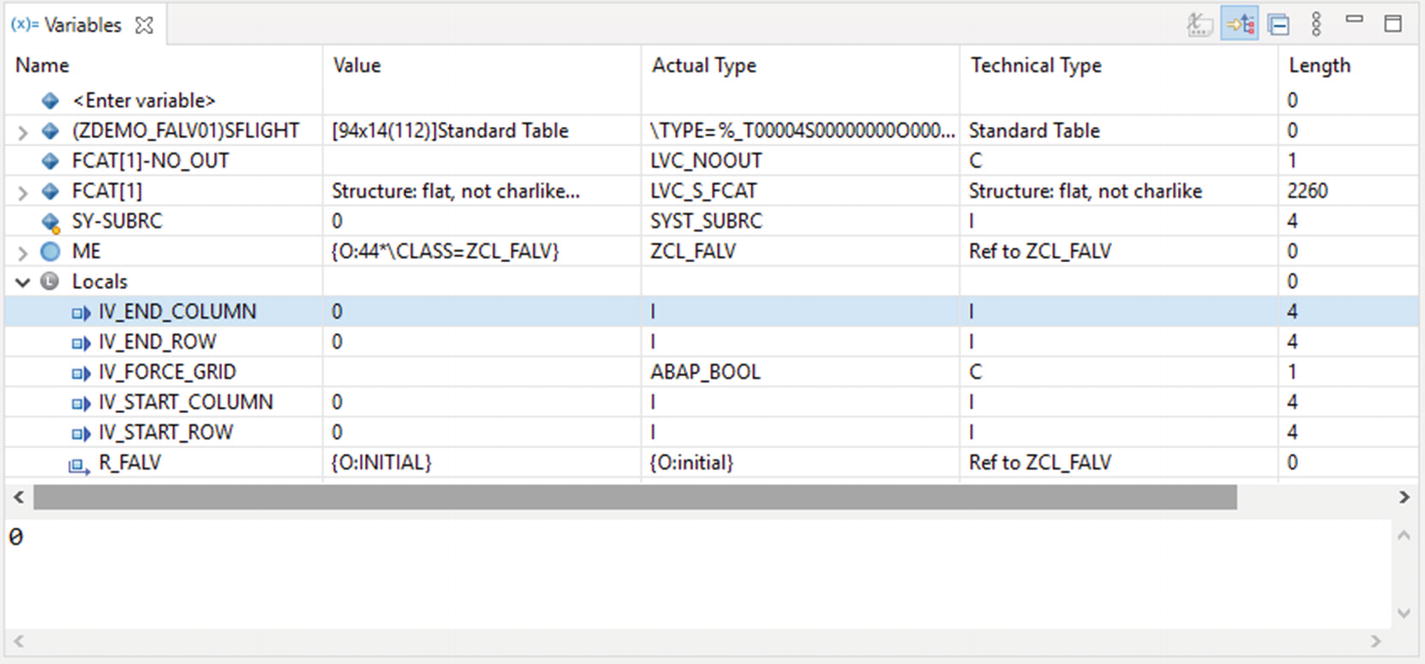
Variables view on a class object with a few variables
When you have the proper authorizations, during debugging you should be able change the variable value. To do so, just click the Value field next to the variable name. This will highlight the value and you will be able to put in your desired value. Confirm the change by pressing the Enter button.
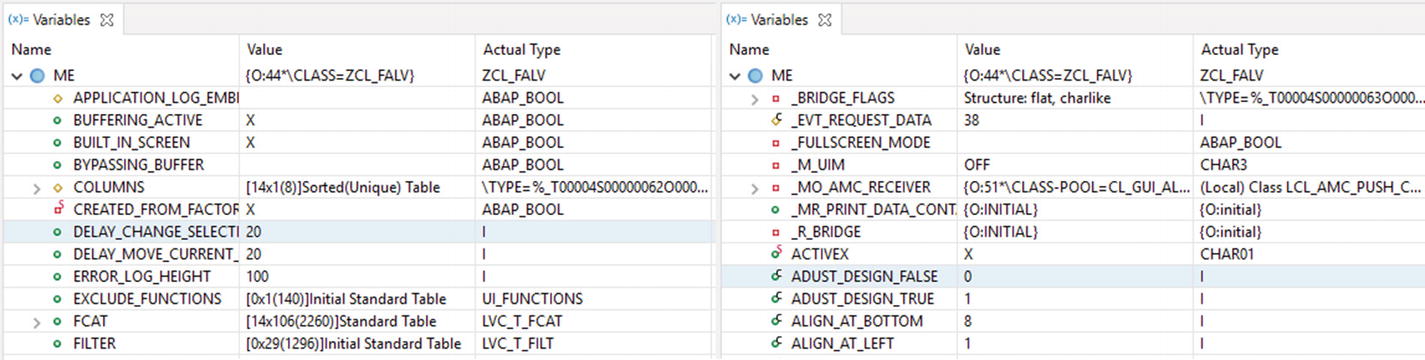
Variables with (right side) and without (left side) additional settings
ABAP Exception (Debugger)
Exception debugging can be useful to get an idea where an exception was raised. If you’re catching a few exceptions at a time and want to see the type and text without going into exception object details, this is the way to go.

ABAP Exception view while in a catch statement
When you use the context menu of the object, you can jump into the raise location or you can add the object to the Variables view from here.
ABAP Internal Table (Debugger)
One of the most common things you’ll do while debugging is check the internal table entries after a SELECT statement or after its manipulation some other way. The ABAP Internal Table view comes in handy here.
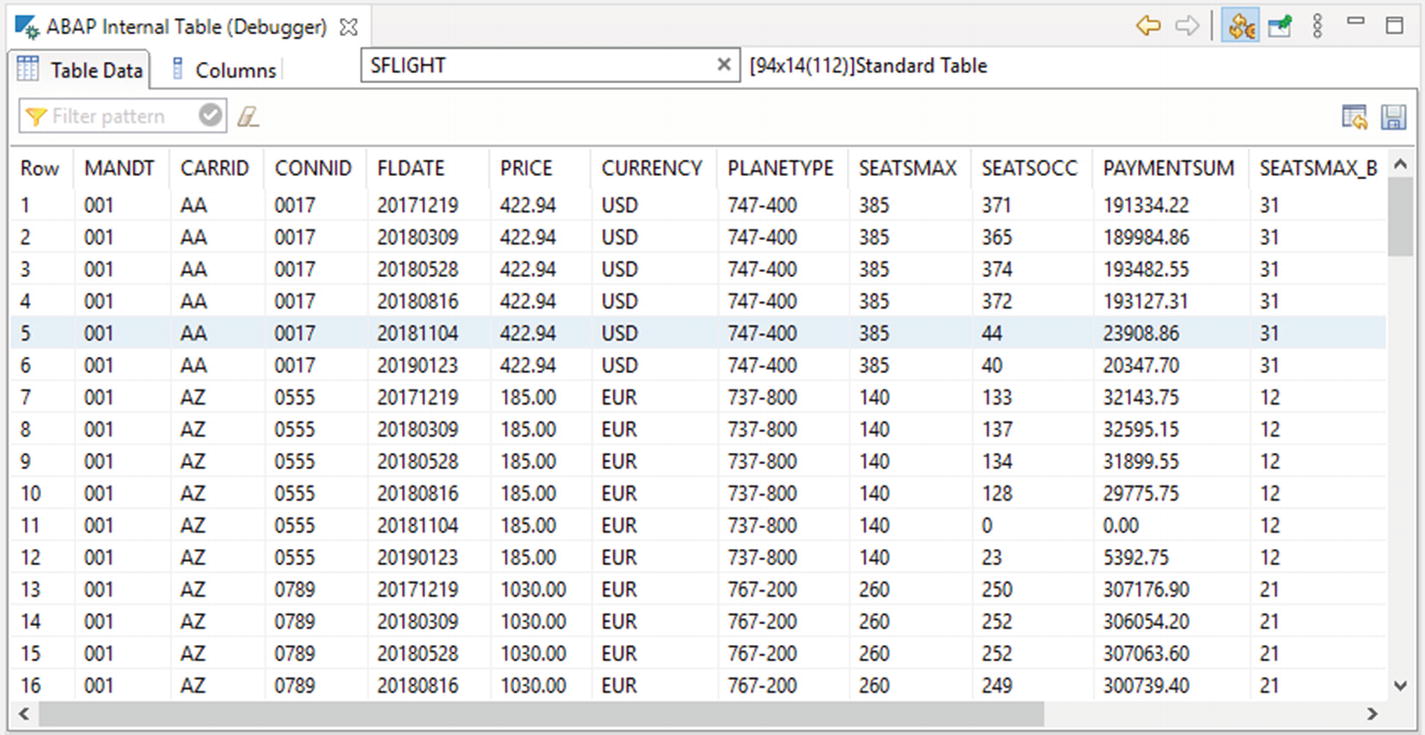
ABAP Internal Table view with SFLIGHT internal table entries
From this view, you can also delete or add rows, you can sort the entries and filter them (but only on certain NetWeaver releases), and you can export the table into TXT, CSV, or XLS files. All these functions are available from the View menu and/or from context menu for the row entry.
There are two buttons that can be very useful. The first one is the Pin button, which will help you see the table entries all the time. The second one is the Automatic Refresh button, which may help if you have a slow connection.
Eclipse debugger refreshes this view each step, so this can be very expensive, especially if you have a slow connection. That is why, if you don’t need to see the updated values during each step, you can disable the automatic refresh and you will see a huge difference in the performance of the debugger.
Transport Organizer
There is no work in ABAP without transport requests and tasks. They have been with us since the beginning and will probably stay with us until the end. The Transport Organizer view helps you check and manage the transport requests you are involved with.
The view shows a list of all ABAP projects. They will not show an entry until you expand the project folder on it. Once you do this, you will see all the transport requests that you can find with an SE01 transaction. The only difference is that you will not be able to see all the released transports requests on demand there, but the one that was released during last two weeks will be visible in a separate subfolder. You can see all of this in Figure 2-28.

Transport Organizer view with two projects
Of course, you can do much more with this view. For example, you can create new transport requests, change the owner and the type of the request, add a task for any user, and release the task and request. Not all of these functions are available in each system, availability depends on the backend as usual.
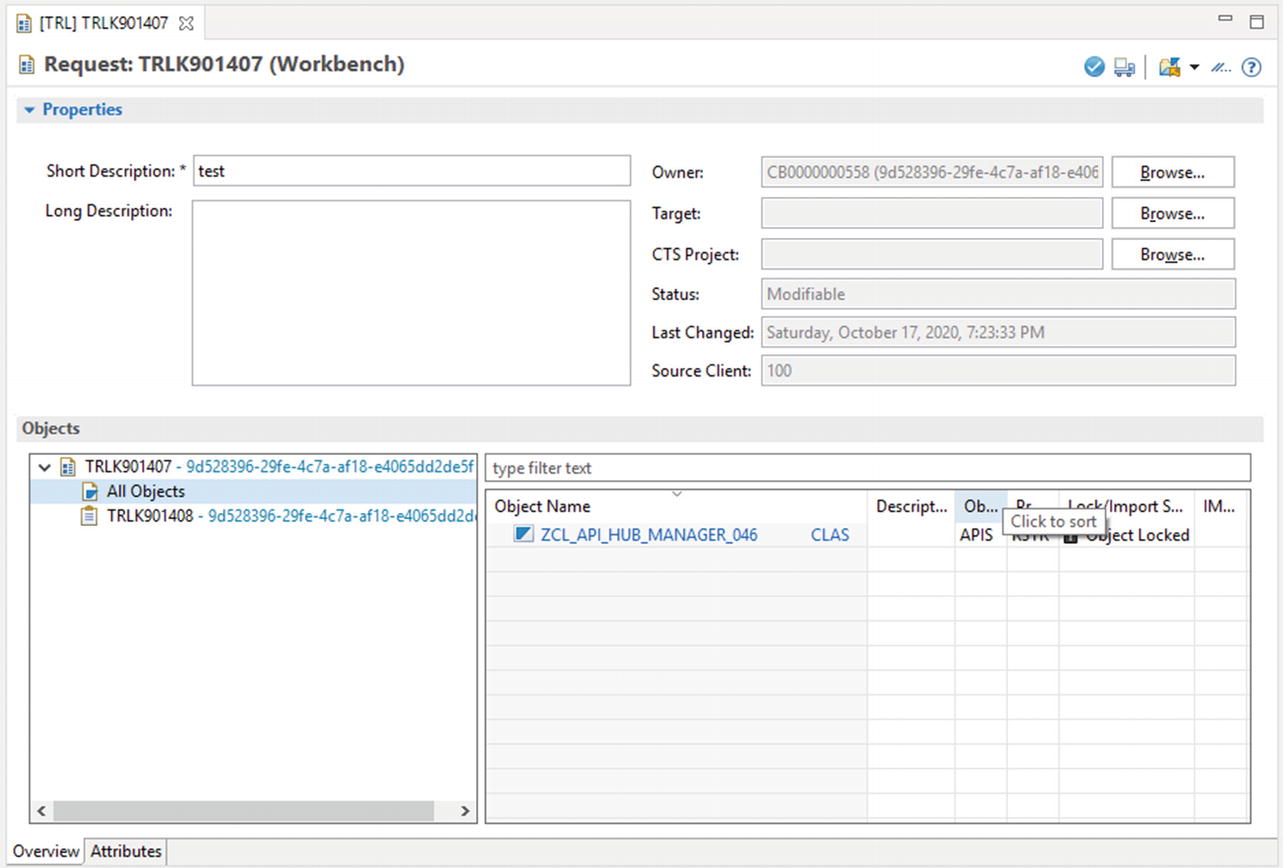
Transport Request details in Eclipse
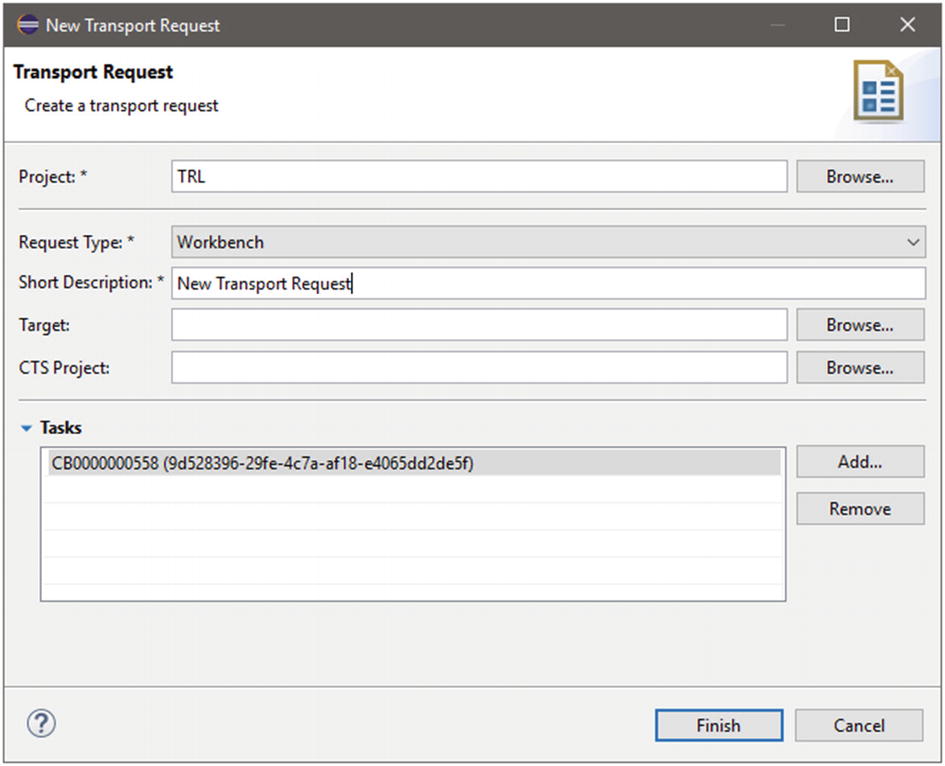
New transport request window
ABAP Language Help
Whether you are a newbie or an experienced ABAP developer, you will need to use the ABAP syntax help from time to time, either to learn how to use the syntax or to remind yourself about any additions you can use.
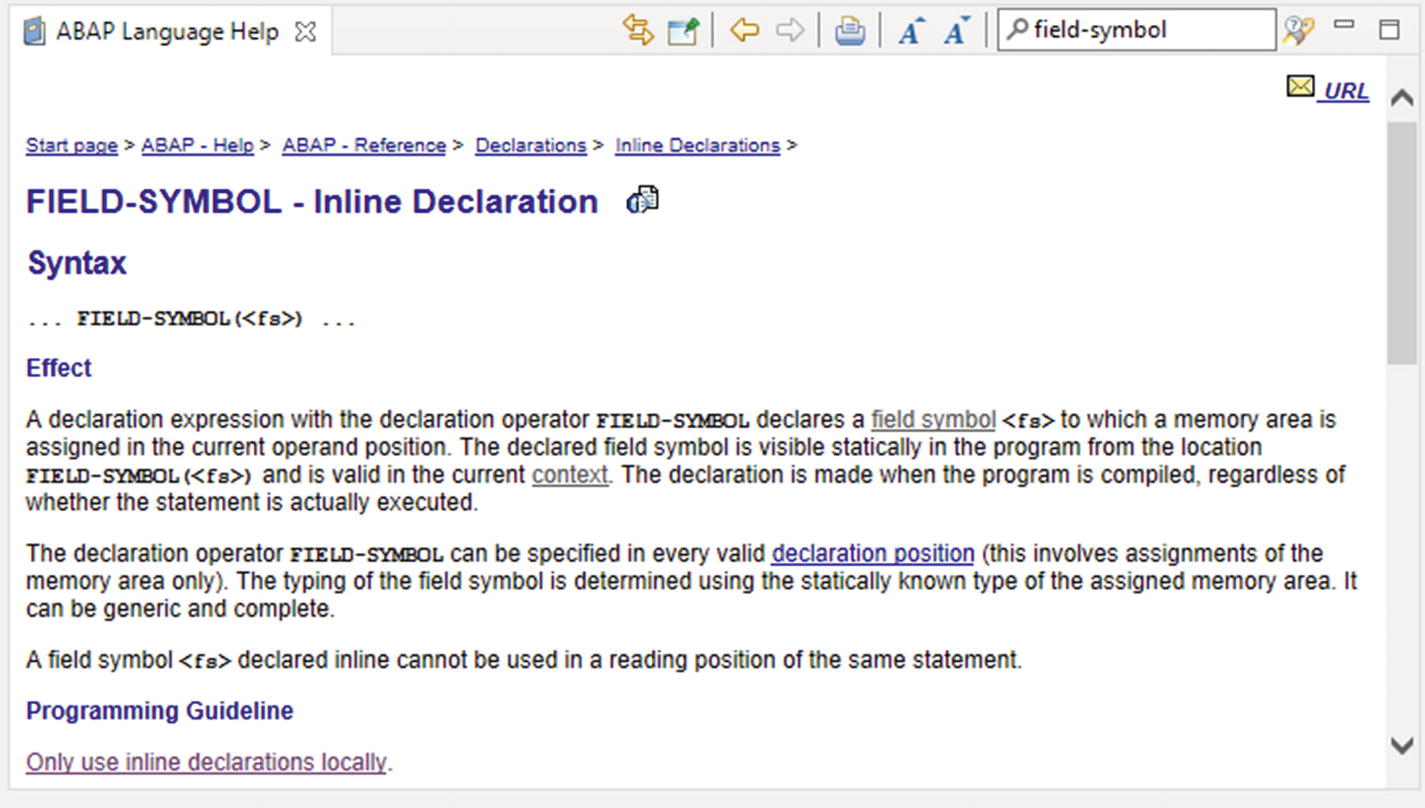
ABAP Language Help view with Field-Symbol help for inline declarations
One of the nice functions of this vie is that you can navigate through it like a web page, using the breadcrumbs and hyperlinks in the text.
Console
With ABAP development, you probably will use the Console view only when developing the cloud systems, or when developing the class if you want to test the output in addition to the unit tests. It is also useful during Eclipse plugin development, but this process is described in the next chapters.
Sample Console Application in ABAP Using IF_OO_ADT_CLASSRUN
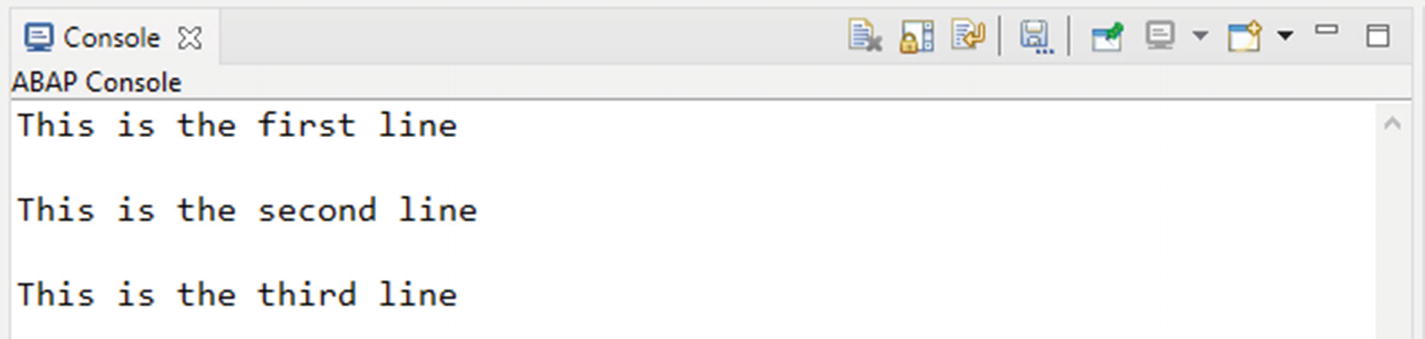
Console view output
ABAP Element Info
This is one of my favorite views, although you can get the same information directly from the editor using the F2 key on any ABAP object. What makes me like it so much? Well, I like to get rid of unnecessary steps when coding and debugging and I also like to have all the information available directly. This view enables me to have direct information about selected objects.
Of course I use it with the Link with Editor function enabled; that is why whenever I put the cursor on a function module, method, variable, constant, table, structure, data element, or any other ABAP object, I see the details and description of that object.

ABAP Element Info with the SAPGUI_SET_FUNCTIONCODE function module

ABAP Element Info with SFLIGHT table
In addition to the displayed information, you can navigate through the elements of the view to get more detailed information about that part of the object.
ABAP Type Hierarchy
When you are wondering what the whole hierarchy of a class is, there is no better view than ABAP Type Hierarchy. You can learn from this view the clear information about the classes that are super-classes to yours, or you can see where your class is inherited from.
Type hierarchy
Supertype hierarchy
Subtype hierarchy
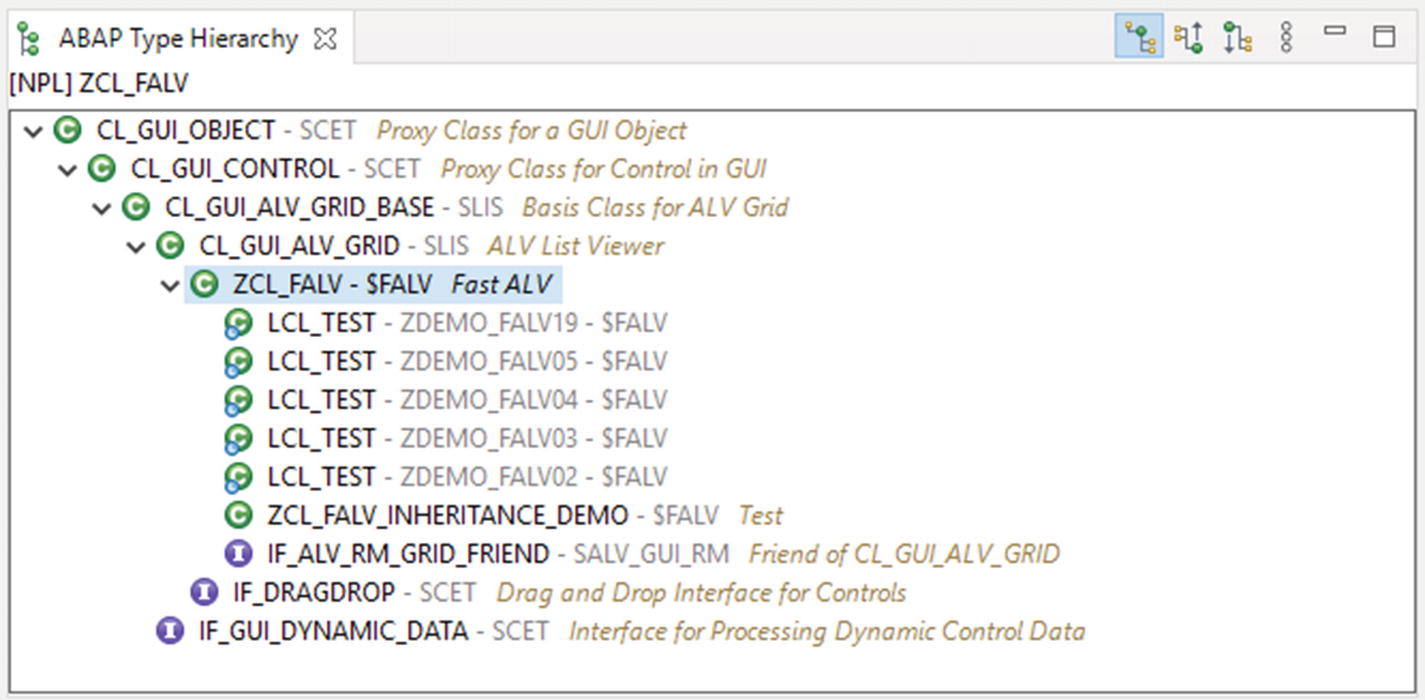
ABAP Type Hierarchy with type hierarchy for class ZCL_FALV
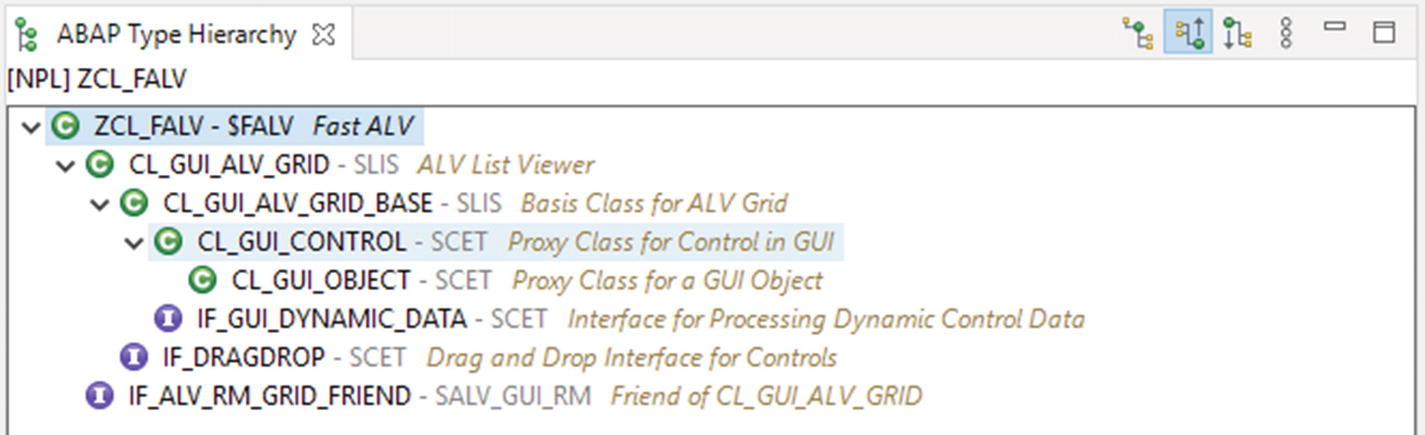
ABAP Type Hierarchy with supertype hierarchy of class ZCL_FALV

ABAP Type Hierarchy with subtype hierarchy of class ZCL_FALV
ABAP Unit
ABAP developers finally started to recognize the added value that Test Driven Development (TDD) and unit tests bring to the development and maintenance processes. The OpenSAP course titled “Writing Testable Code for ABAP1” helped introduce unit tests to many thousands of ABAP developers, so it is important to know how to run unit tests in the Eclipse environment.
From the Project Explorer, Outline, or Editor: Choose Run As ➤ ABAP Unit Test.
From the Eclipse menu bar: Choose Run ➤ Run As ➤ ABAP Unit Test.
From the Eclipse toolbar button: Choose Run ➤ Run As ➤ ABAP Unit Test.
Use the Ctrl+Shift+F10 shortcut.
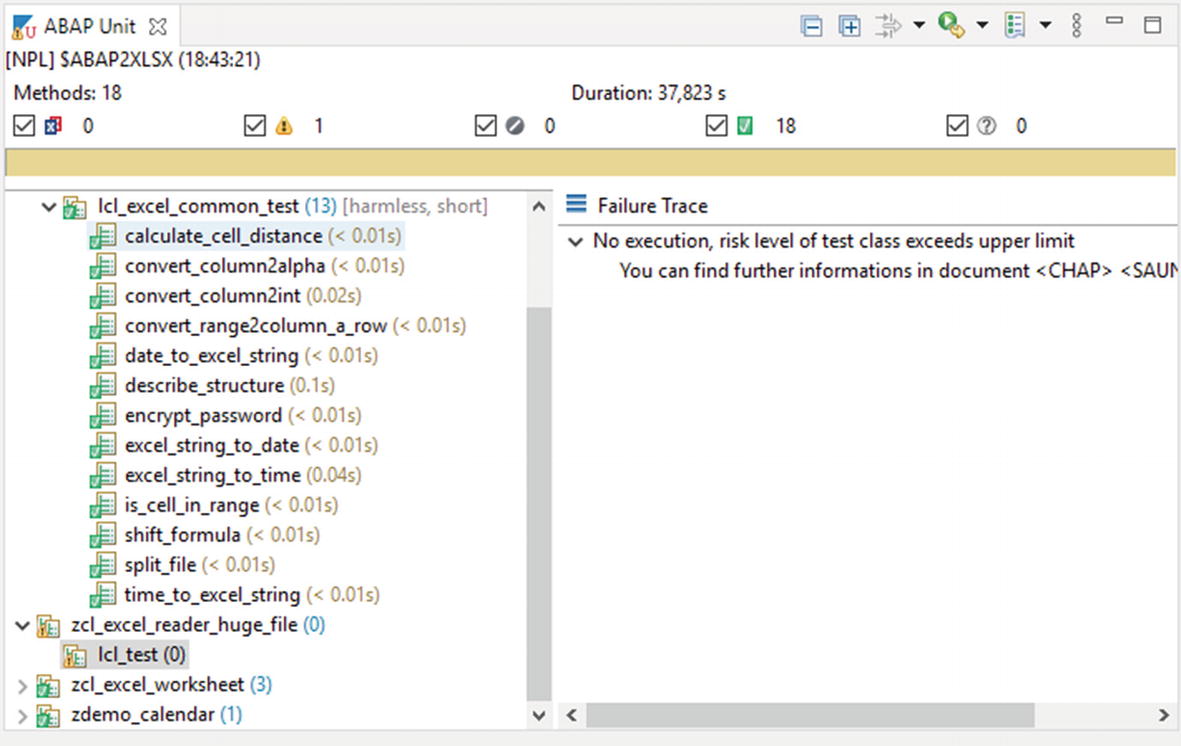
ABAP Unit run results for the abap2xlsx project package
When test methods fail, their icon will turn red and the status bar in this view, which in Figure 2-38 was yellow, will turn red. You will have to correct the part of code that’s checked by the test method or update the test method itself. Once you fix it, you can use the context menu of the view to rerun the selected tests.
If you use the context menu to rerun the tests, you will see that there are some additional options: Rerun with Coverage and Rerun with Profiling. Rerun with Coverage runs the tests again and opens a new view called ABAP Coverage, which displays information about the percentage of the code that is covered with unit tests. You can read more about the ABAP Coverage view in the next section of this chapter.
Rerun with Profiling is useful when your tests are taking a long time and you want to determine what could be corrected to get better performance. When you use this option, after completing the tests run, Eclipse will open a new view called ABAP Trace Requests, on which you will find the request for your test methods. ABAP Trace Requests and linked ABAP Trace views are described in more detail in the next sections.
ABAP Coverage
Full or partial coverage of the unit tests can be one of your goals during development in ABAP. The ABAP Coverage view gives you an opportunity to check the current status of the coverage as well as to identify which statements are not covered with the tests.
From the Project Explorer, Outline, or Editor: Choose Coverage As ➤ ABAP Unit Test.
Use the Ctrl+Shift+F11 shortcut.
Use the toolbar or context menu in the ABAP Unit view and choose the Rerun with Coverage function.

ABAP Coverage for the ZCL_EXCEL_COMMON class of abap2xlsx

ABAP Editor with coverage highlighting turned on
ATC Problems
Among other things, the ABAP Test Cockpit (ATC) helps developers follow company rules and find performance issues inside the code. Depending on the system configuration, you may be forced to use it, but even if the ATC findings are not blocking you from releasing your transports, it is still good to run it in order to correct your code according to best practices.
From the Project Explorer, Outline, or Editor: Choose Run As ➤ ABAP Test Cockpit or Run As ➤ ABAP Test Cockpit With….
From the Eclipse menu bar: Choose Run ➤ Run As ➤ ABAP Test Cockpit or Run ➤ Run As ➤ ABAP Test Cockpit With….
From the Eclipse toolbar button: Choose Run ➤ Run As ➤ ABAP Test Cockpit or Run ➤ Run As ➤ ABAP Test Cockpit With….
Use the Ctrl+Shift+F2 shortcut.
After you run ATC, the ATC Problems view will be shown automatically. After the ATC run is finished (it can take some time), you will be notified about all findings. There are three types of findings: error, warning, and information. They correspond to the priority 1, 2, and 3.
Besides the finding type, you will also see the finding message, the check group, the place where the finding was recognized, and information about the exemption status. After selecting the message, you will also see the detailed text of the message, where you can often find the pragmas or pseudo-comments that you can use to hide the finding, or the information about how you can change your code to fulfill the rule.

ATC Problems view with error and warning findings
If you double-click the finding, you can navigate to the place of the finding, which helps you more easily correct the code. Once you’re done, you can use the context menu and the Recheck function to rerun the ATC and see the updated results.
If you are working on a S/4HANA custom code adaptation project, you may find a very helpful functionality in the context menu, called Recommended Quick Fix. This function calls the wizard to help you adjust the findings to the state in which they will no longer stop you from using your code on S/4HANA system.

Request Exemption wizard screens (scope and approver selection)
The next step is to select the approver and give justification for the exemption. You can indicate if you want to be notified after the exemption status changes.
ATC Result Browser
When you want to come back to an earlier ATC check, you can use the ATC Result Browser view. It will show you the ATC checks for your user (Local Check Runs), as well as the results of Central Check Runs if you have access to the central ATC system. Information is presented in the form of a tree, as shown in Figure 2-43.
This view is useful when you want to come back to earlier results of an ATC because you were interrupted when solving the findings and additional ATC runs might take a long time in your environment.

ATC Result Browser for local and central runs
When you double-click the run (local or central), details about all the findings for the run are displayed in this view.
Data Preview
As a developer, you will occasionally need to look at database entries. When you are using SAP GUI, you run transaction SE16 or SE16N for that. But in Eclipse, there is no point in launching these transactions, as we have Data Preview view.
To run Data Preview view, you must have the database table, database view, or CDS view opened in your editor and then press the F8 button. The other option is to use the Project Explorers context menu. You do this by selecting any of these objects and choosing Open With ➤ Data Preview. By using one of these two ways to open Data Preview, you will see a new tab with 100 entries from the selected object.

Data Preview of the SFLIGHT table
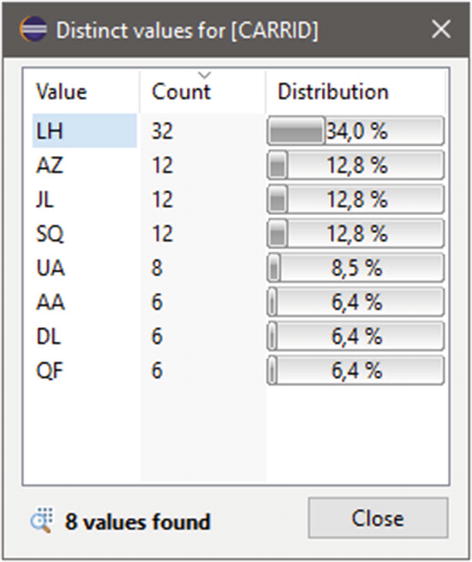
Distinct values on the CARRID field of the SFLIGHT table with 100 entries

Table data inline declaration for entries copied from Data Preview
One last option of Data Preview, which we should not forget, is calling the SQL Console view.
SQL Console
I just mentioned that you can call the SQL Console from the Data Preview, but there is also another way to call it. You right-click the project name in Project Explorer view and select the SQL Console function.
Sample SQL Statement That Will Work with the SQL Console
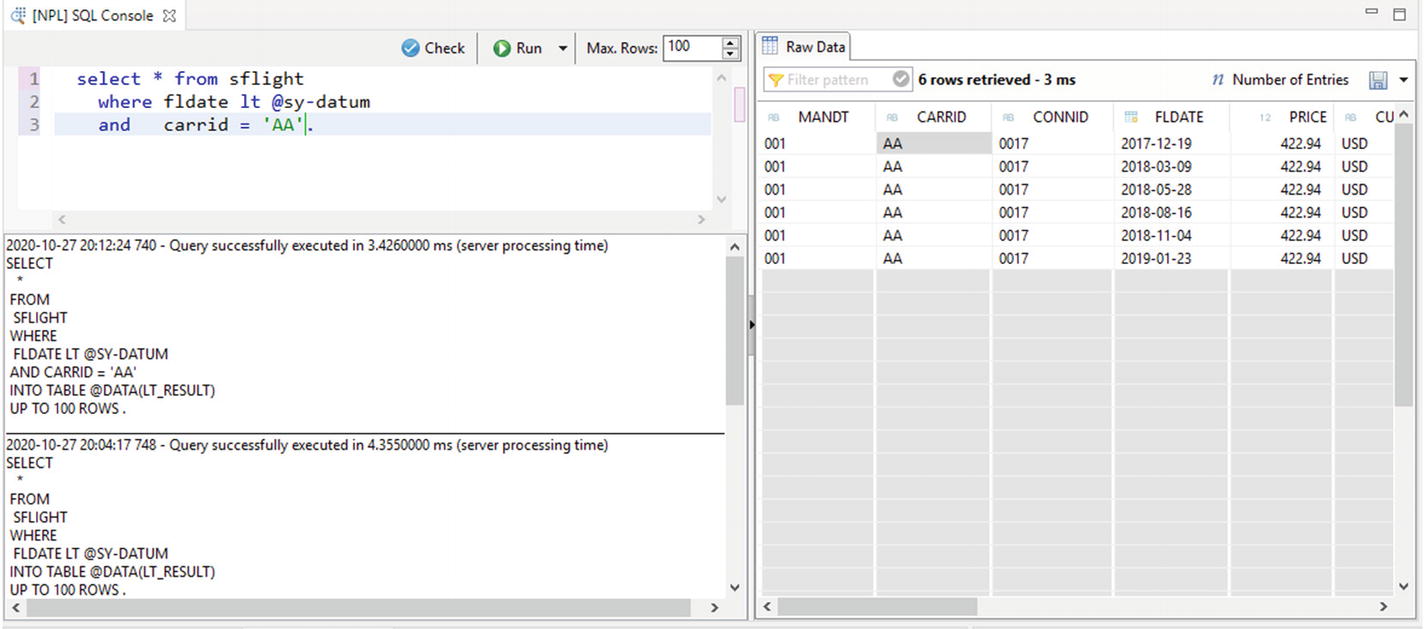
SQL Console view with a sample SQL statement
You can also see the historical SQL calls here, which will be cleared after you close the view. They will remain in the history of the calls, which you can check and reuse from the Down Arrow button next to Run. You can also save your current SQL statement as a favorite for future use.
Feed Reader
When you start using Eclipse and you are logged onto several systems, you will notice that from time to time, a small popup in the bottom-right corner of the Eclipse window will inform you about your recent short dumps or short dumps of objects that you have created. This information comes from the Feed Reader and can be customized according to your preferences.
Runtime errors caused by me
Runtime errors for objects I am responsible for
System messages
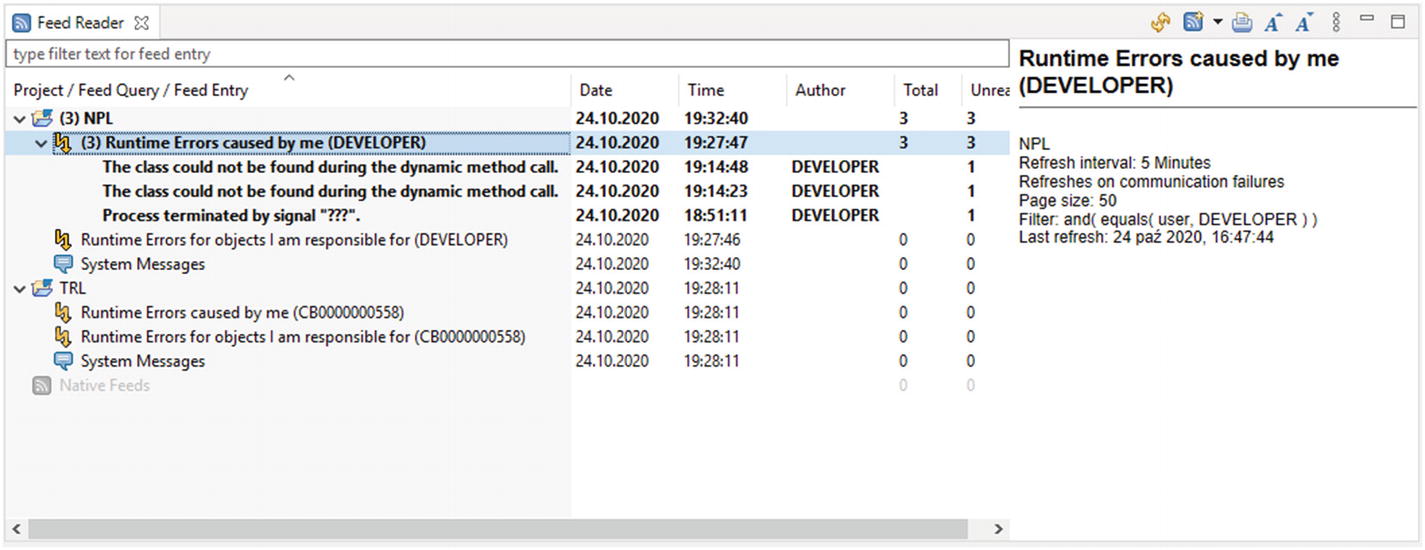
Default Feed Reader view
Show in SAP GUI
Show where terminated
When you click the Show in SAP GUI link, the embedded GUI screen will appear in the place of the editor and the short dump will be opened, just like you would navigate through ST22.
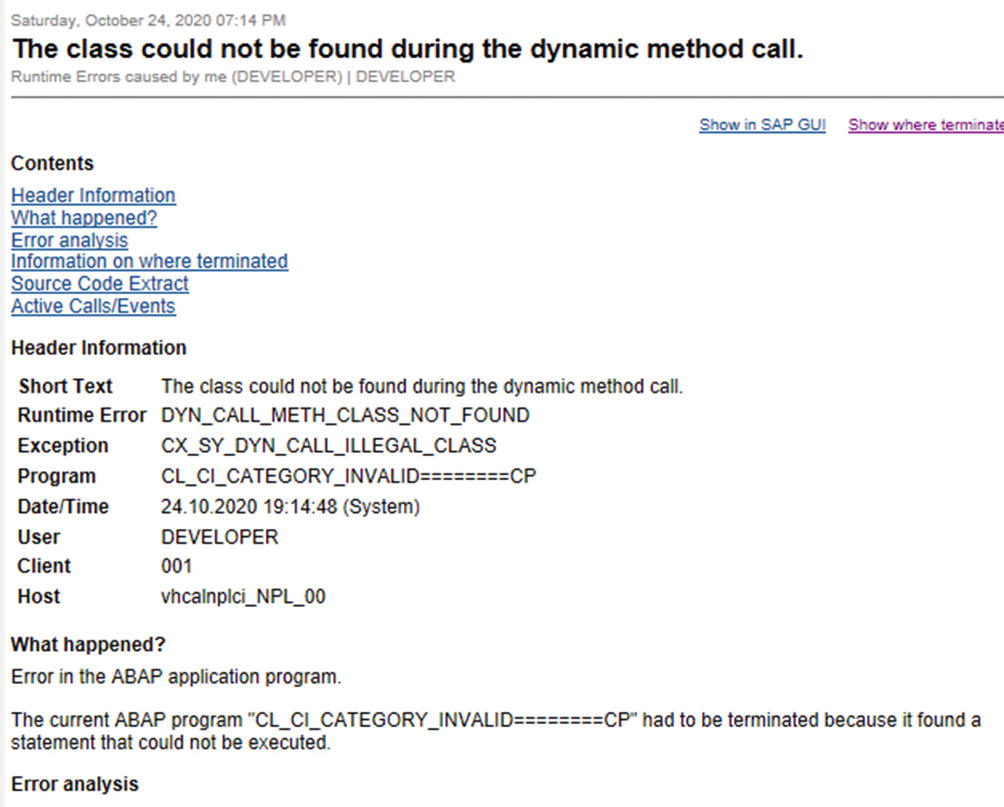
Short dump view in Feed Reader
I do not know how about you, but I usually know when I created a dump, so I do not need the notification from Eclipse. Fortunately, there is a way to switch off these notifications, or even completely delete the feed so they are not refreshed by Eclipse’s background jobs. To do so, simply select the feed that you want to change and right-click it to bring up the context menu. You will then have the options to delete it or to edit the feed.

Edit of the Runtime Errors feed
Nevertheless, I’m deleting those two standard feeds for runtime errors and keeping the System Messages feed, where system admins inform me about restart of the system or the next system copy.
I also activated the SAP Gateway Log and native RSS feeds to follow the SAP Community.
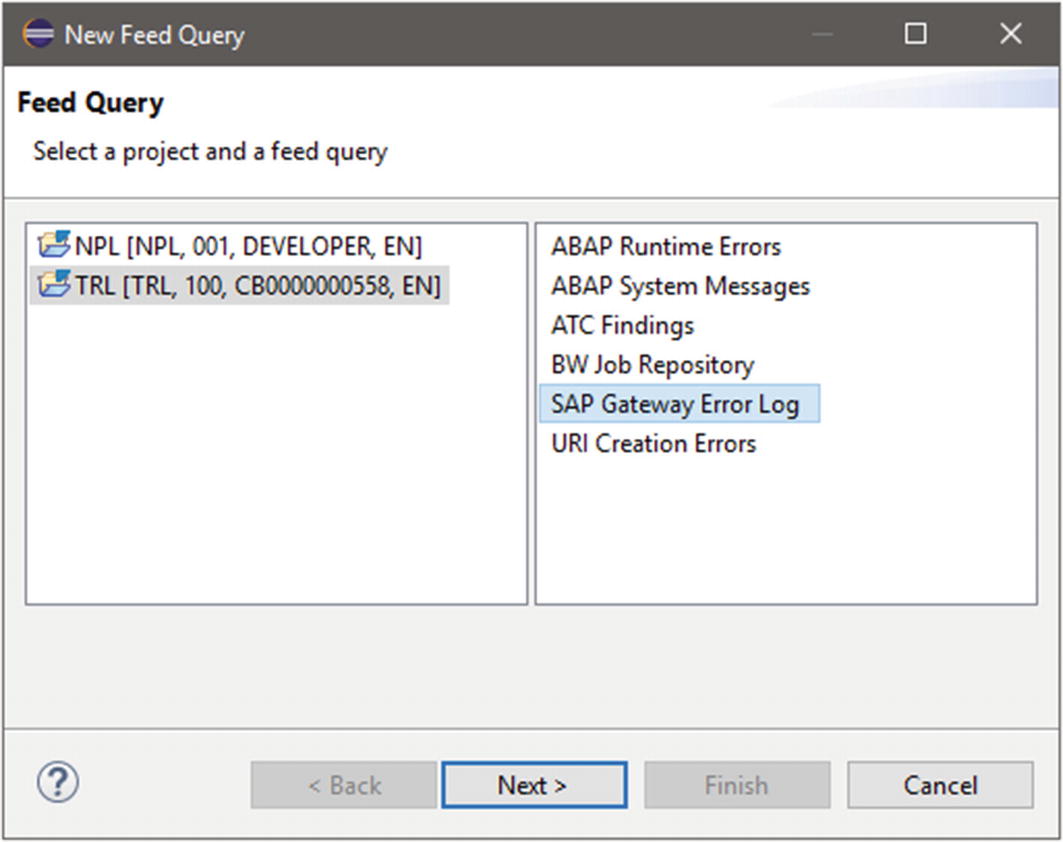
New Feed query from the ABAP Repository
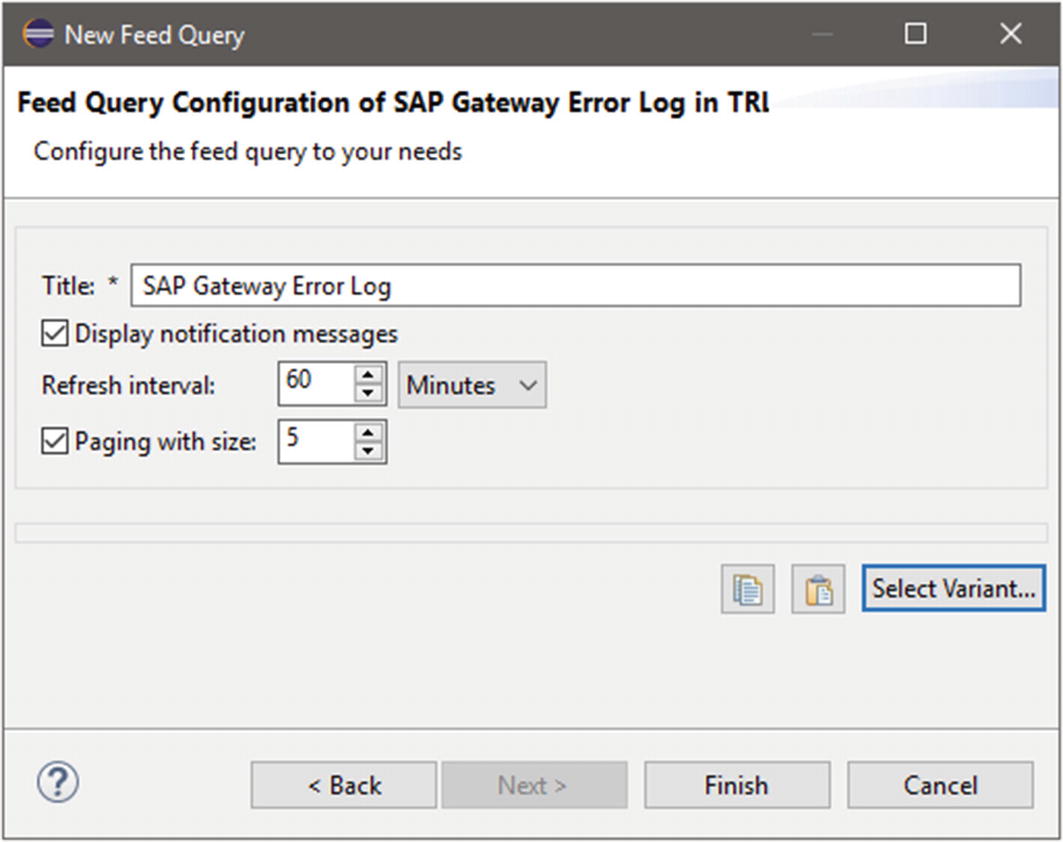
Configuring the SAP Gateway Error Log
After you set up all the preferences and click the Finish button, you will notice the SAP Gateway Error Log feed in the folder of the applicable system.

New Feed Query for the RSS of the SAP Community

The latest blog post about ABAP developments on SAP Community
When you double-click a native feed entry, you will be moved to the SAP Community website and this particular blog post.
Quick Assist
In most cases, I do not use the Quick Assist view. I use Quick Assist on the ABAP editor directly, but if you have to work on legacy code, you may want to have it active all the time.

Quick Assist view
Once you select the proposal that you want to accept, it will be applied to your code. In some cases, a popup will appear before the change in order to confirm all changes that will be applied in the current object and all that are affected. This is very visible, especially when refactoring the public class attributes or methods that are used in several places in your SAP environment.
The proposals that come from the ABAP backend can differ between the SAP NetWeaver versions, but all of the systems should contain several basic functions like renaming, changing visibility, pulling up or down, extraction of methods, and extraction of literals and constants. Quick Assist is covered in more detail in later chapters.
Relation Explorer
When your system is at least on NetWeaver version 7.54 or you are using SAP CP ABAP Environment 1908 or higher, you can use the Relation Explorer to get an overview of relations between the objects. The relations are displayed as a tree and grouped by the type of the related objects, which you can see in Figure 2-56.
By using the Alt+Shift+W shortcut in the editor
By using the editor context menu Show In ➤ Relation Explorer
By selecting the object using the Other Object view toolbar button
By linking the Relation Explorer with the active editor
By using the History List button on the view toolbar, to use previously used objects

Relation Explorer with used object context for the CL_ABAPGIT_APP_LOG class
Business objects (for Data Definition Language Sources, Behavior Definitions, Behavior Implementation Classes, and CDS Views)
Core data services (for CDS Views and Access Controls)
Used objects (for most of the objects)
Using objects (for most of the objects)
Extended objects (for enhancement implementations)
Extending objects (for objects that support the Enhancement Framework)
Each context displays different relation types; they can be selected from the toolbar menu using the Other Context button. You will not have to remember which of the contexts you can use for which object, because the list of the contexts are limited only to the ones that you can use.
ABAP Communication Log
You will not likely run into this view until you want to create your own plugin for Eclipse that communicates with the ABAP backend. This view displays information about communication between Eclipse and your SAP instance.

ABAP communication log with activated logging

Details of an HTTP call to the SAP backend
If this fails, use the View menu or toolbar button to activate ABAP tracing for the HTTP calls. While activated, it will generate trace requests and collect the trace information in the system. You can use ABAP Traces view to read the trace information.
Even if everything is going correctly with your calls, you can test the behavior of Eclipse when only a slow connection to the system is available. To do so, use the Snail button on the view toolbar and select one of the preconfigured delays, or set up your own custom delays for the calls. This might help you determine if you want to do your HTTP call synchronously or asynchronously.
ABAP Trace Requests
Every ABAP developer has to check the performance of the code, but sometimes you are not able to repeat the steps the user took on the production system. In this case, you need to activate tracing in order to get detailed information about the runtime of the code.
The ABAP Trace Requests view was prepared to create and manage tracings, especially when you cannot run profiling directly on an object. To create a new request, simply click the Create Trace Request button and the wizard for trace scheduling will open, as shown in Figure 2-59.
Web requests (HTTP)
Reports and transactions (dialog)
Remote function calls (RFCs)
Background jobs (batch)
Shared objects area
Any (trace object with all possible scopes)
Report
Transaction
Function module
Area constructor
Any (which you will be able to use, for example, for class tracing)
Scheduling a new trace request: scope selection
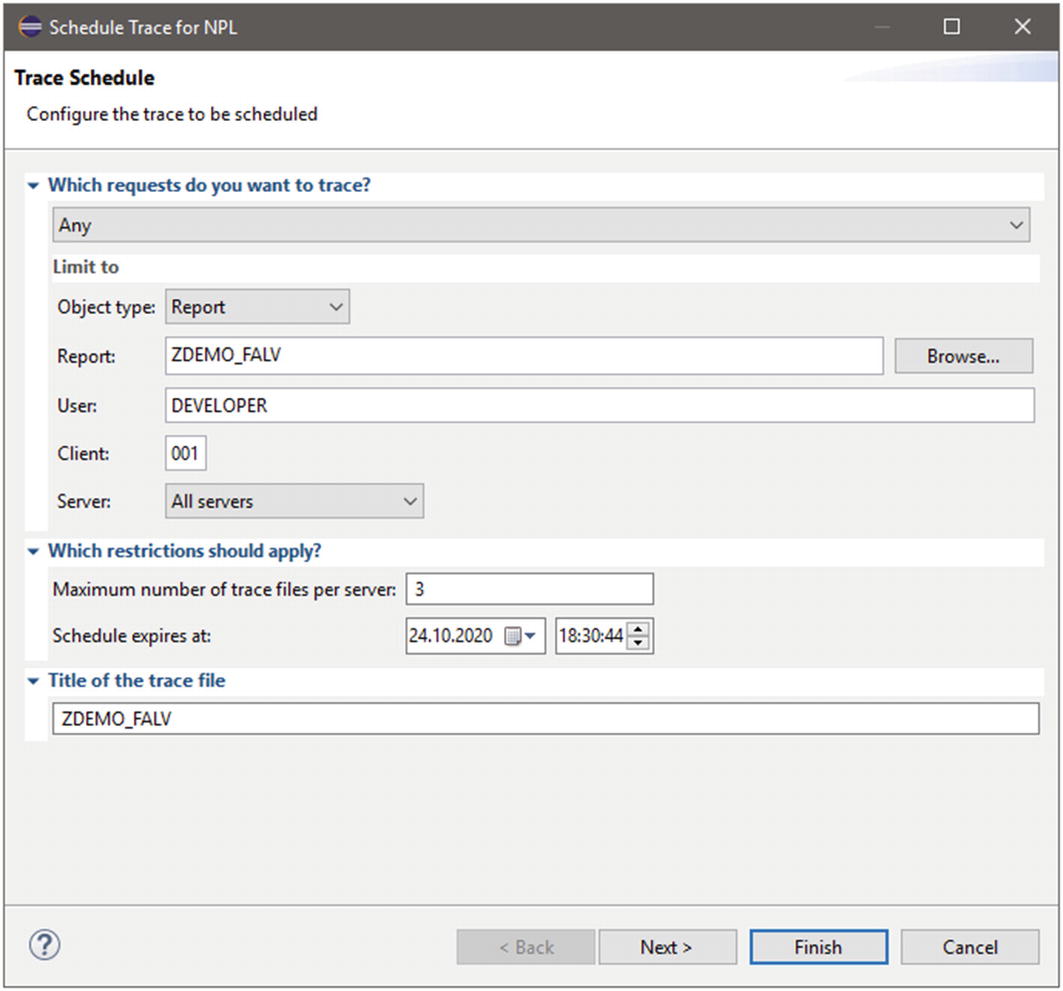
After object type selection, you will have to choose which object you want to trace, for which user and client, and on which server. If you want to run tracing for any user, just leave the user field empty. Additionally, you need to choose for how long the tracing will be active and after how many catches of the trace will the system stop collecting them. It is also important to set a proper name for the tracing, especially if you run lots of traces at the same time.
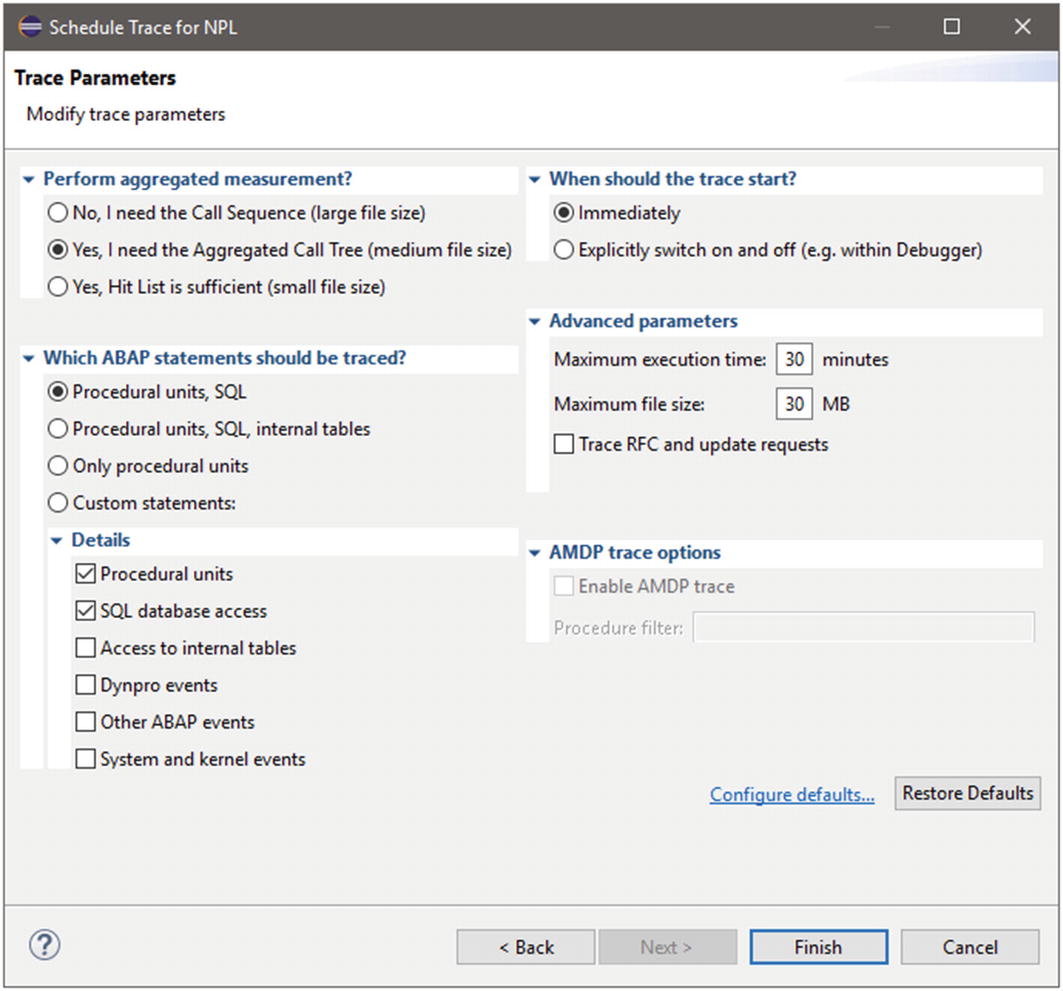
Scheduling a new trace request: parameters
You can also set up default profiling parameters by using the Configure Defaults hyperlink on that screen, which is quite helpful if you are focused only on parts of the ABAP statements.

ABAP Trace Request view
In order to see the trace details, you need to open ABAP Traces view or double-click the trace request. Then the ABAP Traces view will be opened automatically, highlighting the linked traces on the view.
ABAP Traces
From the Project Explorer, Outline, or Editor using the context menu: Choose Profile As ➤ ABAP Application or Profile As ➤ ABAP Unit Test.
From the Eclipse menu bar: Choose Run ➤ Profile As ➤ ABAP Application or Run ➤ Profile As ➤ ABAP Unit Test.
From the Eclipse toolbar button: Choose Profile As ➤ ABAP Application or Profile As ➤ ABAP Unit Test.
Use the Ctrl+F9 shortcut, which will call profiling as an ABAP application.
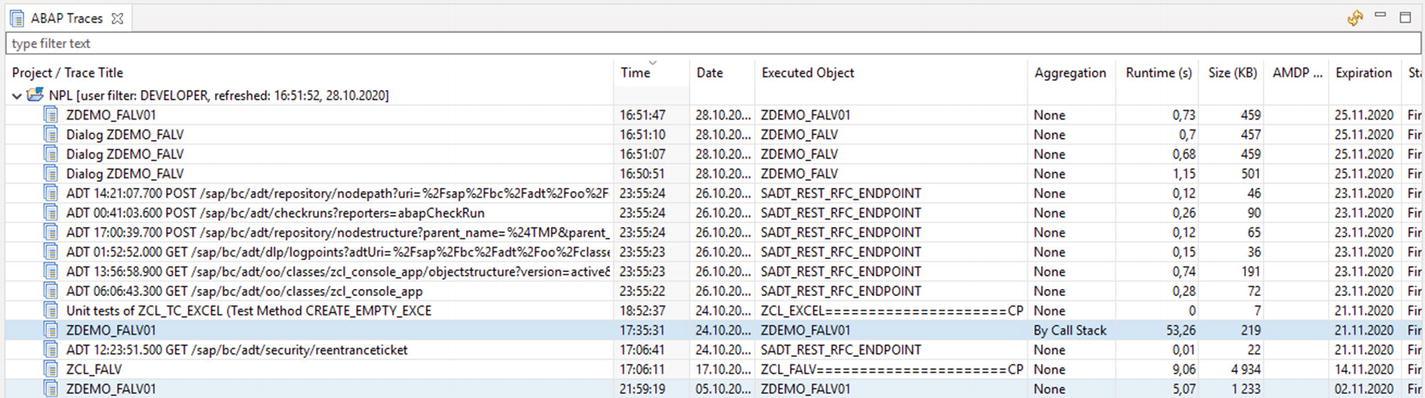
ABAP traces lists
You are not limited to your own traces; you can change the user filter by using the context menu on the project name and choosing the Change User Filter option.
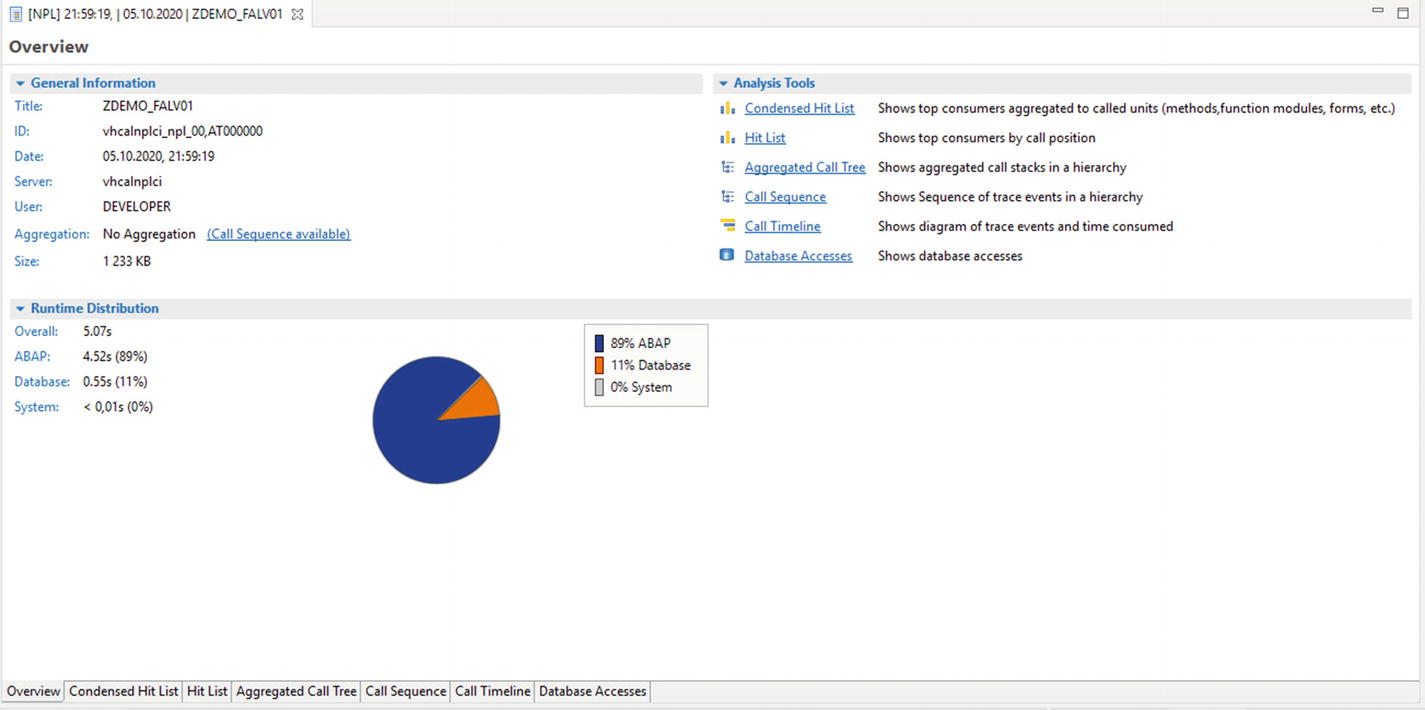
ABAP Trace details
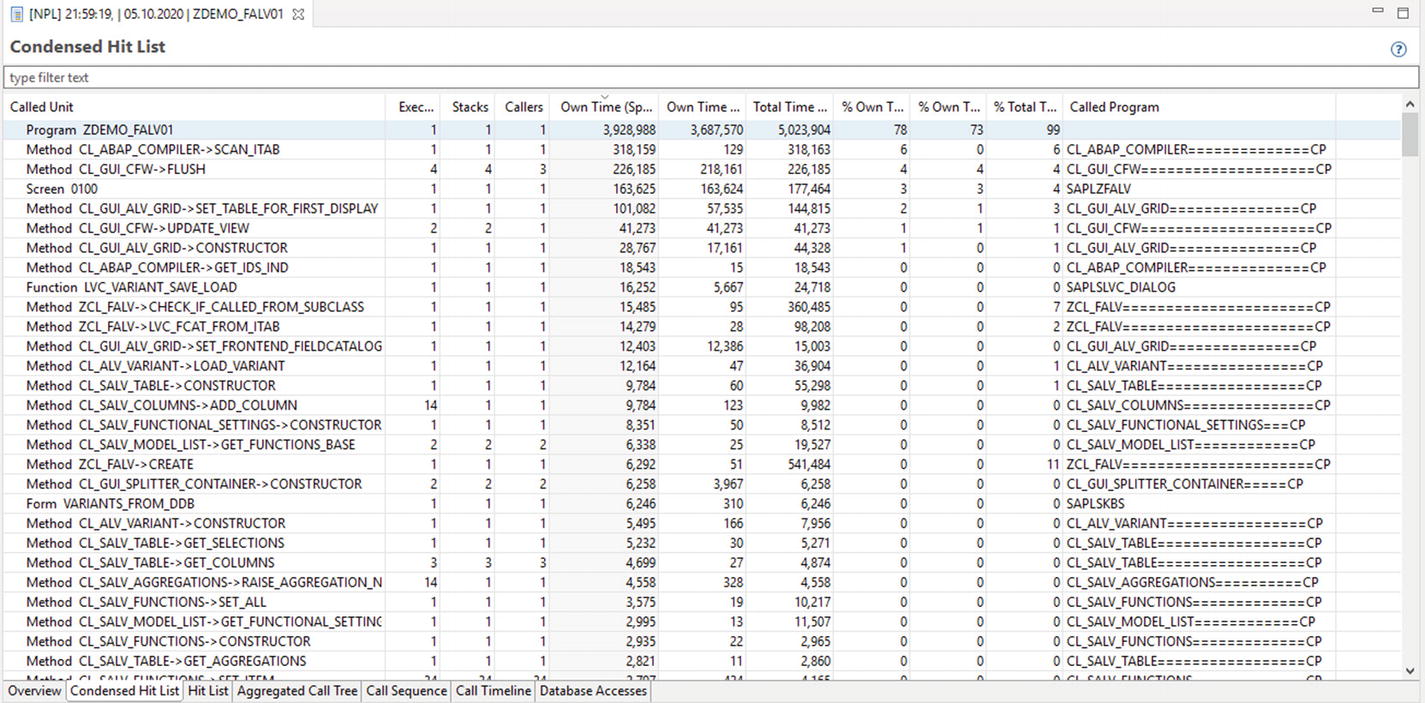
Condensed hit list of an ABAP trace
Tasks
You have seen the Bookmarks view before, which can help you follow an unfinished task or mark some special coding. If you use bookmarks, you have to remove them manually when you finish the implementation.
The Task view is very similar to the Bookmarks view, but it allows you to indicate that the work is done. Additionally, you can store the tasks that are not related to ABAP development here. You can also set up a priority for a task, which can help you sort tasks accordingly.
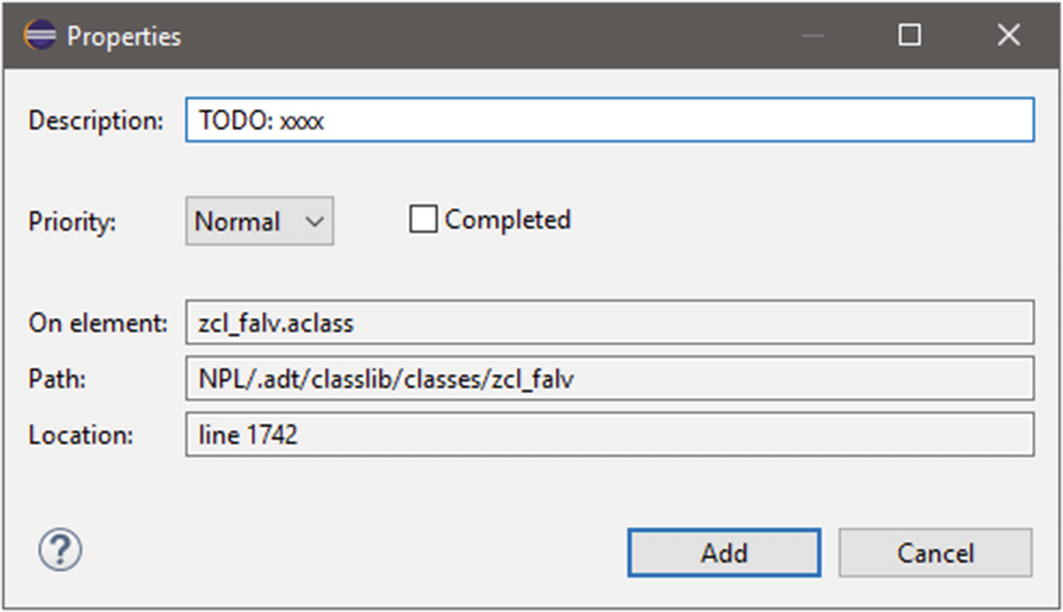
New task linked to an ABAP Development Object

Task view with tree tasks of different priorities
As I mentioned, you can sort the task by priority, as well as by any other column available on the list. You can also filter the entries to show tasks that include specific text, or create a separate view with a customized filter. You should not be surprised that after double-clicking a task that’s linked to a development object, you will be moved into the linked line of the object.
Error Log
When your IDE is not acting as you expect, it may be time to look at the Error Log view, where the whole log for the IDE is displayed. The log information is collected regardless if the view is opened or not, but the view gives you the possibility to clean it, export or import the log, and view the details of the log.
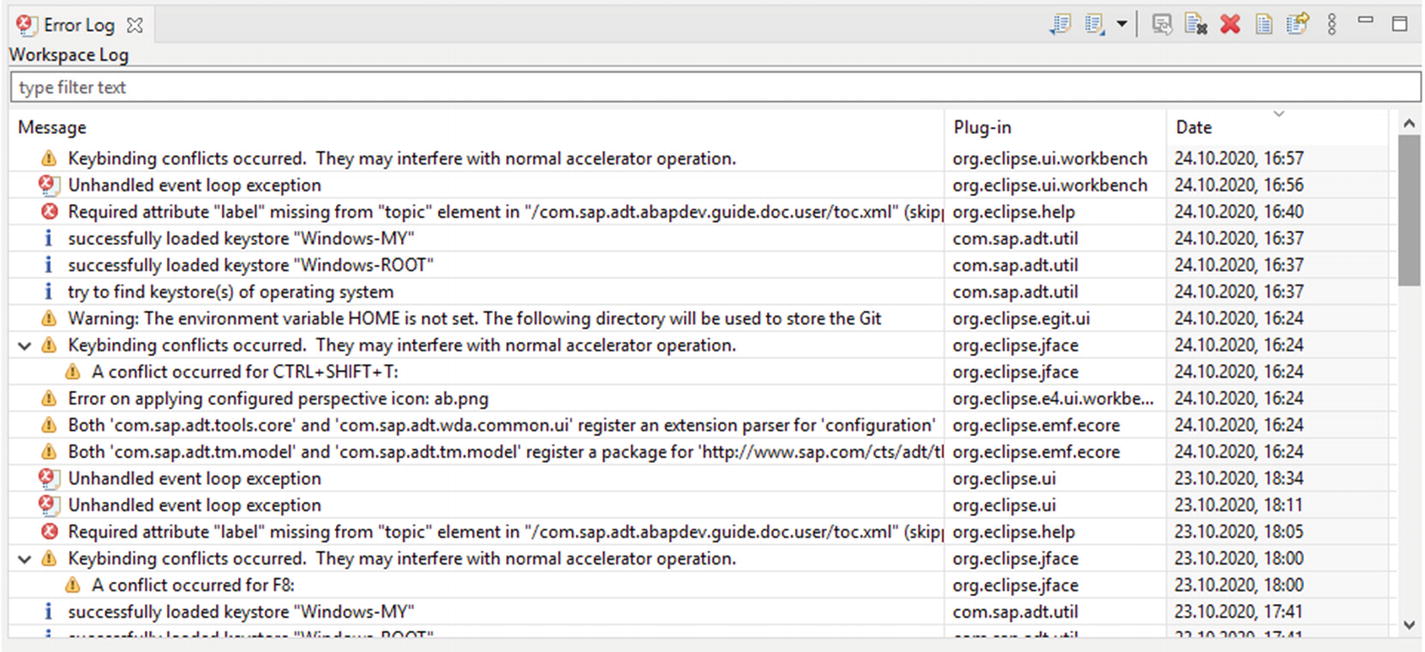
Error log view

Error details
You may wonder why you would need to check these details, but the answer is very easy—ADT and Eclipse are frequently updated and some of the functionality can contain bugs after an upgrade. This details view sent to the Eclipse community or SAP support can raise awareness of the issue and can speed up resolution time. It can also be helpful, when you create your own Eclipse plugin, to see where your code is failing.
Progress
Normally, you should not be concerned about the background calls that are happening in Eclipse, but if there are some issues with your IDE or one of its plugins, this view can help you figure out where the error is coming from.
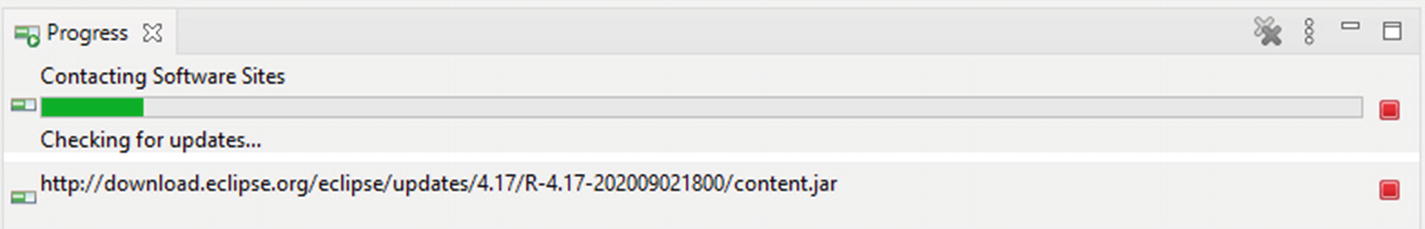
Checking for possible updates to Eclipse
Summary
Many views were described in this chapter. It can be difficult to remember what all of them do, but you should have an idea about what information you can get in ADT without using the SAP GUI. You can come back to this chapter whenever you see one of the views on your screen and need more information.
The next chapter focuses on the ABAP Editor and the possibilities that it gives every developer to work faster and more efficient with ABAP code.