Chapter 3
Creating a Foundation of Data
Key Points and Questions
- Staying focused on the strategic business question is critical for the data acquisition process.
- Data accuracy and timeliness are critical to the success of delivering intelligence.
- How useful is your data? Do you have data quality reporting?
- “And Moses sent them to spy out the land of Canaan”
Information acquisition has a long history. In biblical times, there was already a dire need for the right information. Take the story of Joshua and Caleb and the 12 spies in Canaan. For those unfamiliar with the Bible, the short story is this:
The Israelites were just exiled from Egypt and were traveling to the Promised Land of Canaan. God promised the Israelites through their leader Moses that the land of Canaan would be a land of milk and honey in abundance, but they had to take it over from the current inhabitants. Moses wanted actionable intelligence, full information about internal and external factors about the land and its people. He said, “Go up through the Negev and on into the hill country. See what the land is like and whether the people who live there are strong or weak, few or many. What kind of land do they live in? Is it good or bad? What kind of towns do they live in? Are they unwalled or fortified? How is the soil? Is it fertile or poor? Are there trees in it or not? Do your best to bring back some of the fruit of the land.” (It was the season for the first ripe grapes.)
Twelve spies went out and traveled all over the lands of Canaan, which were very suitable for living, compared to the desert the Israelites were residing in at the time. In Canaan, the clusters of grapes were too big for one person to carry. The people living there were big and strong, and the towns were fortified with walls, but they had to make a decision.
So after 40 days of gathering intelligence on the enemy, the band of spies returned to where the Israelites were camping and told them of all the obstacles standing in the way of their claiming the land of Canaan. The Israelites were dismayed by the news. Some began questioning Moses' plans to enter the Promised Land at all, afraid they would be killed in battle. Only Joshua and Caleb tried to convince the others that although the people in the land were strong, it was the time to seize the opportunity.
And so by overanalyzing—by not following actionable intelligence but instead following their guts—the Israelites turned away from Canaan and started a 40-year journey of wandering across the desert. During the journey, all of the spies except Joshua and Caleb perished. Even Moses died just prior to reaching the Promised Land again. And under the reign of Joshua, Moses' successor, Canaan, was eventually taken.
The moral of this story: Bad things happen when people receive intelligence but act on their gut and hearsay instead of being guided by the facts.
Businesses also need timely access to facts to make the right decisions to enable them to grow faster, as opposed to being stuck in the desert of rumor, hearsay, and gut-based decisions. And to get facts we need a foundation to build on.
Building the Foundation
When building a house, you need to build a foundation. It is not beautiful, you cannot cost-justify it, and it is not even visible when the house is complete. Few house owners receive the praise, “What a nice foundation you have!”
This foundation building is not a new concept. Thousands of years ago a story was written about two men who each built his own house. One man built his beautiful house on sand. The other man took time to build a solid foundation for his house on rock. When the storms of change and challenge came, only the house built on solid rock was left standing.
In the same way, it can be tempting to just go and create the dashboard or rush to buy a business intelligence (BI) system instead of taking time to develop a strong foundation of a data dictionary and central repository. This temptation to immediately deliver visible results can hamper efforts to deliver significant, sustainable, measurable results. Neglecting the foundation results in a chorus of “told you so,” when, in the end, the business receives the same old reports with marginally better graphics. The weak foundational issues of missing or incorrect data still are not fixed.
What companies need to do instead is create a data dictionary that maps data names and definitions throughout the enterprise, and they need to validate the information. Documentation and validation are the solid rock foundation needed for actionable intelligence.
Benefits of Having the Right Data
What is the value of ensuring the data is correct?
Well, if the data is wrong you could miss shipments, disappoint customers, and possibly spend thousands of dollars reworking quality issues. Just avoiding one mistake pays for fixing this situation and also improves morale in the organization because employees can see where the problems are coming from and stop performing mind-numbing “checking” work.
A good tip would be to take the time to estimate the cost of past mistakes. Doing so should result in data management getting the attention it deserves. Consider the following example:
- A shipment to Thailand of . . . women?
- The global supply chain team at a large cosmetics company received a message from the Thai authorities, “Your shipment has been held in customs because the documentation says the product is women.”
- Imagine a shipping container being inspected. The company is shipping a full line of cosmetics to the Thai market to be sold in high-end retail stores: lush red lipsticks, sweet perfumes, luxurious accessories. The container was sent to replenish store inventories and launch a new product. Now, the whole shipment is stuck in customs because of one small problem. The new product had not been named correctly in the system. Someone forgot to change from the working name to the real product name. For more than two weeks the container sat in the hot sun of Thailand's busiest port. The products won't get to the stores on time unless extraordinary, and expensive, efforts are made.
- The point is, data accuracy has real business implications. A simple data-entry flub cost thousands of dollars and delayed a shipment of new products to retail stores by several weeks—just one piece of data!
The Data Challenge
Notes Donald Farmer, VP, product management at QlikView: “People don't trust data. People trust other people and their opinion of the data.”
It is easy to understand why. In a large corporation with more than 600 systems, lots of data, and no data quality dashboards, the strongest opinions of a few people reign supreme.
Explanations for poor customer service or projections for what it could be in the future are pure conjecture but, when stated with authority, are taken as fact.
More than one supply chain executive has implemented inventory optimizers, supply network planning, and other capabilities, only to find their organizations do not trust the output of these optimizers due to incomplete or incorrect data.
How can an inventory optimizer work in an environment where global inventory is not readily available? The answer is, it can't.
The challenge now is: How can we make people trust the data again?
The simple answer would be: Create a data foundation for the data in the company that is complete and accurate at all times.
However, it is impractical from the standpoint of time, resources, and fast delivery to try to create a data foundation of all data in a company. The strategic business questions need to be a guide for where to start and end. We need to find, acquire, and disseminate the data needed to answer the specific questions we need answered. Remember, focus on the questions at hand and work as efficiently as possible to assure success.
Acquire Data in Four Consistent Steps
When gathering data, the main thing to keep in mind is what the data will be used for. By constantly asking that question you can assure that you will not do unnecessary work when creating the foundation on which to build your successes. Ask yourself where the data will fit in the big picture. This will also let you make sure that you can answer your strategic business questions.
When you have figured out what strategic business questions you need to answer, it's time to create the foundation. Here, are the four steps you should take when creating the data foundation for actionable intelligence. Each step will be explained in detail.
Step 1: Identify the data needed and gather data from the known sources.
Step 2: Document the acquisition process into the data dictionary.
Step 3: Determine the data owners, validate the data with them, and create a data dashboard for those owners.
Step 4: Implement changes in people, processes, and systems to improve data quality.
Step 1: Identify the Data Needed and Gather Data from the Known Sources
If I am trying to decide what type of shoes to buy, I need to know what the weather looks like in the place I live. If I've slipped a couple of times on railroad platforms or steps on rainy days and I'm smart, then I also need to determine whether those incidents will be a factor in the shoes I decide to buy. I know whether I want comfortably tight or loose shoes. Do I need the shoes to be seen, and who will see them? How long will they need to last, given my budget? With all of this data collected, I then need to figure out where I can buy shoes. How can I collect them? So, I have focused my data collection on an internal set of data and an external set of data. If I only have the weekend to decide, I will become even more precise about the data I need to collect. In other words, I may not be able to collect all types of data.
Applying this principle to the business, after you have a sponsored business question, you need to make sure to start off with a list of the data you need to answer the question. With the question in mind, hold some ideation sessions and list key facts needed to answer the question and determine what is redundant. Go through a couple of rounds to figure out what those are. Then seek out the source of that data. Understand where it resides, how often it's updated, and how to access it.
Step 1 is perhaps the most straightforward: Identify the data you need, and place all the data in one place for you to use. Though that doesn't sound very complicated, it can take up most of your data collection process. This process takes weeks and months of approvals, requiring reviews by interested and not-so-interested parties (with a risk of a “no” or simply running out of time). That is the risk when working with people who have to give up control over their own data in exchange for the benefits of actionable intelligence.
It is possible that the process of gathering your most important data will be so exhausting and costly that the project of creating actionable intelligence will never get past this stage. That is why it is very important to gather only the data that is necessary for the business questions at hand. You can always collect additional data down the line.
It might be helpful to set up a (temporary) data repository to centralize and control the data you are going to use, making quick connections to all the data you need at different sources. The IT department can be of great help in setting up a server to get that data repository up and running. In fact, never underestimate the help a good IT department can offer—if it is convinced that a plan has merit and can actually work.
Step 2: Document the Acquisition Process into the Data Dictionary
To start your data acquisition, typically you need some smart computer person to go and tap into the data source. This person can do two things: Tell you what the front screen looks like and what on the front screen matches the back end of the database. For example, what's on the front end might be named “shoe,” but on the back end you might be looking at product ID “QB1234567.” Unless you have someone who can translate what users are seeing up front into what the database is storing at the back, you'll have to go through trial and error to figure it out.
Many times, systems are not fully documented in companies because they have been modified over time or even custom-built. So, in acquiring data from a system, you don't want to make the same mistake that has been made in the past. The best documentation for data acquisition and the best documentation to make your actionable intelligence effort repeatable is a data dictionary. The data dictionary includes the list of elements that you want to have in order to answer a strategic question in plain business terms, as well as a definition of what it's supposed to mean.
After you have spoken with the computer person who explained the logic of how the field is filled in, you can judge how close that comes to the definition you expected. Then you can identify the specific fields and the system or systems that the data comes from. Now you have your data dictionary, and it's repeatable. You know where your data comes from, it is relevant to the question you want to answer, and you know what it means.
The challenge to data acquisition is that you may not be allowed to acquire the data because people have built up silos to protect. People have built jobs—careers—protecting the data, massaging it so it looks just right. So now you come in and say, “Hey—I want your sales data!” It is not likely, even when you are in the same company, that sales data will be shared with you by a different business unit even if it is in a different region. Clearly data acquisition has a human side to it: Will the owner share the data with you? That's why it is important that data acquisition is aligned with the strategic question. If a senior executive has asked you to answer her question, you can go back to that executive and say: “I'm being blocked from getting the data that we agreed was necessary to answer your question.” Now the executive can go to the data blocker and say: “Give up your data!” And you have broken down one silo.
It is important that you don't start on the technical side when collecting all the data because then you have no senior-level support. Thus, you will miss the bargaining power to break down silos and gain control of other people's data. Always circle back to the senior-level support throughout this data acquisition process.
This is where the data dictionary will be important. It will tell you who owns the data, who gave you access to the data, how frequently you can get the data, and how you can pull the data in.
The data dictionary is also important because it provides a path for consistency. If someone leaves the acquisition team, for example, the person's replacement can use the dictionary to figure out how to appropriately treat the data.
Timing is also important: Let us say I have up-to-date sales data, but my pricing is not up-to-date. Now I have a problem. If I match up the two, my price and quantity would not line up.
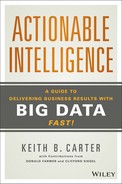
In a global company, it is not unusual to have multiple systems performing planning, warehouse management, data storage, and so on. Figure 3.1 depicts three main challenges you may encounter in mapping data: (1) non-global databases, (2) inconsistent naming conventions, and, worst of all, (3) inconsistent data types.
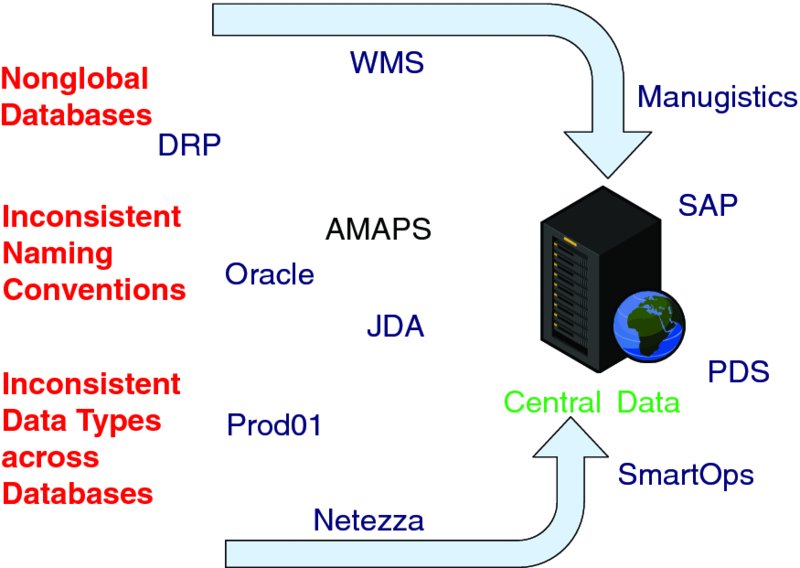
Figure 3.1 Challenges to Map Data
Start with a simple and clear data dictionary. The example shown in Figure 3.2 is from a data dictionary for a central data repository. Data is organized by CD Table (a table that is in the central repository); CD Field (the name of the field in the table in the central repository); Field Name (the source field name); Table/Source (the table of the source data); Definition (the description of item or object); and Source (the front-end source from which the business data can be seen).
Figure 3.2 Data Dictionary
The work of developing the data dictionary must be done by people who are intimate with the business—it simply cannot be outsourced.
When creating a data dictionary, focus on the business description first; the heavy details of data types, field sizes, and technical details will be filled in later. It's important that companies accept the fact that there will be differences in business descriptions and even more important that business and IT teams work together—and across geographies—to create a common business language to eliminate those differences.
The benefit of the data dictionary is that when you go to write your next intelligence tool, you already know the scope of the data that you have, you're clear on the definitions, and there's an understanding of any discrepancies.
Step 3: Determine the Data Owners, Validate the Data with Them, and Create a Data Dashboard for Those Owners
Now you have determined what data you need, collected the data sets, and documented their most important characteristics in a data dictionary. So what's left? You have the data, but you still don't know whether it's the right data, whether it's correct and complete. And that's something you cannot do all by yourself.
People do not trust data, they trust other people and their opinion of the data. So when the data owners, the people who input the data and/or use it, raise their hands and say, “This data is good; I trust it,” that will make it more likely for other people in the organization to believe it. It also means that it's clear. It's not just that they trust it from the point that 1 + 1 = 2. It is also clear how the data has to be used, and the definition of the data is clear.
However, this does not necessarily mean all your data can be universally validated because not every business unit has the same definitions for its data. For example, Brazil's data may be different from Poland's, but both are right—they just use different rules to measure or input similar information.
If you go to the team in Brazil and ask, “Do these numbers look right to you?”
Brazil might say, “Yes, this matches our source system; we've been using that data to manage our business.”
Still, you would double check with Poland and ask, “Do you trust this data? If so, why?”
So now, both Brazil and Poland have validated their data. Now they can trust that data to be true.
But there is another reason to make sure both have raised their hands and said the data is good: Now they're on the hook for the quality of their data, not you.
If you pull in data from different areas and then publish a report, your reputation is at risk. It's important to get all relevant parties to sign off on their data. Now, you're no longer solely on the hook for the data quality.
Placing the data into a centralized spot, understanding it, and making sure it is fit for use is the most important and challenging aspect of the intelligence-gathering project. It also leaves you with important questions: If you succeed, will your effort be sustained? And will your people trust the data, or will you lose control soon, and will data quality decay again?
The data acquisition team needs several tools to be successful in maintaining trust in the data.
- A view of when the data was last updated.
- A list of the tables and the stability of the sources (i.e., was the server up? Were batch jobs completed on time?)
- A review of the changes in data—significant spikes or drops should be at least investigated with the users and IT.
Figure 3.3 is an example of very basic data status, which is easy to start with. Start slow, then move to more advanced analysis.

Figure 3.3 Data Acquisition Dashboard
Figure 3.4 is another view of data health where you can visualize the record counts.

Figure 3.4 Data Acquisition Record Count Dashboard
Again, these are simple views, developed quickly to guard against surprise data issues.
Invest a bit of time in protecting the reputation of the intelligence program. But do not make a whole project out of it with fancy tools and deep algorithms until you've received monetized results from the intelligence program.
Step 4: Implement Changes in People, Processes, and Systems to Improve Data Quality
The first three steps constitute important groundwork to make your data acquisition sustainable. However, the last step is about changing people, processes and technology (P, P, and T).
On the people side, you already got the data owners to say they own the data, they're responsible for it, and they have checked it for accuracy.
Now you need to start with the process of measuring all of that information, because what's accurate today can be inaccurate tomorrow and vice versa. Most of the time you find there's a lot of inaccurate data today, and there's an opportunity to make it more accurate tomorrow, because what gets measured improves.
A company might say: “All my sales information is right.” Maybe. But haven't you seen or been involved in cases where you wanted to have the finance people close the books for a month but they couldn't because one party lagged in its report?
Companies can't make good decisions using old data, which puts responsibility for data quality squarely on the data owner's shoulders. Indeed, data owners have two responsibilities when it comes to data quality: accuracy and timeliness.
The Data Dashboard
It can be useful to record intelligence in a data dashboard. This dashboard will show the current data situation to yourself and all stakeholders. Figure 3.5 shows a sample data quality dashboard for supply chain.

Figure 3.5 Sample Data Quality Dashboard
Some sample key performance indicators explained:
Process Strength
- Green: Standard methodology, complexity mapped, and well-defined
- Yellow: Some standardization, most complexities understood
- Red: Multiple processes to achieve similar goals, complexity not mapped
Input Capability
- Green: Easy, logical to input with bumper rails to avoid errors, right role as owner
- Yellow: Some automation to prevent errors, some propagation/copying
- Red: IRS-like tax form complexity, errors only caught during audit, and painful/costly
Review/Validate Capability
- Green: Validation available to check inputs prior to use by system
- Yellow: Some review reports are available
- Red: Review only possible by re-inputting code, no validation
By the end of the assessment, the chart may mostly be red if there has never been a formal data management team nor supporting key performance indicators to monitor the overall situation. Senior management will become more supportive when they see the easy-to-read chart showing how dire the situation is.
As you start publishing the scorecard, actions will be taken, people trained, and the scorecard will begin to turn from red, to yellow, and to green.
I have reviewed this type of dashboard system with several companies now, and the results are always stunningly . . . red. Whether in New York or Singapore or Japan or Shanghai, the starting dashboards of organizations ranging from banks to universities to manufacturers look mighty scarlet. What color would your organization be today?
The Byproduct: Master Data Management
While building the data foundation to answer your first questions, slowly you realize the process will get easier for you over time. Call it economies of scale. Not every question requires completely new data fields. If you gathered the demand for question 1, you can use that same bit of data for question 2 (provided you need the same data). You documented it already; you validated it. Now the exercise becomes copy-paste. Of course, both questions require you to keep the data up-to-date; answering two questions even gives that data set more priority to be timely and accurate. Ideally, all data sets you use are timely and accurate all the time, but that is a utopia.
The interesting thing is you will slowly create common data sets for the company, shaping and logging the way data fields are named and how they are filled in. You can create, as a byproduct of actionable intelligence, “master data.”
Master data is “reference data about an organization's core business entities. These entities include people (customers, vendors, employees), things (assets, products, ledgers), and places (countries, cities, locations).1
Take for example data on a sales transaction:
William Smith sold to Teahouse Co. 10 bags of tea leaves for 65 on Jan. 1, 2003.
Now, the separate master data elements used in this transaction are the salesperson (William Smith), the customer (Teahouse Co.), and the product (tea leaves). Each of these elements was listed in master data, to be used and reused time and time again.
So, as a byproduct, what good is master data to you and me? I'll make a clear distinction between byproduct and waste, because, as opposed to waste, having master data and taking it seriously has some major benefits:
- More accurate and trusted data. If everyone uses the same master data, errors will be spotted more quickly. Graduating from the tactic of a data dictionary to implementing a full master data strategy provides a fast, stable foundation for future intelligence work.
- Data consistency. Master-data management at the enterprise level ensures there will be only one definition for each business term. This does not automatically mean one source of truth or one source of data that renders all other sources obsolete. Businesses need one set of definitions for their business terms, but they can have multiple sources of data.
By applying master-data management as a technique to structure your actionable intelligence efforts, you can achieve more ease of use and fewer errors in the business. You will basically (re)create the data infrastructure of the company, shaping its very existence. All that, just by delivering actionable intelligence. Remember: start with the basics! Master-data management will naturally follow.
Data Management Issues in the Spotlight
Lacking the ability to check on data automatically, companies have become big data checking teams. According to an Oracle survey of its customers across six different industries, “less than 15 percent of organizations surveyed understand the sources and quality of their master data and have a roadmap to address missing data domains.”2
In addition, it is unlikely there is a process to improve the situation nor is there a scorecard to monitor and evaluate the upstream data entry quality because it's hard to implement and costs money.
So what are some of the best practices to follow initially?
- Establish a senior management meeting to review the data quality of your most strategic questions. Remember, this doesn't mean addressing all the data—focus, focus, focus on the critical elements.
- When the quality isn't up to expectations, know who the data owners are and have them fix it ASAP. There can often be multiple owners because products and services are enriched throughout their lifetimes.
- Engage the business units and business owners to designate problem solvers who are regularly sharing best practices and acting as a first line of defense support with the users who are actually entering information at their desks, in the field, in the warehouse, and so forth.
- What should be on a senior management scorecard?
- Go back to the strategic question!
- Ours were:
- How can we reduce inventory?
- How can we improve service?
A root concern of these questions for master data was, “Are we enriching our master data within the time frame needed to purchase, manufacture, and ship our new products?” So the list of KPIs in Table 3.1 monitored the product data status throughout its life.
Table 3.1 Example of Key Performance Indicators for Master Data
| KPI Name | Detailed Definition | Business Owner |
| Forecast $'s for incomplete bills of materials | 12-month dollarized forecast for finished goods where the BOM is incomplete within eight weeks of shipping date. | Packaging Operations, Industrial Engineering, Planning |
| # of products with incomplete coding within eight weeks of shipping | The number of finished goods where the BOM is incomplete within eight weeks of plant ship date. | Packaging Operations, Industrial Engineering, Planning |
| Cycle time to complete product coding | Time from code creation to code complete. | Lead Data Stewards and Plant Local Stewards |
| # of codes completed per month | The number of codes (finished goods, work in progress, raw materials) completed. | Lead Data Stewards and Plant Local Stewards |
| Number of codes costed by finance per month | The number of codes that are successfully costed for the given month. | Cost Accounting |
| % of codes costed | Tracks the % total codes eligible for costing. | Cost Accounting |
Look at a key point—the very first KPI is monetized! How many dollars are impacted by incomplete bills of material? This number woke senior management up right at the beginning of our data review meeting.
Organizationally, you should nominate a single person to be responsible for each step in your business process.
If the business was a hotel like my favorite, the Grand Hyatt in Singapore, the manager would have a data steward for:
- Marketing and pricing
- Facilities and rooms
- Guest check in/out
- Payment and collections
Or for manufacturing you might have a data steward for:
- Concept and R&D
- Planning
- Make
- Sourcing
- Delivering
- Returns/corporate sales
Senior management is accountable for data quality. In most countries senior managers sign the auditor statements attesting to the accuracy of their books and records. The execution of data quality should be managed and reviewed at least monthly with the above concepts.
The Data Supply Chain
As you pull information together following these four steps, you'll begin to see how data flows in your company. Donald Farmer calls it the “information supply chain.”
As shown in Figure 3.6, you can follow your critical data elements through and see their data quality in each stage to ensure the right intelligence delivers the right decisions.

Figure 3.6 Example of Key Performance Indicators for Master Data
Mapping the data supply chain provides a solid foundation for an actionable intelligence project. It answers the key questions of where is the data, how often is it refreshed, what can we do to trust it, and what's its intrinsic value.
Build the House
Data is an important asset, and your project will be built completely on the data you choose to use. So it is your responsibility to ensure that you have all the data, that the data is timely and accurate, and that your data acquisition is well-documented so you can do it again. You have the power to guide the project to victory, but that power lies not solely in the visualization. The process starts at the foundation.
When you have the strategic business question and you have the data to answer the question, what's left? The answer, of course! And in order to get to that step, you need to visualize the data with a tool. Then you can apply business discovery to delve through the data with ease and simplicity. So follow the right approach to find the answers to your question!