CHAPTER 15
Visualizing Value
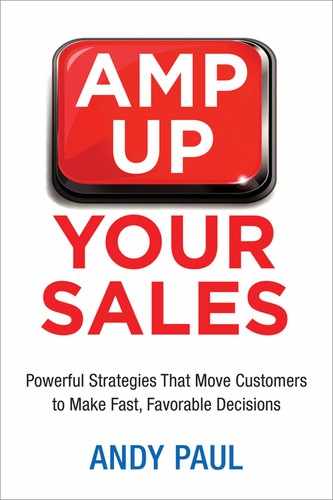
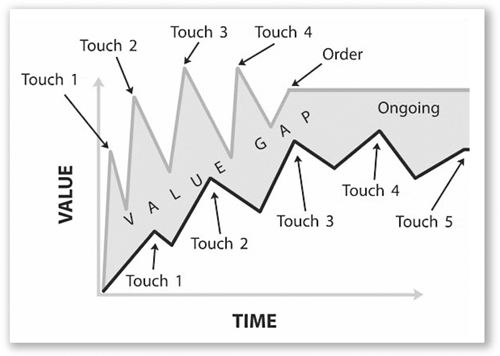
The best way to learn about maximum value selling is to see what it looks like. Figure 15-1 is a generic sales process. The horizontal x-axis, TIME, measures the duration of the sales process and all the individual sales touches. The vertical y-axis, VALUE, measures the value received by the customer during each step in that process.
First, note how each little peak in the process signifies a touch, or a customer interaction. It is represented as a peak because the value that you can deliver occurs during a sales interaction. When you are not in front of the customer, either in person or virtually, there will be an inevitable drop in value. After all, what is the first thing customers do once you leave their office? They start forgetting about you—until your next interaction with them.
Which brings us to the next characteristic of the sales process. If you are effectively providing or creating value during your interactions, then there should be a gradual buildup of residual value throughout the length of your sales process. That is why the ending point of your process is higher than the starting point, which occurs prior to your first interaction with the customer.
I am often asked why the last touch, usually receiving an order, is lower in perceived value than the other touches throughout the process. It’s because, in most cases, the customer makes the decision without the salesperson being present. It’s why the trope of closing an order is one of the biggest fallacies in selling. In the B2B space, very rarely are salespeople in the room when the customer makes the final decision about which product to buy. If the salesperson isn’t present, then value can’t be delivered. Thus, the closing touch is lower.
Lastly, as you can see, the sales process extends beyond the closing. This is your ongoing postsales account management and customer support. If customers have questions after giving you the order, you need to be as responsive as if you were still working to earn their business. That’s because any interactions in this phase of the sales process are actually the first sales calls for your next order from the customer.
Now let’s take a look at what a typical competitive process looks like. As I described in Chapter 1, we’re all working in an increasingly challenging business environment where the number of competitors in each segment is quickly rising, where it is difficult to establish and maintain any meaningful product differentiation, and where all vendors essentially look alike to the customer. Earlier in this book, when I provided strategies to create tangible differentiation in your selling, it was to overcome this very problem.
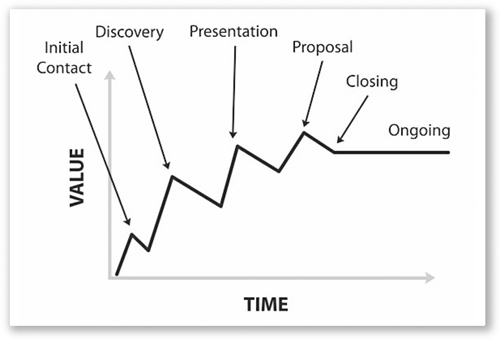
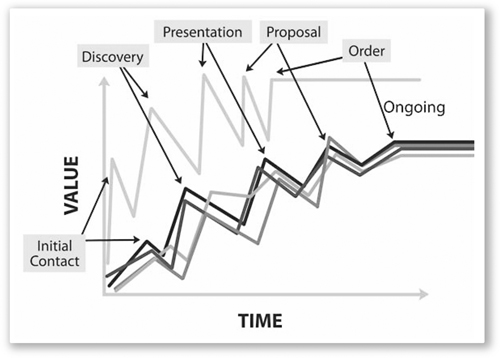
Unfortunately, most salespeople are not differentiating their selling either in the value they deliver or in their responsiveness to the customer. Figure 15-2 shows a typical competitive sales process with four vendors. Each goes through roughly the same steps to provide roughly the same information to the prospect. As you can see, the various threads are often bunched on top of one another. If you were the prospect, would you be able to distinguish one seller from the other, or would it all sound like white noise?
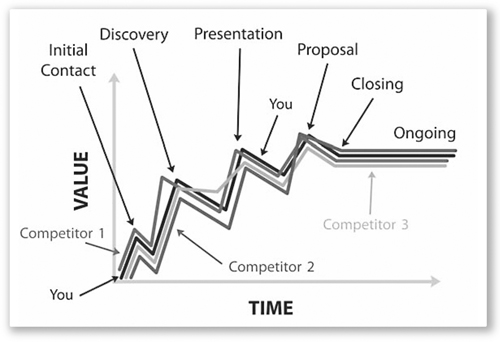
Most of us are familiar with white noise. I remember watching TV as a kid, before we had cable, when the channels would go off the air at some prescribed time in the middle of the night. If you turned on the TV, all you’d see and hear would be a flickering screen flecked with random bits of black and white and a somewhat harsh staticky noise. That nonspecific sound was white noise.
Figure 15-3 shows a graph of white noise side by side with your competitive sales process. Kind of eerie, how similar they are, isn’t it? Insomniacs buy white noise machines that generate soothing, nonidentifiable sounds to lull them to sleep. It’s ironic that a pack of undifferentiated salespeople can have the same effect on a customer.
When your customers hear white noise, it means that they are not being given the information that will help them choose one vendor over another. This often leads to the customer’s making the dreaded no-decision decision: “We didn’t get what we needed from any of the vendors. So we’re just going to hold off on this decision for a bit.” To prevent putting your customers to sleep, you need to step up your game and create some true differentiation throughout your selling process (and the customer’s buying process.)
Consider this process from the customer’s point of view. As described in previous chapters, customers want to make decisions faster and at a lower cost. A study published in 2013 by IDC surveyed executives in companies in the IT industry and found that they wanted to make buying decisions 40 percent faster! That is a significant fraction of time to lop off their buying process. Some of the time savings will necessarily come from improved internal buying processes. But the bulk of the time they’d like to save has to come from the sell side.
So let’s take our standard sales process graph and see what happens when we compress it by 40 percent. In Figure 15-4, you can see the compressed buying process that your customers want. For comparison purposes, I’ve laid it on top of the standard sales process. The upper track is what customers want and need from salespeople. They need each touch, each interaction with a salesperson, to provide more value, and they need all the value delivered over a shorter period of time.

Look at the graph, and measure the distance between the peak for the upper track and the lower track for the first sales touch. That is called the Value Gap (Figure 15-5). The Value Gap is the difference in value received by the customer between Touch 1 on the upper track and Touch 1 on the lower track. Look at this as a competitive sales situation, where you are on the upper track and your most challenging competitors are on the lower track.
Next, in Figure 15-6, you have risen above the noise created by your competitors and opened this Value Gap starting with the very first interaction. The Value Gap is comprised primarily of the more complete and timely information you have provided that customers need to move forward with making a decision. It includes the unique insights that you have provided that helped to perfect customers’ vision of the solution that will meet their requirements. Just as important, it contains the elevated levels of trust, credibility, and confidence that the customer has in you, based on your continued focus on responsiveness and value.
For instance, let’s assume that Touch 1 was responding to a sales lead. The salesperson on the upper track responded within an hour, asked effective discovery questions, and scheduled a follow-on call to demonstrate her system. The salesperson on the lower track took two days to respond to the lead with a phone call (which, unfortunately, is pretty average). He opened the call with the typical top-of-the-funnel look-at-me sales presentation and eventually got around to asking about the customer and his requirements. The customer ended the call without committing to a next call. “Give me a couple of days to digest this. I’ll get back to you.” What’s in the Value Gap? Information, trust, credibility, and confidence that you won’t waste the customer’s time.
I have three action items for you before we move on to the next chapter.
First, I want you to go back and look at the standard sales process in Figure 15-2. Think back to Chapter 11 and our discussion about the customer’s motivations in decision making: faster and at lower cost. What would your process look like if you took the necessary steps to meet the customer’s requirements for faster decision making? You would attempt to increase the value of each interaction, and you would attempt to deliver the value that the customer needed to make their decision in less time. What would your selling cycle look like then? It would look just like the upper track in Figure 15-4. This is the Maximum Value Selling track. And it is perfectly aligned with the preferred buying process of your customer. This is not an accident.
Second, develop your own sales process graphs. When you sit down to plan any sales interaction (in-person call, phone call, video chat, e-mail, text, Tweet), map it out on the graph. Ask yourself these questions:
![]() What is the goal of this sales interaction (as defined by the value you will deliver)?
What is the goal of this sales interaction (as defined by the value you will deliver)?
![]() Is this the maximum value I can deliver during this call/contact?
Is this the maximum value I can deliver during this call/contact?
![]() What is the desired outcome(s) of this interaction?
What is the desired outcome(s) of this interaction?
![]() If I am delivering less than maximum value, what will happen if a competitor delivers the maximum value at the same stage?
If I am delivering less than maximum value, what will happen if a competitor delivers the maximum value at the same stage?
Third, graph what your selling process looked like for the last deal you lost. How many touches of all types were there? “What was the relative value that each delivered? What was the relative length of time between each one? Then map in the track of the competitor that won the deal. Where were the Value Gaps that you fell into?