
Chapter 8
BANK LIQUIDITY RISK MANAGEMENT
The Western World’s banking system was – in some jurisdictions at least – on the brink of collapse in September and October 2008, in the wake of the Lehman bankruptcy. Intervention by governments, which in some cases extended to a blanket guarantee of banks’ complete liabilities, prevented this collapse from taking place. In the aftermath of the crisis, national regulators and the Bank for International Settlements (BIS) circulated consultative papers and recommendations that addressed new requirements on bank capital, liquidity and risk management. The UK’s Financial Services Authority (FSA) was perhaps the most demanding; in its Policy Statement 09/16, which was issued in October 2009, it outlined measures on capital treatment, liquidity requirements and stress-testing that implied a fundamental change in the bank’s business model going forward.
In this and the next chapter, we discuss the implications for banks of the new emphasis on risk management by the regulators and the BIS committee – this was the committee that issued the ‘Basel III’ rules in September 2010 for implementation from 2015 onwards. We also provide our own recommendations on how banks can go about meeting these requirements in a way that generates sustained return on capital. This chapter looks at the fundamentals of liquidity risk management, and what its basic principles need to be in the light of current central bank and regulatory requirements. In the following chapter, we consider the implications of these changes for the basic banking model.
The liquidity policy statement
Business best practice dictates that a bank formally documents its liquidity policy. This will articulate the bank’s approach to and appetite for liquidity risk, the actions it should follow to maintain liquidity safety and the contingent actions to follow in the event of stressed conditions in the financial markets. We provide a template for bank liquidity policy here with a series of illustrations. They are self-explanatory and applicable to a conventional medium-sized commercial bank.
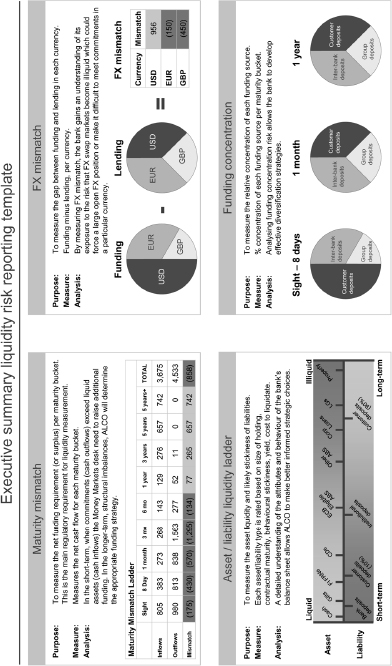
The basic principles of the policy statement are shown in Figures 8.1 to 8.6. Figure 8.4 shows the alternative actions that can be taken in the event of liquidity stress. Figure 8.6 is the summary liquidity-risk-reporting template.
Figure 8.1 Liquidity policy statement: basic framework.
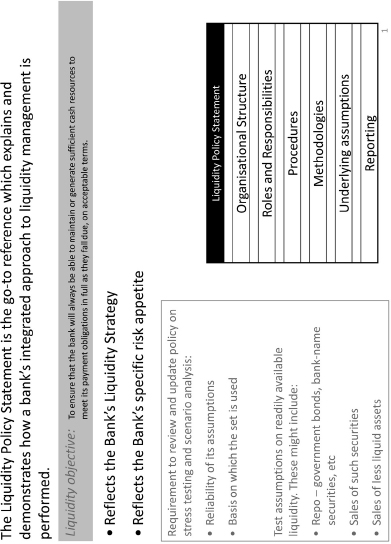
Figure 8.2 Liquidity policy statement: appetite for liquidity risk.
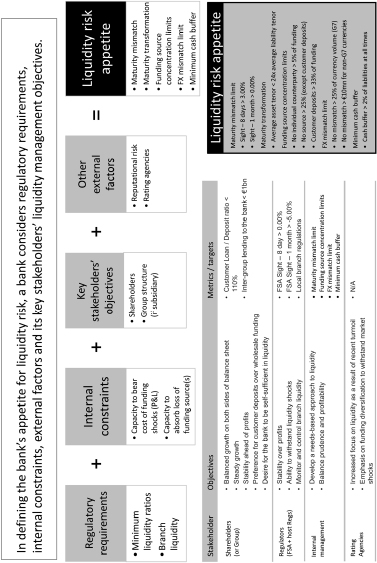
Figure 8.3 Liquidity policy statement: basic framework.
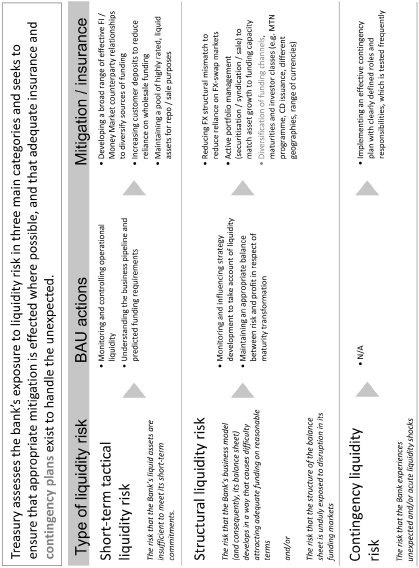
Figure 8.4 Liquidity policy statement: funding options.
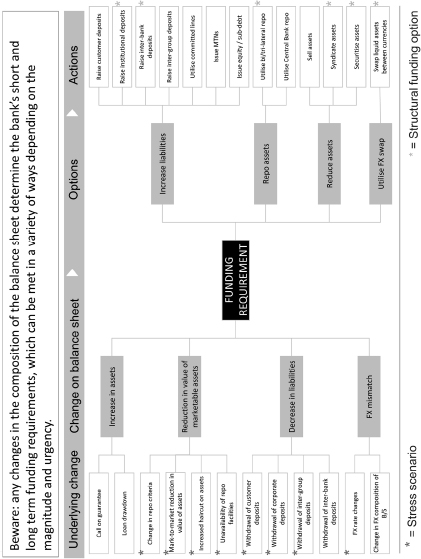
Figure 8.5 Liquidity policy statement: management process.
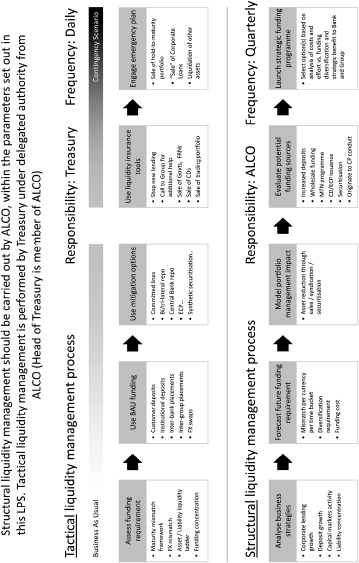
Figure 8.6 Liquidity policy statement: summary M1.
Principles of bank liquidity risk management
At a conference hosted by the UK Financial Services Authority (FSA) on 9 October 2009, there was significant focus given to the model of liquidity management of the HSBC (a UK bank). Given its rarity amongst large Western banks in not suffering a liquidity crisis in 2007–2008, observers commented on the efficacy of the HSBC model, and on what lessons could be learned by banks in general.
In truth, a close look at the HSBC’s approach to liquidity and asset generation shows that it is neither unique nor proprietary to the bank; indeed, a number of other banks such as Standard Chartered Bank follow a similar approach. The ‘HSBC model’ would have been the norm, rather than the exception, amongst banks as recently as 10 or 15 years ago. In an era of excess the basic tenets of the approach were applied by fewer and fewer banks, to the extent that they were no longer seen as an essential ingredient of prudent bank risk management at the time of the 2007–2008 financial crash.
As such these principles represent the basic principles of banking – not a specific response to the events of 2007–2008. They should be taken to be general principles of banking liquidity management, and ones that more banks will re-adopt as they return to a more conservative business model, either through choice or because the requirements of the national banking regulator insist upon a more robust approach to risk management.
This section considers the most important principles of what should be taken as the cornerstone of banking and liquidity management.
(1)Fund illiquid assets with core customer deposits
In hindsight, this looks an eminently sensible guideline but during the bull market buildup of 2001–2007 it was not applied universally. The best example of this was Northern Rock, which built an asset book that far exceeded its retail deposit base in size, but this pattern was observed with many banks in Western Europe. It is not difficult to ascertain the logic behind this principle: core customer deposits are generally more stable than wholesale funds and are also at lower risk of withdrawal in the event of a downturn in economic conditions (an apparent paradox is that they may actually increase as customers seek to deleverage and also hold off committing to cash-rich expenditure). Therefore, funding illiquid assets with core customer deposits is prudent banking practice.
(2) Where core customer deposits are not available, use long-term wholesale funding sources
This follows on naturally from the first principle. Where there is insufficient core deposits available, and banks resort to the wholesale-funding market, banks should ensure that only long-dated wholesale funds are used to fund illiquid assets. Generally, ‘long-dated’ means over 1 year in maturity, although of course the appropriate tenor to source is a function of the maturity of the asset. This approach reduces rollover liquidity risk in the event of a crisis.
(3) No overreliance on wholesale funding. Run a sensible term structure wherever this is used: more funding should be long term (5 years) than short term
This follows on from the primary dictum of not building up the asset base using wholesale funds unless absolutely necessary. Where recourse is made to wholesale funds, as much of this as possible should be long term, so as to minimize exposure to frequent short-term rollover risk to wholesale funds.
(4) Maintain ‘liquidity buffers’ to cater for stresses – both firm-specific stresses and market-wide stresses
The UK FSA published this requirement in its Policy Statement 09/16 in October 2009. However, only 10 or 15 years ago it was quite common for banks to hold some of their assets in the form of liquid risk-free government bonds. Traditionally, a bank’s capital was always invested in such securities or in shorter dated government bills, but beyond this it was accepted good practice for banks to have a proportion of their balance sheet assets in sovereign securities. For the FSA to make it a requirement under law demonstrates the extent to which this practice has fallen into disuse.
It is evident that banks reduced their holdings of government bonds so they could deploy more of their funds in higher paying risky assets. But, the logic of holding a liquidity buffer is irrefutable: in periods of stress or illiquidity, government bonds are the only assets that remain liquid. As such, they can be sold to release liquidity if need be. Even hitherto highly liquid assets such as high-rated bank CDs or short-dated MTNs became illiquid virtually overnight in the immediate aftermath of the Lehman collapse in 2008. This demonstrates that the liquidity buffer should only be comprised of sovereign risk-free securities.
(5) Establish a liquidity contingency plan
A well-managed liquidity operation recognizes that bank funding should be sourced from multiple origins, and that ‘concentration risk’ should be avoided both in any specific sector and any single lender. However, even without excess concentration, at any time particular sectors or lenders may become unavailable for either exogenous or endogenous reasons.
Given this risk, banks needs to have contingencies to fall back on whenever particular sources of funding dry up. This may include applying for and setting up facilities at the central bank, or establishing relationships with particular sectors that, for reasons of cost or convenience, the bank does not customarily access. The contingency plan needs to be tested regularly and kept updated.
(6) Know what central bank facilities the bank can access and test that it really can gain access to them
This follows logically from the requirement to have a contingency funding plan in place. Once a bank has established borrowing facilities at its central bank, it needs to be aware exactly how they function and what the requirements to access them are, so that if necessary it can benefit from them without delay.
(7) Be aware of all the bank’s exposures (on the liability side – not the credit side). For example, sponsoring an asset-backed commercial paper (ABCP) conduit creates a reputational, rather than contractual, obligation to provide funding. Therefore, be wary of reputational obligations, especially if it means the bank has to lend its name to another entity
This is fairly straightforward to understand, but in a bull market when credit spreads are tight it is frequently forgotten. Banks may desire the fee-based income, at favourable capital levels, that comes with sponsoring a third-party entity or providing a line of liquidity, but in a stress situation that line will be drawn on. Is the bank prepared to take on this additional liquidity risk exposure to an entity that it might not normally, in a bear market, wish to lend funds to?
(8) Liquidity risk is not a single metric. It is an array of metrics, and a bank must calculate them all in order to obtain the most accurate picture of liquidity. This is especially true for multinational banks and/or banks with multiple business lines
Smaller banks often rely on just one or two liquidity indicators such as loan-to-deposit ratio. Given that bank asset–liability management is more an art than a science, it is vital that banks use a range of liquidity measures for risk estimation and forecasting. We will address the different metrics required in the next section.
(9) The internal transfer-pricing framework must be set up correctly and adequately
An artificial internal lending rate to business lines can drive inappropriate business decision-making and was a factor behind the growth in risky assets during the buildup to the US subprime crisis. We address this subject on pp. 252–259.
The business of banking is – if nothing else – the business of managing the gap between assets and liabilities. In the history of banking, banks have never matched their asset maturity with their funding liability maturity. But, it is the management of this gap risk that should be the primary concern of all banks. The basic principles we have discussed above represent business best practice – evolved over centuries of modern banking – in mitigating gap risk.
Measuring bank liquidity risk: key metrics
As we note above, given that bank asset–liability management is as much an art as a science, it is vital that banks use a range of liquidity measures for risk estimation and forecasting. In this section we list seven baseline liquidity metrics which all banks – irrespective of their size or line of business – should adopt and monitor as a matter of course:
- liquidity ratio
- loan-to-deposit ratio
- 1-week and 1-month liquidity ratios
- cumulative liquidity model
- liquidity risk factor
- concentration report
- inter-entity lending report.
These reports measure and illustrate different elements of liquidity risk. For consolidated or group banking entities, reports must be at the country level, legal entity level and group level. Taken together, on aggregate the reports provide detail on
- the exposure of the bank to funding rollover or ‘gap’ risk;
- the daily funding requirement, and what it is likely to be at a forward date;
- the extent of ‘self-sufficiency’ of a branch or subsidiary.
Liquidity reports also help in providing early warning of any likely funding stress points. Let us examine them individually.
Liquidity ratio
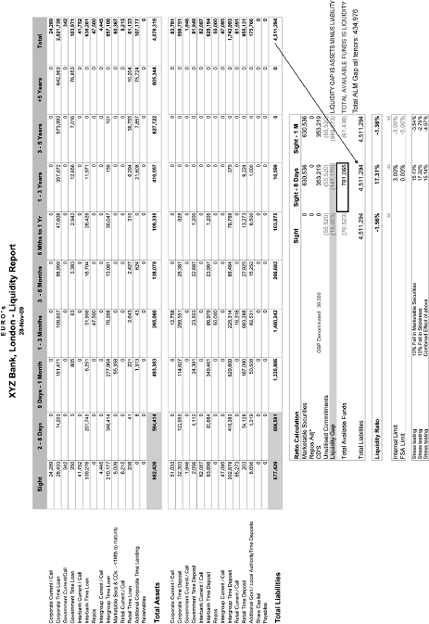
A bank’s liquidity ratio is the basic asset–liability gap ratio. A liquidity report for a commercial bank is shown in Figure 8.7.
Figure 8.7 Bank liquidity report showing 8-day and 1-month liquidity ratios.
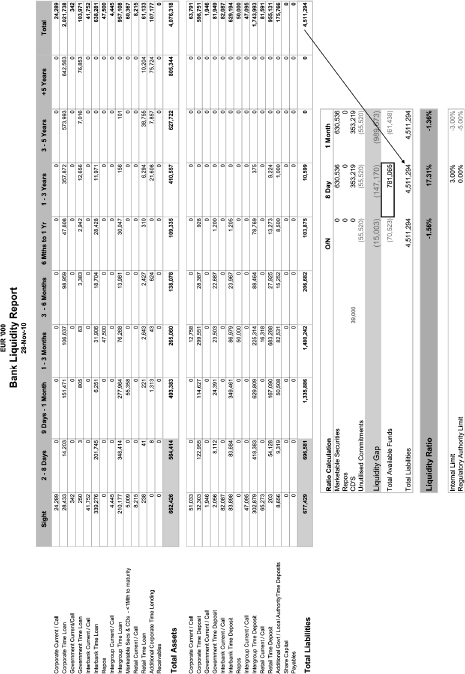
The liquidity gap value shown in the report is made up of the assets minus the liabilities of each tenor bucket. The ‘total available funds’ number is the liquidity gap, plus ‘marketable securities’ such as government bonds, bank bonds, CDs, minus any committed facilities that are as yet undrawn. The liquidity ratio calculation itself is the ‘total available funds’ value, which is 781,065 for the 8-day bucket and 61,438 for the 30-day bucket, divided by the ‘total liabilities’ value which is 4,511,294. This gives ratios of 17.31% and 13.6% for the two buckets, respectively, which are above the bank regulators’ limits of 0.00% and 5.00%. In the case of this bank, the liquidity ratios must not fall below these limits.
Note that it is the ‘liquidity gap’ element that drives the 30-day ratio to a lower level than the 8-day ratio. In other words, the bigger the gap the lower the ratio; this is why regulators place limits on liquidity ratios such that banks are required to maintain asset–liability gaps at manageable levels.
Loan-to-deposit ratio (LTD)
This is a standard and commonly used metric, typically reported monthly. It measures the relationship between lending and customer deposits, and is a measure of the self-sustainability of the bank (or the branch or subsidiary). A level above 100% is an early warning sign of excessive asset growth; of course, a level below 70% implies excessive liquidity and implies a potentially inadequate return on funds.
The LTD ratio is a good measure of the contribution of customer funding to the bank’s overall funding; however, it is not predictive and does not account for the tenor, concentration and volatility of funds. As such it is insufficient as a liquidity risk measure on its own and must be used in conjunction with other measures.
1-week and 1-month liquidity ratios
Both the 1-week and 1-month liquidity ratios are standard liquidity ratios that are commonly measured against a regulatory limit. An example of a report for a group-type entity comprised of four subsidiaries is shown in Table 8.1.
Table 8.1 Sample liquidity ratio report
Liquidity ratios are an essential measure of ‘gap’ risk. They show net cash flows – including the cash effect of liquidating ‘liquid’ securities – as a percentage of liabilities for a specific maturity bucket. They are an effective measure of structural liquidity, with early warning of likely stress points.
A more detailed liquidity ratio report is shown in Figure 8.8. This shows the breakdown of cash inflows and outflows per time bucket, as well as the liquidity ratio. The ratio itself is calculated by dividing the selected time bucket liability by cumulative liability. So, in this example the 30-day ratio of 17.3% is given by the fraction ![]()
Figure 8.8 Liquidity report and liquidity ratio calculation.
Cumulative liquidity model
The cumulative liquidity model is an extension of the liquidity ratio report and is a forward-looking model of inflows, outflows and available liquidity, accumulated for a 12-month period. It recognizes and predicts liquidity stress points on a cash basis. A report such as this – just like liquidity ratios – will be prepared daily at the legal entity level and group level.
Figure 8.9 is an example of a cumulative outflow output graph rising from the cumulative liquidity model. It gives a snapshot view of forward-funding stress points.
Figure 8.9 Cumulative liquidity model.

Liquidity risk factor (LRF)
This measure shows the aggregate size of the liquidity gap: it compares the average tenor of assets with that of liabilities. It is also known as a `maturity transformation report’. The ratio can be calculated using years or days, as desired. For example, Table 8.2 is an example of the risk factor for a hypothetical bank, where the unit of measurement is days. In this example, 262/19 is slightly below 14.
Table 8.2 Liquidity risk factor
![]()
The higher the LRF, the larger the liquidity gap and the greater the liquidity risk It is important to observe the trend over time and any change to long-run averages, so as to get early warning of the buildup of a potentially unsustainable funding structure.
Concentration report and funding source report
The concentration report and funding source report show the extent of reliance on single sources of funds. An excess concentration to any one lender, sector or country is an early warning sign of potential stress points in the event of a crash.
An example of a concentration report is shown in Table 8.3. In this table, Customer 1 is clearly the focus of a potential stress point, and a bank would need to build in some contingency in the event that this source of funds dries up.
Table 8.3 Large depositors as percentage of total funding report
A related report is the funding source report, an example of which is shown in Table 8.4.
Table 8.4 Funding source report
This is a summary of the share of funding obtained from all the various sources, and should be used to flag potential concentration risk by sector.
Inter-entity lending report
The inter-entity lending report is relevant for group and consolidated banking entities. As intra-group lending is common in banking entities, this report is a valuable tool used to determine how reliant a specific banking subsidiary is on group funds. An example of such a report is shown in Table 8.5.
Table 8.5 Sample inter-company lending report
We have described the range of reports that represent essential metrics in the measurement of liquidity risk. They are the minimum management information (MI) that banks and group treasuries will wish to prepare, both as business best practice and as part of adherence to new regulatory standards.
Summary liquidity report
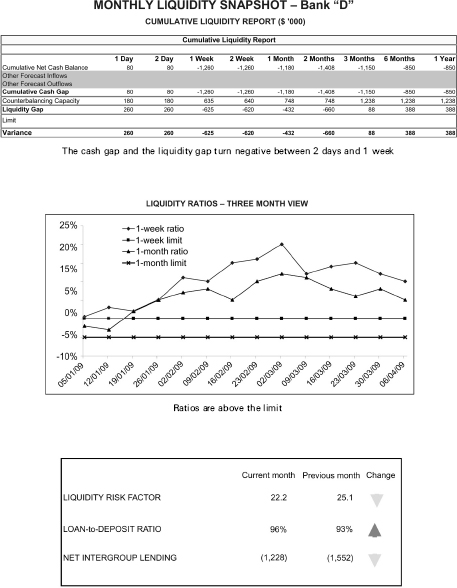
For executive summary reporting to senior management, a bank may provide a one-sided report of the main liquidity metrics. An example of this is shown in Figure 8.10.
Figure 8.10 Summary liquidity snapshot.
Internal funding rate policy
We define liquidity risk as the risk of being unable to (i) raise funds to meet payment obligations as they fall due and (ii) fund an increase in assets. Funding risk is the risk of being unable to borrow funds in the market. The UK regulatory authority, the Financial Services Authority, has prescribed a mechanism to mitigate liquidity and funding risk that is notable for its focus on the type, tenor, source and availability of funding, exercised under normal and stressed market conditions.1
This emphasis on liquidity is correct and an example of a return to the roots of banking, when liquidity management was paramount. While capital ratios are a necessary part of bank risk management, they are not sufficient. Northern Rock and Bradford & Bingley were more a failure of liquidity management than capital erosion. Hence, it is not surprising that there is now a strong focus on extraneous considerations to funding.
However, the use of such funding within banks, including the price at which cash is internally lent or transferred to business lines, has not been as closely scrutinized by the FSA. This issue needs to be addressed by regulators because it is a driver of bank business models, which were shown to be flawed and based on inaccurate assumptions during 2007–2008.
An effective internal funding framework
While the FSA does touch on bank internal liquidity pricing,2 the coverage is peripheral. This is unfortunate because it is a key element driving a bank’s business model. Essentially, the price at which an individual bank business line raises funding from its Treasury desk is a major parameter in business decision-making, driving sales, asset allocation, and product pricing. It is also a key hurdle rate behind the product approval process and an individual business line’s performance measurement. Just as capital allocation decisions affecting front-office business units need to account for the cost of that capital (in terms of return on regulatory and economic capital), so funding decisions exercised by corporate treasurers carry significant implications for sales and trading teams at the trade level.
In an ideal world, the price at which cash is internally transferred within a bank should reflect the true economic cost of that cash (at each maturity band) and its impact on overall bank liquidity. This would ensure that each business aligns the commercial propensity to maximize profit with the correct maturity profile of associated funding. From a liquidity point of view, any mismatch between the asset tenor and funding tenor, after taking into account the `repoability’ of each asset class in question, should be highlighted and acted upon as a matter of priority, with the objective to reduce recourse to short-term, passive funding as much as possible. Equally, it is important that the internal funding framework is transparent to all trading groups.
A measure of discipline in business decision-making is enforced via the imposition of minimum return-on-capital (ROC) targets. Independent of the internal cost of funds, a business line would ordinarily seek to ensure that any transaction it entered into achieved its targeted ROC. However, relying solely on this measure is not always sufficient. For this to work, each business line should be set ROC levels that are commensurate with its (risk-adjusted) risk–reward profile. However, banks do not always set different target ROCs for each business line, which means that the required discipline breaks down. Second, a uniform cost of funds, even allowing for different ROCs, will mean that the different liquidity stresses created by different types of asset are not addressed adequately at the aggregate funding level.
For example, consider the following asset types:
- a 3-month inter-bank loan
- a 3-year floating rate corporate loan, fixing quarterly
- a 3-year floating rate corporate loan, fixing weekly
- a 3-year fixed rate loan
- a 10-year floating rate corporate loan, fixing monthly
- a 15-year floating rate project finance loan, fixing quarterly.
These asset types have been deliberately chosen to demonstrate the different liquidity pressures that each places on the Treasury funding desk (listed in increasing amount of funding rollover risk). Even allowing for different credit risk exposures and capital risk weights, the impact on the liability funding desk is different for each asset; hence, the importance of applying a structurally sound transfer-pricing policy, dependent on the type of business line being funded.
Cost of funds
As a key driver of the economic decision-making process, the cost at which funds are lent from the central Treasury to a bank’s business lines needs to be set at a rate that reflects the true liquidity risk position of each business line. If it is unrealistic, there is a risk that transactions are entered into that produce an unrealistic profit. This profit will reflect an artificial funding gain, rather than the true economic value-added of the business.
There is empirical evidence of the damage that can be caused by artificially low transfer pricing. In a working paper from 2008, #Adrian Blundell-Wignall and Paul Atkinson3 discuss the losses at UBS in its structured credit business, which originated collateralized debt obligations (CDOs) and invested in them. On p. 97 of their paper they quote a UBS shareholder report,
‘ … internal bid prices were always higher than the relevant London inter-bank bid rate (LIBID) and internal offer prices were always lower than relevant London inter-bank offered rate (LIBOR).’
In other words, UBS’ structured credit business was able to fund itself at prices better than in the market (which is implicitly inter-bank risk), despite the fact that it was investing in assets of considerably lower liquidity (and credit quality) than inter-bank risk. There was no adjustment for tenor mismatch – to better align term funding to liquidity. A more realistic funding model was viewed as a ‘constraint on the growth strategy’.
This lack of funding discipline undoubtedly played an important role in the decision-making process because it allowed the desk to report inflated profits based on low funding costs. As a stand-alone business, a CDO investor would not expect to raise funds at sub-Libor, but rather at significantly over Libor. By receiving artificially low pricing, the desk could report super profits and very high ROC, which encouraged increasingly risky investment decisions.
Another example involved banks that entered into the ‘fund derivatives’ business. This was lending to investors in hedge funds via a leveraged structured product. These instruments were illiquid, with maturities of 2 years or longer. Once dealt, they could not be unwound, thus creating significant liquidity stress for the lender. However, banks funded these business lines from the central Treasury at Libor flat, rolling over the short term. The liquidity problems that resulted became apparent during the 2007–2008 financial crisis, when inter-bank liquidity dried up.
Many banks operate on a similar model, with a fixed internal funding rate of Libor plus, say, 15 bp for all business lines and for any tenor. But, such an approach does not take into account the differing risk–reward and liquidity profiles of the businesses. The corporate lending desk creates different liquidity risk exposures for the bank compared with the CDO desk or the project finance desk. For the most efficient capital allocation, banks should adjust the basic internal transfer price for the resulting liquidity risk exposure of the business. Otherwise, they run the risk of excessive risk-taking heavily influenced by artificial funding gains.
Business best practice
It is important that the regulatory authorities review the internal funding structure in place at the banks they supervise. An artificially low funding rate can create as much potentially unmanageable risk exposure as a risk-seeking loan origination culture. A regulatory requirement to impose a realistic internal funding arrangement will mitigate this risk. We recommend the following approach:
- a fixed add-on spread over Libor for term loans or assets over a certain maturity – say, one year, where coupon refix is frequent (such as weekly or monthly) – to compensate for liquidity mismatch. The spread would be on a sliding scale for longer term assets.
Internal funding discipline is as pertinent to bank risk management as capital buffers and effective liquidity management discipline. As banks adjust to the new liquidity requirements soon to be imposed by the FSA, it is worthwhile for them to look beyond the literal scope of the new supervisory fiat and consider the internal determinants of an efficient, cost-effective funding regime. In this way they can move towards the heart of this proposition, which is to embed true funding cost into business line decision-making.
Funds transfer-pricing policy: liquidity premium framework
This policy framework has been introduced to better reflect the usage and provision of funds that flow through the Treasury as a result of the business undertaken by individual bank business lines (SBUs). It is meant to be reflective of market conditions and is separate from any Treasury margin that may be applied.
It is also a requirement of the UK FSA under its Policy Statement 09/16 that the cost of liquidity should be included as part of the internal pricing of funds within an entity. We refer to this internal funding rate as the ‘transfer price’ (TP).
TP does not in any way reflect credit spread or credit premium. It is purely a liquidity premium.
Scope
This policy applies to all interest-bearing assets and liabilities on the bank’s balance sheet, effective from 1 January 2010 onwards. It includes
- all interest-bearing assets and liabilities that are ‘live’ – that is, legacy transactions – as at 1 January 2010;
- separate trading desks within the Treasury;
- gross cashflows of each SBU/trading desk – as per existing transfer-pricing rules for interest rate risk, there is no netting allowed by SBUs.
Non-interest-bearing assets and liabilities are covered under a separate policy.
Framework
The TP policy applies equally to both sides of the balance sheet.
Assets
The framework for the pricing of assets is as follows:
- Libor will be used as the basis for funding as per existing transfer pricing rules.
- The final maturity date for assets is to be determined by reference to economic life or legal maturity date whichever is the shorter; economic life, in the case of corporate lending/securities, is to be determined on a case-by-case basis although the legal maturity date is to be used as the default endpoint.
- The framework applies to legacy trades.
- The pricing framework has been set by the Treasury and agreed by the bank’s ALCO as:
Liabilities
The proposed framework for the pricing of liabilities is as follows:
- Libor will be used as the basis for funding as per existing transfer-pricing rules.
- The final maturity date for liabilities is to be determined by reference to economic life or final maturity date whichever is the longer; economic life will be determined with reference to the stickiness rate allowed by the FSA under current reporting rules:
| Corporate deposits | 50% |
| Retail deposits | 60% |
- For the purposes of this framework, deposits that have had stickiness applied will be treated as having an economic life of 1-to-5 years. Stickiness is applied on a portfolio basis.
- The framework applies to legacy trades.
- The pricing framework has been set by the Treasury and agreed by the ALCO as:
Ongoing
On an ongoing basis
- the ALCO is responsible for ensuring that this policy is maintained;
- a review of the pricing framework is to be undertaken by the ALCO every 6 months;
- pricing can be updated more frequently should market conditions require it.
Calculation methodology: the liquidity premium
The TP rate will be reviewed every 6 months to ensure that it is realistic to the market.
There is no universal method to calculate the liquidity premium that should be added to the Libor funding cost.
Methods that have been used include
- the difference between the ASW and CDS of the banks (where this is negative) for each tenor maturity;
- the difference between the funding spread over a bank of the same credit rating;
- a subjective add-on based on what the ALCO believes the bank will pay to raise longer dated funds, separate from the credit risk perception of the bank.
Conclusion
In this chapter we have considered the essential principles of bank liquidity risk management. The events of 2007–2008 serve to re-iterate the importance of sound ALM practice in banks. For this reason it is important that a bank’s ALCO be set up as an effective management entity and be empowered to ensure correct business practice for asset–liability management. The framework set out in this chapter can be viewed as a best endeavours approach to operation of the ALCO function at a bank.
1 FSA, Policy Statement 09/16, October 2009.
2 See p. 23, FSA CP 08/22, Strengthening Liquidity Standards, December 2008.
3 Blundell-Wignall, A., and Atkinson, P. (2008) ‘The sub-prime crisis: Causal distortions and regulatory reform,’ working paper, OECD, July.