
5.3. Using LabWindows/CVI to Interface with ANSI C
Measurement Studio bridges the gap between standard software development tools and LabView Virtual Instrumentation for test, measurement, and automation applications. You can choose from standard environments such as LabWindows/CVI for ANSI C, Measurement Studio for Microsoft Visual Basic, and Visual C++ to create your application, using tools specific for each language. With Measurement Studio, you can write programs quickly and easily and modify them as your needs change. At the same time, you lower your application development costs and decrease your time to market.
5.3.1. Introduction to LabWindows/CVI[*]
[*] Source: Reprinted by permission of National Instruments, Corp. Available: http://sine.ni.com/apps/we/nioc.vp?cid=11104&lang=US, http://amp.ni.com/niwc/cvi/what_is.jsp?node=11104, http://amp.ni/com/niwc/cvi/building_appl.jsp?node=11104, and http://sine.ni.com/apps/we/nioc.vp?cid=11107&lang=US
LabWindows/CVI is designed as a complete ANSI C development environment for creating virtual instrumentation applications with built-in libraries for acquisition, analysis, and visualization. LabWindows/CVI provides a simplified drag-and-drop user interface editor and automated code generation tools that you can use to interactively test code before adding it to your project. With LabWindows/CVI, you can create localized user interfaces, work with ActiveX servers, and create multi-threaded applications. LabWindows/CVI delivers a complete measurement and automation development environment with its many powerful features and the standard C programming language.
The integrated LabWindows/CVI environment features code generation tools and prototyping utilities for fast and easy C code development. It offers a unique, interactive ANSI C approach that delivers access to the full power of C with the ease of use of Visual Basic. Because LabWindows/CVI is a programming environment for developing measurement applications, it includes a large set of run-time libraries for instrument control, data acquisition, analysis, and user interface. LabWindows/CVI also contains many features that make developing measurement applications much easier than developing in traditional C environments.
Designed for building high-performance systems, LabWindows/CVI offers the following:
ANSI C execution speed
Small, fast executable building and distribution
Multi-threaded application development and debugging
Faster, easier C development
Drag-and-drop user interface development
Automatic code generation tools
Rapid application development process
Easy design for test engineers
Built-in instrumentation libraries (GPIB, DAQ, analysis, and more)
Instrumentation-based user interface controls (graphs, knobs, and more)
Interactive execution
Instrument drivers
Code reusability
ANSI C-compatible environment
DLL, OBJ, and LIB integration
5.3.1.1. Easy to Learn and Easy to Use
LabWindows/CVI provides an easy-to-learn and easy-to-use development environment. Educating or standardizing developers or engineers on LabWindows/CVI requires little time and effort. LabWindows/CVI interfaces with many source code control utilities, including Visual Source Safe and Perforce, thereby providing engineers the ability to share source files between team members. LabWindows/CVI also includes tools for sharing libraries and applications with Visual C++.
5.3.1.2. Program Reusability and Integrated Development Environment
With LabWindows/CVI development tools, you can build PC- and workstation-based virtual instruments quickly and easily. You can share key software components between projects and across departments, from the design labs to the production floor, using industry-standard I/O libraries and multivendor instrument driver libraries.
LabWindows/CVI meets the changing needs of software with an interactive development environment designed for virtual instrumentation. With our development tools, you can quickly create, configure, and display measurements during product design and verification. LabWindows/CVI automates much of the manual coding and compiling. By hiding details found in traditional C development tools, you can focus on the instrumentation aspects of your job. The interactive development environment shortens the learning curve for engineers upgrading Visual Basic systems to C without sacrificing the speed or source code manageability of compiled C code.
5.3.1.3. Application Development
Building an application in LabWindows/CVI begins with the user interface. Use an intuitive GUI editor to interactively design virtual instruments by selecting and placing controls designed specifically for measurement applications onto your panels. Double-click to customize the control's appearance and function to meet your needs. You then generate C source code to display and respond to the controls on your user interface. CodeBuilder creates code that responds to user events, such as mouse clicks, key presses, and menu selections—you just add code to the callback routines.
Complete the application by inserting measurement libraries into the program using simplified code generation tools, called function panels. A function panel is a graphical representation of a LabWindows/CVI function and its parameters. Use function panels to interactively build a function call, then execute the function from the function panel to test its operation, and automatically insert the function call into your source file.
Finally, LabWindows/CVI provides tools to catch common programming mistakes. When you run your LabWindows/CVI program in debug mode, the User Protection feature automatically checks for common programming errors such as writing beyond the end of an array or dereferencing an uninitialized pointer or variable. When such an error occurs, LabWindows/CVI stops the program and points to the offending line of code.
5.3.1.4. Measurement Functionality
LabWindows/CVI provides UI controls such as knobs, switches, sliders, thermometers, graphs, and much more to create a professional, intuitive interface. LabWindows/CVI includes the DataSocket Internet architecture to easily publish information over the Internet or create distributed applications without creating a large amount of network traffic. LabWindows/CVI also includes lower level libraries, such as dynamic data exchange (DDE) and TCP/IP, which help you in both simple and complex data transfer tasks. Because LabWindows/CVI is focused on creating measurement applications, it includes an extensive set of simplified hardware connectivity libraries. With libraries for data acquisition (DAQ), GPIB, serial, VISA, VXI, and IVI, you have many choices for how to perfect your measurement system. Finally, you can complete your measurement system by making your application more useful by integrating inline analysis. Use the LabWindows/CVI Advanced Analysis Library to make calculations that convert your raw measurements into significant results.
5.3.1.5. Instrument Driver
Perhaps the most commonly used and reused component in any test system is the instrument driver. An instrument driver is a software module that acts as a translator between high-level routines that users can easily understand and low-level commands understood by the instrument. Instrument drivers encapsulate the low-level command syntax, communication protocol, and data services required for communicating with and controlling GPIB or VXI test equipment. Therefore, instrument drivers replace the need for you to learn the individual commands and control syntax for each of your instruments. Instead, you simply use high-level functions for initializing, configuring, and acquiring data. Naturally, if you can obtain an instrument driver for each of the instruments in your system, you will experience a much faster, easier, and more productive development effort than programming the instruments yourself at a low level or writing your own drivers from scratch.
The success of the LabWindows/CVI instrument driver model can be attributed to four basic features.
Interactive Execution: LabWindows/CVI is different from general C programming environments in that it presents an interactive execution model to the user. With these interactive capabilities, users can interactively execute any instrument driver functions on the fly, much like a menu-driven application, for debugging and testing efforts with their instruments. For example, when testing a new instrument, users can immediately control it with a LabWindows/CVI instrument driver to verify the GPIB or VXI interface, software installation, and instrument operation. Once the instrument operation is verified, they can then begin working on test programs and systems.
Standard Language: LabWindows/CVI instrument drivers are developed and used from a standard programming language, ANSI C. The widespread acceptance of C, and the thousands of compatible libraries and development utilities designed for the C language, has made it the language of choice for many large-scale test systems. As organizations look to upgrade their older test stands, many of which are designed around one of the many strains of interpreted BASIC, the standardized, compiled ANSI C language has many appealing attributes.
Function Panels: LabWindows/CVI has code-generation tools called function panels that streamline many of the manual coding requirements for using function libraries. A function panel is a graphical representation of a C function call. When users select a library or instrument driver function from a hierarchical list in LabWindows/CVI, it automatically displays a function panel, such as the one shown in Figure 5-3(b) for the Tektronix TDS 300 Series Oscilloscope. The function panel has a control for each parameter in the function call. Users enter values in the controls, and the function panel automatically builds the function call at the bottom of the screen. Function panels that act as an online reference manual for the instrument driver can be accessed through a right mouse-click. Once all of the parameter values have been input, you can execute the function to test its operation and the operation of your instrument. In this example, the function will send a query to the scope, receive the data string back from the scope, parse the string, scale the data points to voltage values, and place the data points in an array variable assigned by the user.
Figure 5-3(b).

Source Code: All LabWindows/CVI instrument drivers are shipped with source code. Users must have source code access for their instrument drivers to be successful for a number of reasons. Most instrument drivers include functions for the majority of the capabilities of the instrument. In some systems, users may wish to remove the code for functions they are not using or optimize certain operations in the driver for their specific applications. In addition, many instrument manufacturers develop families of instruments that share similar command sets. If users have the source code for the driver of one of these instruments, they can quickly and easily modify it to work with the entire family, and new additions to the family as they become available. And finally, if you have an instrument that does not have a driver, you can easily develop a driver by starting with an existing driver for an instrument with similar functionality.
5.3.2. Designing Layers and Structure
There are three steps to using the LabWindows/CVI to develop a test and measurement system that combines ANSI C and virtual instrumentation systems:
- Develop a user interface.
- Develop the source code in ANSI C.
- Connect the function calls in the source code to the instrument drivers in the LabWindows/CVI libraries.
Figure 5-4 shows a layered structure of a program developed by using the LabWindows/CVI tool. The top layer is a user interface developed by using the User Interface Editor tool provided by VI. It is also called a Panel Window. This user interface is very similar to the Form in Visual Basic or the View class in VC++. You can add and modify different controls/components, such as buttons, textboxes, LEDs, binary switches, graphs, and timers, into this Panel Window, which works as an interface between the human (user) and machine (VI) and can receive actions from the user and pass events associated with the actions to the VI system to further process them.
Figure 5-4.

The User Interface, or Panel Window, created by using the User Interface Editor is stored in a file, called the User Interface Resource File and extended by the .uir keyword. When you create a user interface panel and save it as a User Interface Resource File, LabWindows/CVI will automatically create a head file for you (extended with .h), which gives the prototypes and definitions of the controls/components you created in the User Interface Resource File.
The second layer is the source code program skeleton created by using the CodeBuilder tool provided by LabWindows/CVI. CodeBuilder creates an outline or skeleton for your program in ANSI C format, which includes the entry point of your program, main(), and some other functions you define in your program. One point you need to be aware of is that all functions are empty functions; only function prototypes are provided by the CodeBuilder. You need to use the tool in the Function Panel layer to add the functions' body to your program and to connect these functions with the instrument drivers to fulfill the functionality of the different function calls.
The CodeBuilder also creates events associated with some controls/components in the user interface. The controls/components that are associated with the events are command buttons, textboxes, binary switches, and some action-activated controls. During the running of your program, an event will be created and passed to a function that is associated with this event, and the code under that function will be executed to fulfill some functionality based on the event type defined by the CodeBuilder.
This process is very similar to the event procedure in Visual Basic programming, the difference being that it is called a function in LabWindows/CVI applications.
The third layer is the function body created and connected to the instrument drivers by using a Function Panel. The instrument drivers are different function calls to the low-level hardware, or different hardware interfaces to the unit under test. Depending on the different applications, a variety of hardware interfaces is provided by National Instruments, such as the PXI, VXI, DAQ, Serial Port, and Computer-Based Measurement boards. The high-level program or functions, also called callback functions in the LabWindows/CVI environment, must call the instrument drivers to access the hardware interfaces, and furthermore, to access the unit under test.
The functionality of the Function Panel is to create the detailed function body based on the function's prototype created in the second layer and the user's inputs in an interface window, the Function Panel. The Function Panel works just like another user interface to receive the user's selections for the function's definitions, such as the argument type, argument's name, returned data type, and name.
A functionality structure using three layers in LabWindows/CVI to develop a user test project is shown in Figure 5-5.
Figure 5-5.

The program example in this section is developed in the LabWindows/CVI environment and is used to illustrate the development steps and layers of the preceding discussion. The example uses some simulated instrument drivers to give the user a global picture in connection between the different layers in the development of the project. In order to finish the following example, you need to have the LabWindows/CVI software developed by National Instruments Corporation (NIC). You can download the LabWindows/CVI evaluation software from the NIC Web site for evaluation free for 30 days. But some limitations apply to the evaluation version software:
No executable files (.exe or .dll) can be built.
The program can only run for 10 minutes at a time.
Your program will only work for 30 days.
After downloading the software, you can install it on your computer and store it in the default folder cvidemo, which is under your root drive. You should make a shortcut copy for the cvi.exe file and send it to your desktop. Then you only need to double-click this icon to open it when you start your project development.
5.3.3. Design a User Interface
Now, let's develop a sample project named First step by step. Double-click the shortcut to cvi.exe on your desktop to open the LabWindows/CVI software. A default project, Untitled.pri, is displayed. You could use this default project as your project, but we want to create a new project. From the File menu, select the New item, then select the Project (*.prj) submenu item. A new project, Untitled2.prj, is created as shown in Figure 5-6.
Figure 5-6.

5.3.3.1. The User Interface Editor
We use the User Interface Editor to create your user interface or panel window for the First project. From the File menu, select New|User Interface (uir) . . . ; an untitled User Interface Source file, Untitled2.uir, will be opened. Select Create, then click Panel to open a new Panel Window (untitled panel) for your GUI (see Figure 5-7). We can add the controls or components to this Panel Window later to complete your GUI.
Figure 5-7.

5.3.3.2. Add a Command Button on the Panel Window
Next, we add two command buttons to this Panel Window. Select the Create menu, then select Command Buttons and choose the Rounded Command Button for the button style. A command button with a label OK appears on your panel. Move this button to the appropriate location on your panel by using the mouse.
To modify the button's appearance and set the button's functionality, double-click the button. An Edit Command Button dialog box appears, which displays all properties of the button, as shown in Figure 5-8. Five sections are covered in this dialog box.
Source Code Connection
Two textboxes are under this section:
Constant Name: is the button's name that works as a unique ID for this button.
Callback Function: is the name of the function that will be called when the command button is activated (clicked) by the user during the running of your program. This function is equivalent to an event procedure in Visual Basic.
Enter START into the Constant Name: text field as the name for this button, and enter StartAcquireData into the Callback Function: text field as the name of the callback function.
Control Settings
Two textboxes are used under this section:
Control Mode: sets the working mode for this button. It should be set to a different mode based on the control, such as indicator if this control is LED or validate if it is a text field. Keep Hot as the mode for this button.
Initial State: indicates the initial state of the control. It is not a choice for the command button and therefore not activated.
Shortcut Key
Two selections are under this section:
Label Appearance
Label: displays the label for the button.
Enter Start as the label for this button.
Auto Sizing: allows the button's size to be enlarged or contracted based on the label's size.
Select Always Auto Size for this choice. Click the Label Style button to set the size and the appearance for the label. Select size 12, and check the bold checkbox.
Figure 5-8.

Click the OK button at the bottom of the Edit Command Button dialog box to save the properties you set and to close this dialog box.
5.3.3.3. Add a Second Command Button on the Panel Window
As in the previous section, follow similar steps to add a second command button on the panel window. Double-click this newly added button and edit the properties for this button as follows:
| Constant Name: | STOP |
| Callback Function: | StopAcquireData |
| Control Mode: | Hot |
| Modifier Key: | None |
| Key: | No Shortcut Key |
| Label: | Stop |
| Auto Sizing: | Grow only |
Click the Label Style button to set the size and the appearance for the label. Select size 12, and check the bold checkbox. Click the OK button at the bottom of the Edit Command Button dialog box to save the properties you set and to close this dialog box.
5.3.3.4. Add a Graph/Chart Control to the Panel Window
Now, we want to add a graph/chart to display the collected data obtained from a simulated instrument driver. Select the Create menu, and choose the Graph item, then click Strip Chart to add a chart to the panel window. Double-click this chart component to open its Property dialog box as shown in Figure 5-9. There are four edited sections in this dialog box.
Figure 5-9.

Control Settings
Points per Screen: is the total points of the data array. Enter 100 for the number of data points collected.
Scroll Mode: is used to select a different line mode (Continuous, Block, and Sweep). Select the Continuous mode.
Click the X-axis . . . button to set the axis name as TIME.
Click the Y-axis . . . button to set the maximum value for the y data as 2.0.
Click the Traces . . . button to open the Edit Traces dialog box, and enter the data shown in Figure 5-10.
Figure 5-10.

Click the OK button at the bottom of the Edit Strip Chart dialog box to save the properties you set and to close this dialog box.
5.3.3.5. Save the User Interface Resource (.uir) File
The final step in developing a Panel Window is to save your User Interface Resource File. Click File and select Save As to open a Save File As dialog box. Make sure the folder in which you want to save your .uir file, C:cvidemo/tutorial, is highlighted. Enter First as the filename and click the Save button to save your User Interface Resource File as First.uir. Your Panel Window should look like the one shown in Figure 5-11.
Figure 5-11.

When you save your User Interface Resource File, LabWindows/CVI will automatically create a head file (First.h) with a name identical to that of your user interface file, and it will save this head file in the same folder as the .uir file. Your First.h file should look like the one shown in Figure 5-12.
Figure 5-12.

The userint.h is a system head file added by LabWindows/CVI that defines the integer data type. The variables and callback functions defined by your First.uir file, such as PANEL, StartAcquireData, StopAcquireData, and DATAWAVEFORM, are defined here as a sequence of integers, which work as the IDs in your project. The prototypes of two callback functions are generated in this head file, too. The parameters of these callback functions are defined as follows:
int panel indicates which panel this callback function belongs to.
int control indicates which control/component activated this event.
int event indicates the event type.
void *callbackData is a pointer that points to the start address of the data.
int eventData1 and int eventData2 are two additional parameters used in the callback function.
5.3.4. Using the CodeBuilder to Create Your Program Skeleton
When you finish developing the user interface, the next step is to use the CodeBuilder to build source code skeleton for your user interface, the Panel Window. The source code skeleton in the ANSI C format can be automatically generated by CodeBuilder, which supports your First.uir file.
5.3.4.1. Automatic Skeleton Code Generation with CodeBuilder
Currently, you have added three controls/components to your Panel Window: a Start button, Stop button, and the Strip Chart. The functionality of each control is listed as follows:
Click the Start button to activate an event to collect the data from a simulated instrument driver and display the data in the strip chart.
Click the Stop button to activate an event to terminate the data collection and display.
First, we need to create and define two events: one for starting the collection and displaying the data, and another for terminating the task.
To define the event type for your controls, open First.uir if it is not already open. Click Code and select the Preferences|Default Control Events item.
A Control Callback Events dialog box will be opened. There are different event types available for different controls/components in the user interface. For this project, the default type EVENT_COMMIT is used, which means a left-click or <Enter> event is activated. Make sure this default event is checked, as shown in Figure 5-13, and then click the OK button to select it.
Figure 5-13.

Click Code and select Generate|All Code to open the Generate All Code dialog box.
You need to choose one panel as your startup panel, which will be the first panel to be displayed when running your program if you have multiple panels in your program. You should check the Generate WinMain() instead of main() checkbox in the top of the dialog box if you want to first display your Windows-based GUI developed using the Win32 API instead of the panel window you developed in the previous section (which is based on the Windows Console Application).
Because we only have one panel in this sample project, we need to confirm that the panel variable's name is panelHandle and that this variable has been checked. The panel variable's name must be panelHandle, which is a default panel name. Generally you don't need to change this name. A console application is used for this project, so keep the Generate WinMain() instead of main() checkbox unchecked.
For the lower part of this dialog box, which is the Program Termination section, click the StopAcquireData callback function to make it checked. Because the termination of your program can be handled by the system function defined by the LabWindows/CVI, you don't need to input any information (parameters) for this callback function; instead, you just check it and ask the system to end your program.
A QuitUserInterface() function will be added into your program by the CodeBuilder and will be called when you click the Stop button during your program's running.
Your Generate All Code dialog box should like the one shown in Figure 5-14.
Figure 5-14.

Click the OK button to activate the CodeBuilder to generate the skeleton source code for your program, or, to be precise, for your User Interface. A new skeleton source code window will be opened to display your skeleton source code.
Click File in the new skeleton source code window, and select Save to save your source code as the First.c source file.
Your source code window should look like the one shown in Figure 5-15.
Figure 5-15.

5.3.4.2. Take a Close Look at the Skeleton Source Code
The head file cvirte.h is another system head file defined by LabWindows/CVI and is used for handling the external compiler. The prototypes of the callback functions are defined in the First.h file. A static integer, panelHandle, is defined as a global variable at the beginning of your source code, which means that only one copy of this variable is available for your entire project.
Three functions are defined in this source file: main(), StartAcquireData(), and StopAcquireData(). As mentioned before, the main() function is an entry point for your Windows Console Application program (it should be WinMain() if your main program is developed by Win32 API) when your program begins to run. Two callback functions, StartAcquireData() and StopAcquireData(), will be activated by two events when the user clicks the Start and Stop buttons, respectively, during your program's running.
5.3.4.3. The main() Function
The main() function body is shown in Figure 5-16. Two command-line arguments, int argc and char* argv[], can be used to pass some values from the command line when you activate your program.
Figure 5-16.
int main (int argc, char *argv[]) { if (InitCVIRTE (0, argv, 0) == 0) // Needed if linking in external // compiler;harmless otherwise return -1; // out of memory if ((panelHandle = LoadPanel (0, "First.uir", PANEL))<0) return -1; DisplayPanel (panelHandle); RunUserInterface (); return 0; } |
The InitCVIRTE() function is used to link to the external compiler, if it was used.
The LoadPanel() function loads the Panel Window based on the First.uir file into your memory.
The first argument is used to indicate the parent panel if you have multiple-level panels, for example, a parent panel and several child panels. 0 means that the current panel is the parent panel.
The second argument is a string that indicates the name of the User Interface Resource File. In our case, it is First.uir.
The third argument is the panel's ID. Its value is 1 in our case.
If the LoadPanel() function is successfully called, it returns a valid panel handle (whose value is greater than zero) and assigns this handle to the variable panelHandle. Otherwise, its returned value is smaller than zero.
The DisplayPanel() function is used to display a panel with a valid panel handle. In our case, it is panelHandle obtained from the LoadPanel() function.
The RunUserInterface() function is used to activate the panel and to be ready to send and receive events between the User Interface and your C source code program.
5.3.4.4. The StartAcquireData() Function
This function works as an event procedure in Visual Basic programming. This means that this function will be automatically called when the Start button in the Panel Window is clicked by the user during your program's running. But right now, only a skeleton of the function is generated and provided by the CodeBuilder, as shown in Figure 5-17.
Figure 5-17.
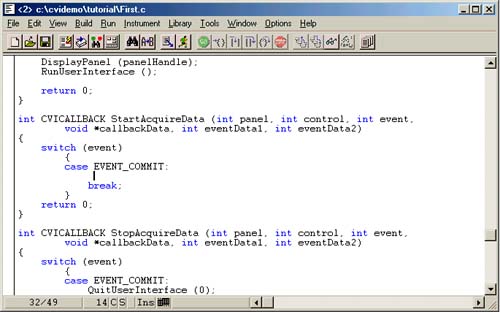
								int CVICALLBACK StartAcquireData (int panel, int control, int event,
								void *callbackData, int eventData1, int eventData2)
								{
								switch (event)
								{
								case EVENT_COMMIT:
								break;
								<-- 1
								}
								return 0;
								}
|
You need to add the function body into this function by using the Function Panel tool, which is described in the next section. When the user clicks the Start button while the program is running, an EVENT_COMMIT event will be created and passed to this function. The function code you add later will be performed to fulfill the desired task based on the function code. This function will return a 0 if no error is encountered.
5.3.4.5. The StopAcquireData() Function
The StopAcquireData() function is used to stop the data collection, and its function body is shown in Figure 5-18. When the user clicks the Stop button while your program is running, an EVENT_COMMIT event will be generated and passed to this function automatically by LabWindows/CVI. The function QuitUserInterface(0) will be executed to terminate your program. The parameter 0 means that this termination has no error. If you don't get a 0, an error happened during the termination process.
Figure 5-18.
int CVICALLBACK StopAcquireData (int panel, int control, int event, void *callbackData, int eventData1, int eventData2) { switch (event) { case EVENT_COMMIT: QuitUserInterface (0); break; } return 0; } |
5.3.4.6. Add All Files into Your New Project
By now, you have created three files:
user interface resource file, First.uir
head file (created by LabWindows/CVI), First.h
C programming source code (skeleton), First.c
Note that LabWindows/CVI cannot automatically add all three files into your new project. You need to add them into your new project yourself. Perform the following steps to fulfill this operation.
- Close all windows except the project window.
- Click the Edit menu and select Add Files to Project|All Files (*.*). An Add Files to Project dialog box will pop up as shown as in Figure 5-19.
Figure 5-19.

- Use the Ctrl key to select all three files, First.h, First.c, and First.uir, as shown. Then click the Add button to put these files into the Selected Files: section.
- Click the OK button to add these files into your new project.
5.3.4.7. Running Your Project
Now you already have a working project even though some functions are still not completed (remember the empty function body). You can try to run your project by clicking Run and selecting Run Project. Only one control can be activated by an event, EVENT_COMMIT, at this point. That is the Stop button control. When you click the Stop button as you run your project, the EVENT_COMMIT event will be generated and sent to the StopAcquireData() callback function, and the QuitUserInterface(0) function will be executed to terminate your program. The next task we need to do is to make the function body for the Start button.
5.3.5. Using the Function Panel to Complete Your Program
The Function Panel is a tool provided by LabWindows/CVI that can be used to create a function body and connect that function to the instrument drivers to access the low-level hardware to fulfill some functionality based on the function's requirements.
For any control software, its final objective is to realize the function controllability of the hardware. In order to realize this objective, the control software needs different drivers to access the hardware because the control software, such as ANSI C, Visual C++, and Visual Basic, is high-level software and cannot directly communicate with the hardware. The drivers developed in LabWindows/CVI are called instrument drivers, which are still high-level functions, but can access many low-level interfaces and, furthermore, access the hardware.
The instrument drivers in LabWindows/CVI are divided into different groups based on their different functionalities, such as instrument drivers for GPIB, VXI, or rs-232 and DAQ. Each instrument driver consists of a set of functions that can access an instrument or a group of related instruments. A simulated instrument driver is used for our project to avoid complicated hardware settings. The purpose of using this simulated driver is to acquire a waveform from a simulated oscilloscope.
Your project will perform the following tasks:
- Read an array of simulated data from a simulated instrument driver when the user clicks the Start button.
- Plot the data array obtained on the strip chart on your Panel Window.
- Terminate the program when the user clicks the Stop button.
By using the Function Panel, we can perform the following functionalities:
- Create a detailed function body with arguments and returning data.
- Connect this function with the desired instrument drivers.
- Test and debug this function (test the functionality of accessing the instrument drivers and the hardware).
- Insert the function body into your skeleton source code (First.c) to complete your callback function.
Next, we will use the simulated instrument driver to illustrate the usage of the Function Panel step by step. But first, you need to load the instrument driver.
5.3.5.1. Load the Instrument Driver
Instrument drivers are stored in instrument driver files and extended with .fp. You need to load these files to access the instrument drivers.
- Click Edit and select Add Files To Project|Instrument (*.fp). An Add Files To Project dialog box appears, as shown in Figure 5-20.
Figure 5-20.

- Select scope.fp, which is a simulated instrument driver located in the cvidemo/tutorial directory, and click the Add button followed by the OK button to add this instrument driver into your project.
- Double-click the First.c file in your project window to open your source code.
- Move your mouse cursor on the blank line between the EVENT_COMMIT: statement and the break statement inside the StartAcquireData() function, as shown in Figure 5-21.
Figure 5-21.
The purpose for the last step is to locate the position for which you will insert your function body created by using the Function Panel. If you did not locate your cursor at the blank line as directed in the previous step, the function body (C code) created by using the Function Panel later on will be inserted in a random location in your source code window, which is not very convenient. Of course, you can always find this inserted function body code later and move it to the desired location if you like.
Next, we will use the Function Panel to create, test, and insert the function body into the StartAcquireData() skeleton function in your source code window.
5.3.5.2. Initialize the Instrument Driver
Open a Function Panel.
Click Instrument and select Sample Oscilloscope. A Select Function Panel dialog box appears. The simulated oscilloscope instrument driver will be used to create a function body for the StartAcquireData() function and to acquire a simulated waveform. The created function code will be added to the StartAcquireData() function in the source code automatically.
Four functions are used for this simulated instrument driver:
Initialize
Configure
Read Waveform
Close
The Select Function Panel is shown in Figure 5-22. Select the Initialize function and then click the Select button. A Sample Oscilloscope-Initialize dialog box appears, as shown in Figure 5-23. You can right-click your mouse on the Function Panel to get online help for the Initialize function.
Figure 5-22.

Figure 5-23.

Two controls are included in this function panel, Address and Error. Address is an argument for the initialize function, and Error is the returning status of executing this function; 0 means no error occurred and the function call is successful.
5.3.5.3. Define and Initialize the Instrument Driver Function
The default value for the Address control is 1. Keep this value.
Enter err_code in the Error control box as the name of the returning variable.
Declare err_code as a returning variable by clicking Code and selecting Declare Variable. A Declare Variable dialog box appears, as shown in Figure 5-24.
Figure 5-24.

Check both the Execute declaration and Add declaration to top of target file checkboxes. Click OK to close this dialog box.
A statement like static int err_code will be added into the top of your source code after you close the Declaration Variable dialog box.
Now, you can test your initialize function, scope_init(1), by clicking Code and selecting Run Function Panel. A dialog box will pop up to prompt you to save the changes before running your program. Click Yes to acknowledge it.
If your initialize function is correctly called, err_code should be equal to 0. If not, right-click the Error control to refer to the online help. Your Function Panel for initializing a simulated oscilloscope function should look like the one in Figure 5-25 after you test it. The next step is to insert this function into your source code.
Figure 5-25.

5.3.5.4. Insert the Function into Your Source File
Click Code and select Insert Function Call to insert this function into your source code.
Click File and select Close to close the function panel.
When you modify the function by entering the value into the control box, the function is displayed on the bottom of the Function Panel, as shown in Figure 5-25. The function err_code = scope_init(1) is shown on the bottom and will be added into your source code under the EVENT_COMMIT: in your First.c.
5.3.5.5. Read Data Array from the Instrument
After initializing the instrument function, the Read Waveform function in the instrument driver should be called to retrieve the data array from a simulated oscilloscope and convert the raw data to voltage and store the data array in memory space. Perform the following steps to fulfill this functionality.
- Click Instrument, and select Sample Oscilloscope to open the Select Function Panel. Select the Read Waveform function, and click the Select button to open the Read Waveform panel, as shown in Figure 5-26.
Figure 5-26.

- Move the Channel control to 1, which is sine wave data. Channel 2 is random data.
- Select the Waveform control and enter data as the name for a data array.
- Click Code and select Declare Variable to declare the data array variable. A Declare Variable dialog box appears, as shown in Figure 5-27.
Figure 5-27.

- Enter 100 in the Number of Elements: input box as the size of the data array.
- Confirm that both the Execute declaration and Add declaration to top of target file checkboxes are checked, as shown as in Figure 5-27.
- Click the OK button to finish this data array declaration.
In a similar way, set up the following controls: Sample Period, X Zero, and Error.
- Select Sample Period control and enter increment_t into the input box; click Code and select Declare Variable to open the Declare Variable dialog box. Make sure that the top two checkboxes have been checked, as shown in Figure 5-28, and click OK.
Figure 5-28.

- Select X Zero control and enter x_zero into the input box.
- Click Code and select Declare Variable to open the Declare Variable dialog box. Make sure that the top two checkboxes have been checked, and click OK.
- Select Error control and enter err_code in the input box.
- Click Code and select Run Function Panel to test this Read Waveform function. Save the changes you made before running it. The err_code should return a 0 if this function is executed correctly, and a row of boxes in the Waveform control is displayed. This indicates that data has been stored into the data array. You can double-click this row of boxes to check the data in the data array.
- After testing the function, click Code and select Insert Function Call to insert this function into your source code; insert this function after the scope_init() function under the EVENT_COMMIT:.
- Click File and select Close to close the panel.
After you have finished the previous steps, you will find that the callback function
err_code = scope_read_waveform(1, data, &increment_t, &x_zero);
has been added to your source code.
5.3.5.6. Display the Waveform on a Strip Chart
Now that you have finished acquiring the data from a simulated oscilloscope, the next step is to display the data on a strip chart by using a PlotStripChart() function. Perform the following steps to fulfill this plotting:
- Click Library and select User Interface. In the opened dialog box, select Controls|Graphs/Strip Charts|Graph and Strip Charts|Strip Chart Traces|Plot Strip Chart.
- Enter the following values for the controls:
Panel Handle: paneHandle Control ID: PANEL_DATAWAVEFORM Y Array: data Number of Points: 100 Starting Index: 0 Skip Count: 0 Y Data Type: double precision Status: keep blank
Your finished plotting function panel should look like the one shown in Figure 5-29.
- Click Code and select Insert Function Call from this panel to insert this function into your source code window.
- Close this function panel, and you will find that the function
PlotStripChart(paneHandle, PANEL_DATAWAVEFORM, data, 100, 0,
                      0, VAL_DOUBLE);
has been inserted in your source code just after the scope_read_waveform(). - Click File and select Save in your source code window to save the changes you made.
Figure 5-29.

Congratulations! Your project is done.
5.3.5.7. Review the Source Code
Figure 5-30 shows the completed source code for your program. The top four lines in your source code are inserted by using the Function Panel when you declare and insert these variables to the functions. Three callback functions, scope_init(), scope_read_waveform(), and PlotStripChart(), have been inserted under the event EVENT_COMMIT: inside the StartAcquireData() function. These variables and functions are inserted automatically by the LabWindows/CVI when you declare and define them in the Function Panel.
Figure 5-30.
static double x_zero; static double increment_t; static double data [100]; static int err_code; #include <cvirte.h> // Needed if linking in external compiler; harmless otherwise #include <userint.h> #include "First.h" static int panelHandle; int main (int argc, char *argv[]) { if (InitCVIRTE (0, argv, 0)== 0) // Needed if linking in external compiler. return -1; // out of memory if ((panelHandle = LoadPanel (0, "First.uir", PANEL))<0) return -1; DisplayPanel (panelHandle); RunUserInterface (); return 0; } int CVICALLBACK StartAcquireData (int panel, int control, int event, void *callbackData, int eventData1, int eventData2) { switch (event) { case EVENT_COMMIT: err_code = scope_init (1); err_code = scope_read_waveform (1, data, &increment_t, &x_zero); PlotStripChart (paneHandle, PANEL_DATAWAVEFORM, data, 100, 0, 0, VAL_DOUBLE); break; } return 0; } int CVICALLBACK StopAcquireData (int panel, int control, int event, void *callbackData, int eventData1, int eventData2) { switch (event) { case EVENT_COMMIT: QuitUserInterface (0); break; } return 0; } |
5.3.5.8. Run Your Completed Project
Your completed project is named First.prj, and you can double-click any file in your project to view and edit it. Click the Run menu and select Run Project to run your project. First, LabWindows/CVI will compile all files in your program, and a message box will pop up to prompt you that you missed the scope.h head file. Click the Yes button in the message box to add this head file into your source code.
When your project runs, the LabWindows/CVI will perform the following tasks:
Compile your source code and link it with the instrument drivers in the library.
Display the Panel Window and ready it for the user's input.
Create an event and pass it to the associated callback function based on the user's action. For example, an EVENT_COMMIT will be generated and passed to the StartAcquireData() function if the Start button is clicked by the user, and the associated functions will be executed to access the instrument drivers to collect the data from a simulated oscilloscope. A similar event will be generated if the user clicks the Stop button.
Call a plot function to plot a sine waveform on the strip chart.
Figure 5-31 shows the running result when the user clicks the Start button for this project.
Figure 5-31.

5.3.6. Adding a Sine Waveform Monitor to Your Program
In the last section, we used the LabWindows/CVI to create a new project, First.prj, and used the tools provided by LabWindows/CVI to develop our first application program. Now that we have a basic understanding of the LabWindows/CVI tools, in this section, we want to add a monitor to detect the level or amplitude of the sine waveform we created in the previous section. A timer system performs synchronous data acquisition. In addition, a thermometer is used to track the level/amplitude of the sine waveform when you simultaneously acquire the data from the simulated oscilloscope.
5.3.6.1. Timer Controls
Timer controls can be used to generate events at specified intervals automatically. We want to add a timer control to First.prj to create an event that triggers a callback function to acquire the data of the sine waveform, which is obtained by using the simulated oscilloscope. In order to do that, we first should add a timer control and a thermometer indicator to display the level/amplitude of the sine data array.
Perform the following steps to add a timer control to your project:
- First, open the First.prj project.
- In the project window, double-click First.uir to open your user interface resource file. Click Create and select Timer. A timer control is displayed on your user interface. Use the mouse to move it to any appropriate position on your panel; the timer will not be displayed on your panel when your program runs.
- Double-click the Timer icon to open the Edit Timer dialog box. Enter the following parameters in the dialog box and click the OK button to save these settings.
Constant Name: Sine_TIMER Callback Function: SineSample Interval: 0.100 Enabled checkbox: checked Label: Sine Sample Size To Text: checked Label Style: Size: 12; Bold: checked; Text Color: Brown
Your finished Edit Timer dialog box should look like the one shown in Figure 5-32.
Figure 5-32.

- Click Create and select Numeric|Thermometer to add a thermometer to your user interface. Move it and other items to appropriate locations as shown in Figure 5-33.
Figure 5-33.

You can do the same job by right-clicking your mouse on your user interface panel; a submenu will pop up and you can select the Numeric item as well as the Thermometer to add a thermometer to your panel. - Double-click the thermometer icon to open the Edit Numeric Thermometer dialog box, and enter the following items in the dialog box to set the parameters:
Constant Name: SINELEVEL Callback Function: Default Value: 0.00 Data Type: double Control Mode: Indicator Label: Sine Waveform Level Label Style: Size: 12; Bold: checked; Text Color: Blue
You also need to edit the range of the thermometer by clicking the Range Values button in the Controls Settings section to open the Edit Range Values dialog box. Enter the parameter values as shown in Figure 5-34 and click the OK button to save these settings.
Figure 5-34.

- Click the OK button on the Edit Numeric Thermometer to close this dialog box.
- Save your user interface resource file by clicking File and select Save to save the modifications you made.
5.3.6.2. Add a Timer Callback Function
After you add a timer to your user interface, you should add a callback function to your source code to receive and process the event, which is generated by the timer each time the time interval is matched to 0.1 second. Perform the following steps to add a callback function for your timer:
- Open your source code window by double-clicking the First.c file.
- In the User Interface Editor, click the Timer control to select it, and right-click on the Timer control, then select the Generate Control Callback item.
- The callback function SineSample() has been added at the bottom of your source code window, as shown in Figure 5-35.
Figure 5-35.
int CVICALLBACK SineSample (int panel, int control, int event, void *callbackData, int eventData1, int eventData2) { switch (event) { case EVENT_TIMER_TICK: break; } return 0; } |
5.3.6.3. Add a Function to Update the Sine Waveform Level Monitor
We need to add a function inside the SineSample() callback function to update the level/amplitude of the sine waveform when the time interval is up. This function should be added under the EVENT_TIMER_TICK event, which is generated by the Timer each time the time interval is up.
Perform the following steps to fulfill this job:
- Place your cursor on the blank line under EVENT_TIMER_TICK.
- Click Library and select User Interface. In the resulting dialog box, select Controls/Graphs/Strip Charts|General Functions|Set Control Value.
- A Set Control Values dialog box appears. Enter the following parameters in the dialog box:
Panel Handle: panelHandle Control ID: PANEL_SINELEVEL Values: data[i]
A new function, SetCtrlVal (panelHandle, PANEL_SINELEVEL, data[i]), is created on the bottom of the panel. - Click Code and select Insert Function Call to insert this function into your source code. This function should be called and executed each time the timer generates an event to indicate that the time interval is up. The functionality of this function is to update the level/amplitude of the sine waveform acquired from a simulated oscilloscope developed in the previous section.
Your completed SineSample() callback function should look like the one shown in Figure 5-36.
Figure 5-36.
int CVICALLBACK SineSample (int panel, int control, int event, void *callbackData, int eventData1, int eventData2) { switch (event) { case EVENT_TIMER_TICK: SetCtrlVal (panelHandle, PANEL_SINELEVEL, data[i]); break; } return 0; } |
5.3.6.4. Modify Your Callback Function
We need to emphasize a few points:
For the SetCtrlVal() function, a data[i] array is used as the updated data source. This data array is obtained by calling the StartAcquireData() callback function from a simulated oscilloscope. We can see that this data array is inserted on the top of your source code program as a global variable by generating the Read Waveform function. So we can use this data array in any function without declaring it because it is a global variable.
When this function updates the level/amplitude of the sine waveform by displaying the values of the data array data[i], a limitation emerges. The total number of the elements in the data array is (100). So we need to modify this variable i to make it change between 1 and 100 and make it continue reading and displaying the data array forever until the program is terminated.
Open your source code window and make the following modifications to your program:
- Add a new global integer variable i at the top of your program as a global variable.
- Initialize this variable as 0 inside your main() function.
- Add one statement, i++;, after the SetCtrlVal() function call inside the SineSample() callback function.
- Add the following code after the i++; statement:
If (i >= 100)
    i = 0;
Your completed SineSample() callback function should look like the one shown in Figure 5-37.
Figure 5-37.
int CVICALLBACK SineSample (int panel, int control, int event, void *callbackData, int eventData1, int eventData2) { switch (event) { case EVENT_TIMER_TICK: SetCtrlVal (panelHandle, PANEL_SINELEVEL, data[i]); i++; if (i>=100) i = 0; break; } return 0; } |
5.3.6.5. Run Your Completed Project
Click Run and select Run Project from either the project window or the source code window to run your project. Click the Start button in your user interface panel to start your project. The running project should look similar to the one shown in Figure 5-38.
Figure 5-38.
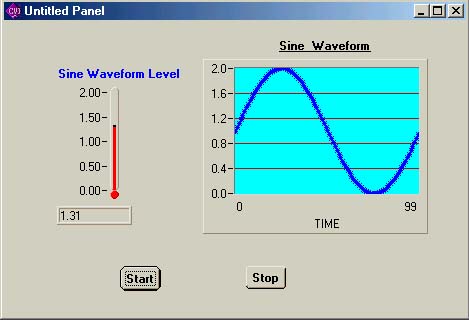
The program simultaneously acquires the sine data from a simulated oscilloscope, displays it on a chart, and monitors the level/amplitude of the sine data array on a thermometer. Both the waveform in the chart and the thermometer level will change periodically, but the only change you can see is the level of the sine waveform because the changing frequency of the chart is too high to be seen as your program runs.
An advantage of using LabWindows/CVI to develop the project is that you can modify your source code as you like, just as if you are working under the C environment. This is very convenient for engineers and researchers who are used to working in ANSI C or Visual C++. You can modify your source code as long as you keep the prototypes of callback functions generated by using the CodeBuilder and the Function Panel unchanged in LabWindows/CVI.
5.3.7. Add LEDs to Your Project as the Digital Monitor
Now, we want to add two LEDs into your First project to monitor the on/off status of the sine waveform. We define the two LEDs as follows:
OFF— The voltage of the sine waveform is smaller than 1.00 volts.
ON— The voltage of the sine waveform is greater than 1.00 volts.
Open the User Interface Resource File First.uir, and add two LEDs to your panel.
- Right-click on your User Interface Panel, and select LED from the pop-up submenu. Select the square light style.
- In the opened Edit LED dialog box, enter the following values for this LED:
Constant Name: HLED Label: HIGH LEVEL Label Style: Size: 11; Bold: checked; Text Color: brown
Your Edit LED panel should match the one shown in Figure 5-39.
Figure 5-39.

- Follow similar steps to add another LED, and enter the following values:
Constant Name: LLED Label: LOW LEVEL Label Style: Size: 11; Bold: checked; Text Color: brown
Re-arrange the controls on the User Interface Panel so that your GUI looks like the one shown in Figure 5-40.
Figure 5-40.

5.3.7.1. Add Functions to Update the LED
In your User Interface window, click Library and select User Interface. Then, in the resulting dialog box, select Controls/Graphs/Strip Charts|General Functions|Set Control Value.
Fill the function panel controls with the following values:
| • Panel Handle: | panelHandle |
| • Control ID: | HLED |
| • Value: | h_val |
For the Value parameter, after you enter h_val in the input box, click Code and select Declare Variable. Make sure that the top two checkboxes have been checked in the resulting dialog box, and click OK to close this dialog box. Click Code and select Insert Function Call to insert the SetCtrlVal() function into your source code window; inside the SineSample() function under the EVENT_TIMER_TICK event following the SetCtrlVal() function that was inserted before for the thermometer.
Follow similar steps to add another function, SetCtrlVal(), to your source code window after the inserted SetCtrlVal() function. Your SineSample() callback function should match the one shown in Figure 5-41. The highlighted codes are newly added functions.
Figure 5-41.
int CVICALLBACK SineSample (int panel, int control, int event, void *callbackData, int eventData1, int eventData2) { switch (event) { case EVENT_TIMER_TICK: SetCtrlVal (panelHandle, PANEL_SINELEVEL, data[i]); i++; if (i>= 100) i = 0; if (data[i]>= 1.0) { h_val = 1; l_val = 0; } else { l_val = 1; h_val = 0; } SetCtrlVal (panelHandle, PANEL_HLED, h_val); SetCtrlVal (panelHandle, PANEL_LLED, l_val); break; } return 0; } |
The codes before these two newly inserted functions are used to digitalize the amplitude of the sine waveform to the on/off values. Two SetCtrlVal() functions following this digitalizing are used to set the on/off values to two LEDs and display them on the User Interface Panel Window.
Save your source code and run your project. Click the Start button to begin to acquire the sine data from the simulated oscilloscope, and display it on the graph. Your running program should look like the one shown in Figure 5-42.
Figure 5-42.

As your program runs, the thermometer monitors and displays the level/amplitude of the sine waveform. Two LEDs display the digitalized amplitude of the sine waveform. The HIGH LEVEL LED will turn on when the digitalized amplitude of the sine waveform is greater than 1.0, and the LOW LEVEL LED will turn on if the digitalized amplitude of the sine waveform is smaller than 1.0.