

7.4.3.2 Defi nition of SLDA
Let D = x
1
, x
2
, ..., x
N
be a data set of N d-dimensional data objects. Let
A = attr
1
, attr
2
, ..., attr
d
be the set of attributes of the data objects so that x
i
j
¢ dom(attr
j
), where dom(attr
j
) denotes the domain of the attribute attr
j
, j = 1,
..., d. Without losing the generality, we assume that all the attributes have
been normalized, i.e., dom(attr
j
) ¢ [0, 1]. In this section, we fi rst construct
a hyper-rectangle structure of data object x based on the kernel width W*
and determine the corresponding subset of attributes S by running Rodeo;
and then, conduct a spatial statistical test on the hyper-rectangle to decide
whether it is a SLDA around the data object x. To better describe the process
of determining the SLDA, we introduce the following defi nitions.
Defi nition 7.6 (Hyper-Rectangle). Given a subset of attributes S and a kernel
width W* = width
1
, ...,width
p
of data object x, the hyper-rectangle structure
H around x can be constructed as : H = I
1
???I
p
, where I
j
= [x
j
?width
j
/2, x
j
+width
j
/2], j = 1, p, p = dim(S).
0
1
0.8
0.6
0.4
0.2
Dimension 4
0 0.5 1
Dimension 4
0
0.1
0.2
0.3
0.4
0.5
0.6
0.7
0.8
1234
Dime nsi ons
Kernel withd
Ke r ne l w id t h
0
1
0.8
0.6
0.4
0.2
Dimension 2
0 0.5 1
Dimension 1
(a) Distribution on dimension 1 and 2 (b) Distribution on dimension 3 and 4 (c) the kernel width of each dimension
Figure 7.4.1: The distribution and the kernel width
The volume of hyper-rectangle around the data object x is vol(H) = 2
j
= 1
p
width
j
. The number of data objects within the hyper-rectangle H can be
used to indicate the local density around x.
Defi nition 7.6 (Data Objects in Hyper-Rectangle). Given a data set D and
a hyper-rectangle H around a data object x in the subset of attributes S, the
data objects located in H are defi ned as: remm(H) = x
i
¢ D | (x
j
− width
j
/2)
≤ x
i
j ≤ (x
j
− width
j
/2), i = 1, ...,N; j = 1, ..., p.
Defi nition 7.7 (Local Density of Hyper-Rectangle). Given the identifi ed
data object set remm(H) of a data object x , the local density around x in the
subset of attributes S is defi ned as: LS(H) =|remm(H)|, where |·| means
the number of objects within the hyper-rectangle.
Known from the spatial statistical theory of assigning N data points
in a space, the number of data points which are assigned in a bounded
area is subject to the Binomial distribution with parameters of N and the
Advanced Clustering Analysis 173
174 Applied Data Mining
volume of the bound area [16]. Here H is the hyper-rectangle in the subset
of attributes, which is a bounded area, and the local density LS(H) is the
number of data objects assigned in H. So LS(H) is subject to the Binomial
distribution with parameter N and vol(H), i.e.,
LS(H) ´ Binomial(N, vol(H)).
To decide whether H is a dense hyper-rectangle, we run a null
hypothesis statistical test on H.
h
0
: Hyper-rectangle H in S contains LS(H) data objects.
The signifi cant level α of the statistical hypothesis is a fi xed probability
of wrongly rejecting the null hypothesis, when in fact it is true. α is also called
the rate of false positives or the probability of type I error. The critical value
of the statistical hypothesis test is a threshold which the value of the test
statistic is compared to determine whether the null hypothesis is rejected.
There are two test methods for hypothesis test: one-side test and two-side
test. For the one-side test, the critical value θ is computed based on α =
p(LS(H) > θ). For the two-side test, the computation of left critical value θ
L
is the same as the one-side test, but the right critical value θ
R
is computed
based on α = p(LS(H) > θ
R
) Where is a probability function.
Defi nition 7.8 (Signifi cant Local Dense Area). Let H be a hyper-rectangle
in the subset of attributes S. Let α be a signifi cant level and θ be the critical
value computed at the signifi cant level α based on the one-side test, where
the probability is computed using Binomial(N, vol(H)). If LS(H) > θ, (H,
S) is deemed as a Signifi cant Local Density Area (SLDA) around the data
object x.
0
1
0.8
0.6
0.4
0.2
Dimension 2
0 0.5 1
Dimension 1
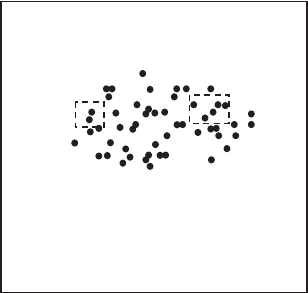
H1
H2
Figure 7.4.2: Hyper-rectangle of dataset D

7.4.4 Projective Clustering based on SLDAs
7.4.4.1 Finding SLDAs
After using the Rodeo method, the subset of attributes S and the kernel
width w* of a data object x are generated. Based on S and w*, a hyper-
rectangle structure H is constructed around x. We also use the data set
described in Section 2.2 as an example to illustrate the constructed hyper-
rectangle. The subset of attributes having important supports on kernel
estimation is on dimensions 1 and 2.
The example of H is shown in Fig. 7.4.2. In this fi gure, there are two
hyper-rectangles H
1
, H
2
around two randomly selected data objects. But
the local density values of each hyper-rectangle are different. Based on the
Defi nitions 7.6 and 7.7, the local density value of the dashed frame (H
1
) is
2, whereas the local density value of the real line frame (H
2
) is 5. According
to the spatial statistical hypothesis described in Section 2.3, we set the
signifi cant level α = 0.001 and the value of θ calculated by the one-side
statistical test is 3.21. So the dashed frame is not a signifi cant local density
area as LS(H
1
) < θ, and it will be deleted.
The greedy search method, G_SLDA as shown in Algorithm 7.6, is
utilized to fi nd the whole signifi cant local dense areas which can cover
the data distribution of D in the d-dimensional space. The main steps of
G_SLDA are to:
(1) randomly select a data object x from D and calculate the subset of
attributes S and the kernel width W* using Rodeo (steps 3–4);
(2) create a hyper-rectangle structure H around x based on Defi nition 7.5,
and obtain the local dense value of H based on Defi nition 7.6 and 7.7
(steps 5–6);
Algorithm 7.6: G_SLAD
Input: Data set D
Output: SLDA set SLD
1. SLD Ø;
2. Loop
3. Randomly select a data object x from D;
4. [S,W*] =Rodeo(D, x);
5. H = CreateH(x, S, W*);
6. remm(H) = G_remm(D, H);
7. Run a statistical test of LS(H)=|remm(H)|on H according to defi nition 4;
8. If LS(H) θ
9. SLD = SLD (H, S);
10. x and the data object in remm(H) are signed as visited;
11. end
12. Until all data objects in D are visited
13. return SLD
Advanced Clustering Analysis
175

176 Applied Data Mining
(3) decide whether H is a Signifi cant Local Dense Area based on Defi nition
7.8. If H is a signifi cant local dense area, store the pair (H, S) into SLD
set, and label x and the data objects in H as visited, otherwise, discard
the obtained hyper-rectangle H (steps 7–11). These steps iteratively
run until all data objects have been processed.
7.4.4.2 Generating Clusters by Merging SLDAs
G_SLDA fi nd out all the signifi cant local density areas of data set D. Each
SLDA, (H, S), in SLD contain a density hyper-rectangle satisfying LS(H) ≥ θ
and its relevant subset of attribute S. The main structure of the density area
in a subset of attributes can be captured by all the density hyper-rectangles
embedded in it. To further understand the relationship between the density
area and signifi cant local density area, we give an example to show it. Given
a data set D used in Fig. 7.4.1, each object is described by four attributes,
the range of each attribute is in [0,1]. The data of the fi rst two attributes is
subject to a normal distribution and the data of the last two attributes is
subject to a uniform distribution.
From the above discussion, we know that the identifi ed subset of
attributes is on S = 1, 2 denoted by nodes in Fig. 7.4.2, and the SLDAs
generated by G_SLDA on S = 1, 2 are represented by six solid rectangles (i.e.,
H
1
, H
6
). From Fig. 7.4.3, we therefore can conclude that the main structure
of data distribution is characterized by six dense hyper-rectangles.
Figure 7.4.3: Example of the relationship between SLDAs and the density area
0
1
0.8
0.6
0.4
0.2
Dimension 2
0 0.5 1
Dimension 1
H5
H2
H1
H3
H4
H6

The clustering result of projective clustering is represented by the data
objects which are located in small ranges in its specifi c subspace. As for
SLDA, the various Hs do indicate these small ranges in S. The data objects
that are scattered in deferent hyper-rectangle Hs but within the same
subspace S constitute the different parts of a dense area in S. To obtain the
fully projected clusters, we need to merge these hyper-rectangles within
the same subspace S to generate its corresponding cluster. More concretely,
the clusters derived by a projective clustering algorithm are represented by
all the dense areas and their related subsets of attributes.
Algorithm 7.7: MC_SLDA
Input. SLD
Output. Clustering results and outliers
(1) Divide SLD into several subsets;
(2) For each subset of SLD, a single-linkage merger algorithm is run to fi nd out the
clustering results;
(3) Refi ne the clustering results
Hence we merge all the dense hyper-rectangles in the same subset of
attributes to generate the clusters. Further, for the example shown in Fig.
7.4.3, the cluster in the subset of attributes S = 1, 2 is (
h
= 1
6
, (1, 2)), where
h
= 1
6
denotes the merger processing of density hyper-rectangles. The
three major steps of the merger clustering algorithm on SLDAs, named
MC_SLDA, are to (1) divide SLDAs into several subsets so that the hyper-
rectangles within one attribute subset have the same subspace S; (2) run a
single-linkage merger algorithm on these subsets to fi nd the fully projected
signifi cant local dense area; (3) refi ne the clustering results and detecting
the outliers. The pseudo codes of MC_SLDA are detailed in Algorithm 2.
The data objects which are not included in any clusters are denoted as Rest
= D(
K
k=1
C
k
),
where
is the set different operator. In the clustering result refi nement, we use
the reassign method proposed in [39] to assign data objects in Rest to the
corresponding clusters. After the refi nement, the data objects which do not
belong to any clusters can be regarded as outliers, and an outlier collection
is generated.
Hyper-rectangle structure is often used in fi nding the density area
in high dimensional data sets. The determination of the width of hyper-
rectangle structure is a crucial task in high dimension clustering applications.
The majority of projective clustering algorithms use the restrictive model
to determine the width of hyper-rectangle, which has signifi cant efforts on
discovering real clustering results. Inspired by the kernel density method,
we present a new way to design the hyper-rectangle structure, whose width
is determined by the true data distribution. In order to examine whether
a hyper-rectangle structure is a Signifi cant Local Density Area, we run a
Advanced Clustering Analysis 177
..................Content has been hidden....................
You can't read the all page of ebook, please click here login for view all page.