As the future value of an investment is usually uncertain, an investor needs to think in terms of an expected rate of return. The investor has a target expected rate of return that will compensate for the risk specific to the investment. That target expected rate of return is sometimes called the required rate of return for the investment. Given the risk taken, an investor makes a sound investment if the actual expected rate of return exceeds the required rate of return.
Finance models are often cast in terms of an investment’s aggregate required rate of return, meaning the “market’s” required rate of return. This is sometimes called the opportunity cost of capital, or simply the investment’s cost of capital. Another synonym is the equilibrium expected rate of return, which is the expected rate of return only if the investment is correctly priced in the market.
An important question is which risk–return model is best to use to determine how an investment’s cost of capital should be traded off against the investment’s risk. A long-standing risk–return model is the traditional Capital Asset Pricing Model (CAPM), which is covered in many finance courses and used extensively by practitioners.
In this chapter and the next, we extend the CAPM to internationally integrated financial markets. Given the significant extent of real-world financial market integration and international diversification, an international risk–return model seems logically superior to the traditional CAPM, which is usually applied as a local (or domestic) risk–return model.
This chapter introduces the simple global CAPM (GCAPM), which looks like the traditional CAPM except that the global market index replaces the domestic market index. The international CAPM (ICAPM) is more complex but theoretically stronger than the GCAPM. The next chapter introduces a version of the ICAPM that has some benefits that may justify the additional complexity.
In some currencies, including the US dollar, the simpler GCAPM provides an acceptable approximation to the more complex ICAPM estimate of an asset’s cost of capital. However, the GCAPM may not give an acceptable approximation to the ICAPM when estimating cost of capital in some other currencies or when estimating currency risk premiums.
Traditional CAPM Review
The traditional CAPM is a widely used risk–return model: In a 2012 survey of 19 highly regarded U.S. companies, all but one reported using the CAPM to estimate cost of capital. The CAPM continues to be controversial in academic circles, but remains the primary risk–return model in finance textbooks. A 2009 survey of finance professors found that 75% recommend the CAPM approach to the cost of capital.1
The well-known traditional CAPM equation is ki = rf + βi[MRP], where ki is asset i’s cost of capital; rf is the risk-free rate of return; βi is asset i’s risk measure (called “beta”); and MRP denotes the market risk premium, which is the risk premium required on the market index by the representative investor. We next elaborate on all four of these variables.
The ki variable is also called asset i’s equilibrium expected rate of return, which is only equal to the actual expected asset return if the asset is correctly priced in the market.
A standard practice in U.S. applications has been to use a U.S. Treasury yield for rf. Historically, there has been disagreement on whether to use a short-term or long-term rate. Recent survey evidence shows that managers strongly prefer using a long-term rate.2
The “beta” risk measure, βi, is asset i’s sensitivity to unexpected returns on the market index. If an asset has a beta of 1.20 and the market index’s rate of return is 10% higher than expected, then the asset’s rate of return will tend to be (on average) 1.20(10%) = 12% higher than expected. The beta of the market index is 1, by definition.
The market risk premium, MRP, is equal to kM − rf, which is the required rate of return on the market index minus the risk-free rate; kM − rf is the compensation for the risk in the diversified portfolio represented by the market index, and is properly named the MRP. As with individual assets, the difference between the market index’s actual expected rate of return and the risk-free rate is not truly a risk premium because the market index’s possible misvaluation is incorporated.
In the traditional CAPM, the market price of risk is the MRP divided by the variance of market index returns, where the variance measures aggregate market risk. The market price of risk is driven by the average investor’s degree of risk aversion. Thus, the MRP tends to change as overall market volatility changes and as investors’ tolerance for risk fluctuates with economic conditions.
Years ago, it was standard to use a range of 7% to 9% for the U.S. MRP. More recent estimates for the U.S. MRP tend to be in the range of 4% to 7%.3 Exhibit 1.1 shows some U.S. market risk premium estimates over recent years, which are from Aswath Damodaran’s website. The average of the MRP estimates is 5.65%.
Given the modern range of 4% to 7%, reasonable estimates of the U.S. MRP are: In a “normal” market period, use an estimate in the 5% to 6% range. If the market is relatively depressed due to heightened risk aversion (“fear”), use an MRP estimate in the 6% to 7% range. And if the market is in an aggressive stage with higher tolerance for risk (“greed”), use an estimate in the 4% to 5% range.
Exhibit 1.1 U.S. market risk premium (MRP) estimates
2002 |
4.73% |
2003 |
4.74% |
2004 |
4.86% |
2005 |
5.22% |
2006 |
6.12% |
2007 |
4.59% |
2008 |
6.92% |
2009 |
4.64% |
2010 |
6.09% |
2011 |
8.34% |
2012 |
7.30% |
2013 |
4.99% |
2014 |
5.38% |
2015 |
5.16% |
Source: Damodaran: http://pages.stern.nyu.edu/~adamodar/
Rate of Return on a Foreign Asset
We first address the notion of a given asset’s rate of return in different currencies. Specifically, an asset’s rate of return in one currency depends on the rate of return in another currency and the change in the spot FX rate between the two currencies, as shown in equation (1.1a). Equation (1.1a) shows the conversion of asset i’s rate of return in euros, ![]() , to the same asset’s rate of return in US dollars,
, to the same asset’s rate of return in US dollars, ![]() , using the percentage change in the FX price of the euro (in US dollars), x$/€.
, using the percentage change in the FX price of the euro (in US dollars), x$/€.
Asset’s Rate of Return in Different Currencies
![]()
For example, if an asset’s rate of return in euros is 20%, and the euro appreciates by 5% versus the US dollar, the same asset’s rate of return in US dollars is (1.20)(1.05) − 1 = 0.26, or 26%.
The rate of return in British pounds on a share of stock on the London Stock Exchange is 15%. During the same period, the British pound depreciates by 8% versus the US dollar. Find the rate of return on the stock from the US dollar perspective.
Answer: (1.15)(1 − 0.08) − 1 = 0.058, or 5.8%.
A NASDAQ stock’s rate of return in US dollars is 15%. During the same period, the British pound depreciates by 8% versus the US dollar. Find the stock’s rate of return from the British pound perspective.
Answer: (1.15)/(1 − 0.08) − 1 = 0.25, or 25%.
If you multiply the right-hand side of equation (1.1a), you get that ![]() . For purposes of simplification, the cross-product term is sometimes ignored to have a linear approximation. Thus, an often-used linear approximation to equation (1.1a) is given in equation (1.1b).
. For purposes of simplification, the cross-product term is sometimes ignored to have a linear approximation. Thus, an often-used linear approximation to equation (1.1a) is given in equation (1.1b).
Asset’s Rate of Return: Different Currencies
Linear Approximation
![]()
Global CAPM
There is a tendency to think in terms of a separate CAPM for each country: a CAPM in US dollars for U.S. investments, a CAPM in British pounds for U.K. investments, and so forth. This tendency is partly natural and partly based on the not-so-distant past when national financial markets were relatively segmented from each other. But this tendency is a mistake now that the world’s financial markets are substantially integrated. Now we need to think in terms of a common risk–return trade-off for assets in the internationally integrated financial markets, regardless of asset nationality or whether we choose to express the trade-off in US dollars, in British pounds, or in any other currency.
We now introduce the global CAPM, or GCAPM, in which the market index is the global market index. The global market index is sometimes also called the world market index, but technically the global market index contains only globally accessible assets, whereas the world market index also contains assets that are restricted from international portfolios.4 Exhibit 1.2 shows some equity capitalization percentages of the global equity market index (2005).
It is important to see that the composition of the global market index is the same for all investors in the market, regardless of nationality or currency. That is, even though the global market index includes assets from different countries, the index’s composition is the same regardless of which currency we choose to express the index’s return. Just as the rate of return on any asset in the world may be converted between currencies by equation (1.1a), the rate of return on any portfolio of assets, including the global market index, may be expressed in terms of any currency. Many think the best global market index is the MSCI ACWI (All Country World Index), where MSCI stands for Morgan Stanley Capital International.
Exhibit 1.2 Global equity capitalization: Major market percentages (2005)
United States |
55% |
Eurozone |
14% |
United Kingdom |
11% |
Japan |
11% |
Canada |
4% |
Switzerland |
3% |
Australia |
3% |
Source: Campbell, Serfaty-de Medeiros, and Viceira (2010).
One concern about using a CAPM with a global market index is that real-world investors have tended to invest more in assets of their own country than would be advisable, given the benefits of international diversification. This tendency is called home bias. Researchers have been studying home bias, and debating whether it means that local, country-specific CAPMs still have some relevance. At the same time, researchers have also found that home bias has been diminishing. The extent of investors’ international diversification and financial market integration suggests that a global market index is a more appropriate benchmark in internationally integrated financial markets than a traditional local market index.
The GCAPM risk–return relation is the same as the traditional CAPM except that the global market index replaces the local (domestic) market index. Equation (1.2) shows the GCAPM risk–return trade-off formula:
Global CAPM (GCAPM)
![]()
In equation (1.2), ![]() is asset i’s required rate of return, or cost of capital, from the perspective of currency C. The beta,
is asset i’s required rate of return, or cost of capital, from the perspective of currency C. The beta, ![]() is the asset’s global beta, measured using returns in currency C. This beta measures the sensitivity of asset i’s return, adjusted into currency C if a foreign asset, relative to the return in currency C of the global market index. GRPC represents the required risk premium for the global market index, or global risk premium, from the perspective of currency C, which is the equilibrium expected rate of return (or required rate of return) on the global market index in currency C minus the currency-C risk-free rate,
is the asset’s global beta, measured using returns in currency C. This beta measures the sensitivity of asset i’s return, adjusted into currency C if a foreign asset, relative to the return in currency C of the global market index. GRPC represents the required risk premium for the global market index, or global risk premium, from the perspective of currency C, which is the equilibrium expected rate of return (or required rate of return) on the global market index in currency C minus the currency-C risk-free rate, ![]() .
.
The rate of return conversion formula in equation (1.1a) should make it clear that an asset’s global beta and required rate of return expressed in one currency are not the same numbers when expressed in a different currency. For example, the global equity beta estimate for United Technologies Corporation (using 1999 to 2016 data) was 0.94; converting the returns to euros results in a global beta estimate in euros of 0.99. Therefore, we use the superscript symbol to denote that the variables are from the perspective of currency C.
Since the average U.S. market risk premium estimate in Exhibit 1.1 is 5.65%, and the U.S. market index’s beta estimate (versus the global market index) was about 0.94 using 1999 to 2016 data, we use equation (1.2) to infer that an average global market risk premium in US dollars (GRP$) has been approximately 5.65%/0.94 = 6%. For convenience in examples, we will frequently use a global risk premium in US dollars of 6%.
Figure 1.1 shows a diagram for the GCAPM in US dollars. The line is the relationship between risk and expected return in US dollars for assets in the global financial market that are correctly priced (i.e., in equilibrium) in US dollars. The slope of the line is the GRP$, assumed in the diagram to be 6%. The risk–return line intercepts the Y-axis at the US dollar risk-free rate, assumed in the diagram to be 3%.
Using the GCAPM to estimate an asset’s required rate of return is procedurally the same as using the traditional CAPM. Assume that the US dollar risk-free rate is 3% and the global risk premium in US dollars is 6%. Given asset i’s global beta estimate in US dollars is 1.20, asset i’s cost of capital estimate in US dollars is ![]() = 0.03 + 1.20[0.06] = 0.102, or 10.2%.
= 0.03 + 1.20[0.06] = 0.102, or 10.2%.
Assume General Electric’s global equity beta (in US dollars) is 0.69; the US dollar risk-free rate is 3%; and the global risk premium in US dollars is 6%. Find GE’s cost of equity in US dollars with the GCAPM.
Answer: 0.03 + 0.69[0.06] = 0.0714, or 7.14%.
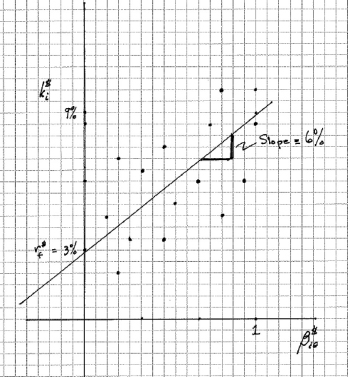
Figure 1.1 Global CAPM (GCAPM) in US dollars
If an asset is correctly valued in US dollars, its expected return and beta will plot exactly on the equilibrium risk–return line. If an asset is undervalued (overvalued), its actual expected return will plot above (below) what the line says the expected return should be for the risk. Misvalued assets are represented as scatter dots off the risk–return line in Figure 1.1. In US dollars, a foreign asset can be misvalued for either of two reasons: (a) the asset is misvalued in its own currency; or (b) the spot FX rate is misvalued. Therefore, the global market index may, in principle, be sometimes misvalued due to an FX misvaluation of foreign stocks in the global market index. Thus, even the global market index can be misvalued and plot off the equilibrium risk–return line.
GCAPM Versus Local CAPM
There are currently no published global equity beta estimates like there are for traditional equity betas (versus a domestic index) at online financial services. Now, the only way to get a stock’s global beta estimate is to do a regression analysis using historical return observations, which is easy on Bloomberg. Exhibit 1.3’s ![]() column shows global equity beta estimates against the MSCI ACWI for a few selected U.S. stocks. The estimated traditional equity betas, called local betas, are shown in the
column shows global equity beta estimates against the MSCI ACWI for a few selected U.S. stocks. The estimated traditional equity betas, called local betas, are shown in the ![]() column for comparison.
column for comparison.
Exhibit 1.3 Global and local beta estimates (in US dollars). Selected U.S. equities
COMPANY |
|
|
EXXON |
0.85 |
0.73 |
GENERAL ELECTRIC |
0.69 |
0.81 |
IBM |
1.03 |
1.19 |
MERCK |
0.54 |
0.63 |
MICROSOFT |
0.85 |
0.97 |
Source: Author’s calculations with monthly rates of return, 2002–2007.
Whether a stock’s global beta is higher or lower than its traditional local beta depends on the drivers of the stock’s returns relative to domestic and international economic conditions. For example, IBM’s global equity beta estimate in US dollars is 1.03 in Exhibit 1.3. This estimate represents the systematic risk of the firm’s equity shares in a globally diversified portfolio. IBM’s traditional local beta estimate for the same period is 1.19. This estimate is for IBM equity’s systematic risk in a diversified portfolio of U.S. stocks only. So, IBM’s stock contributes less risk to a diversified global portfolio than to a diversified domestic U.S. portfolio. On the other hand, Exxon’s global beta estimate is higher than the local beta estimate, per Exhibit 1.3. Exxon’s stock contributes relatively more risk to a diversified global portfolio than to a diversified U.S. domestic portfolio.
It is important to see that the GCAPM typically gives a different cost of equity estimate than the traditional local CAPM. For example, assume the US dollar risk-free rate is 3% and the global risk premium in US dollars is 6%. With IBM’s global beta of 1.03, the estimated US dollar cost of equity for IBM with the GCAPM is 0.03 + 1.03[0.06] = 0.0918, or 9.18%. Using 5.65% for the local U.S. market risk premium, IBM’s estimated cost of equity with the traditional local U.S. CAPM would be 0.03 + 1.19[0.0565] = 0.0972, or 9.72%.
Use the estimates for General Electric’s global equity beta (in US dollars) and local U.S. equity beta from Exhibit 1.3. Assume that the US dollar risk-free rate is 3%, the global risk premium in US dollars is 6%, and the U.S. market risk premium is 5.65%. (a) Estimate GE’s cost of equity in US dollars with the GCAPM. (b) Compare this estimate with the one for the traditional local U.S. CAPM.
Answers: (a) GE’s estimated global equity beta is 0.69. For the GCAPM, GE’s cost of equity estimate in US dollars is 0.03 + 0.69[0.06] = 0.0714, or 7.14%. (b) GE’s estimated local US equity beta is 0.81. Using the local U.S. CAPM, GE’s cost of equity estimate in US dollars is 0.03 + 0.81[0.0565] = 0.0758, or 7.58%.
The IBM and GE examples show that the GCAPM and the traditional local CAPM do not give the same cost of equity estimates. The differences are partly due to the differences between the local and global market risk premium estimates (5.65% vs. 6% in the examples here), and partly due to differences in local and global betas.
A recent study found an average absolute difference of over 90 basis points between GCAPM and traditional local CAPM cost of equity estimates for many U.S. equities for the 1985 to 2012 period. For firms with high (positive or negative) FX equity exposure estimates, the average difference was almost 150 basis points.5
American Depositary Receipts (ADRs) and Dual-Listed Shares
American Depositary Receipts (ADRs) are foreign equity shares directly traded in the United States in US dollars. The foreign office of a depositary, such as Bank of New York Mellon, will hold the actual foreign shares in that foreign country, while the bank’s U.S. office issues US dollar-denominated receipts that are more easily traded in U.S. markets. Stocks traded on both home and foreign exchanges are said to be cross-listed stocks.
The first ADR was offered by JP Morgan in 1927. In 1990, there were only 352 non-U.S. stocks traded on the New York Stock Exchange (NYSE) and NASDAQ. By the end of 2002, the number was more than 850. If one includes over-the-counter and private placement issues, there are now more than 4,300 foreign companies, from 84 countries, with shares traded in the United States. This development reflects the U.S. investors’ appetite for international diversification and the desire of foreign companies to access global capital, broaden their shareholder base, and enhance company visibility. Widely held ADRs include: Vodaphone (U.K.), Baidu (China), Royal Dutch Shell (U.K.), Daimler AG (Germany), and Novartis (Switzerland).
The price of an ADR should, in principle, obey the “international law of one price,” or there will be a relatively easy arbitrage opportunity between the ADR shares and the actual underlying shares, called the ordinary shares. If the ordinary shares of Siemens are priced in Germany at €100 per share at time 0, when the spot FX rate is 1.25 $/€, then the ADRs should be priced at $125 per share in the United States. Otherwise, there would be a relatively easy arbitrage opportunity for traders who have access to both markets. The same reasoning tells us that if the ordinary Siemens shares are priced in Germany at €120 per share at time 1, when the spot FX rate is 1.50 $/€, the ADR price in the United States should be $180 per share. In reality, some pricing differences have been observed in between ADRs and the ordinaries.6
Given no arbitrage opportunity between Siemens ADRs and the ordinaries, an investor in the ADRs would earn the same rate of return in US dollars as an investor in the ordinaries: $180/$125 − 1 = 0.44, or 44%. This rate of return is consistent with equation (1.1a): Since the rate of return on Siemens ordinaries in euros is 20% and the euro appreciates by 20%, equation (1.1a) says that the return in US dollars is (1.20)(1.20) − 1 = 0.44. Ignoring transaction costs and other frictions, there is no difference in whether a U.S. investor holds the actual Siemens ordinary shares or the ADRs. The rate of return in US dollars is the same, as the ADR returns will reflect both returns on an ordinary share and changes in the spot FX rate.
ADRs often trade in a share ratio different from one-for-one. For example, one ADR for Telefonos de Mexico represents 20 underlying Mexican shares, while one ADR for Diageo (a British company that resulted from the merger of Guinness and Grand Metropolitan in 1997) represents four ordinary U.K. shares.
The ordinary shares for Diageo are denominated in British pounds and traded on the London Stock Exchange (LSE). There is one ADR share for every four ordinary shares. At time 0, the price of an ordinary share is £10 in London and the spot FX rate is 2 $/£. At time 1, the ordinary shares are priced at £12 and the spot FX rate is 1.60 $/£. (a) Find the no-arbitrage price of a Diageo ADR share at time 0. (b) Find the time-1 no-arbitrage price of an ADR share. (c) Find the rate of return to a U.S. investor who buys the Diageo ordinary shares at time 0 and holds until time 1.
Answers: (a) An ordinary share is worth £10(2 $/£) = $20 at time 0. Since 4 ordinary shares underlie 1 ADR share, an ADR share should be priced at 4($20) = $80 at time 0. (b) An ordinary share is worth £12(1.60 $/£) = $19.20 at time 1. An ADR share should be priced at 4($19.20) = $76.80 at time 1. (c) Thus, the rate of return in US dollars is $76.80/80 − 1 = −0.04, or −4%.
The proportion of U.S. trading (in ADRs) of a foreign company’s shares varies. Tomkins, a U.K. engineering company has relatively little U.S. trading, but GlaxoSmithKline, a U.K. pharmaceutical company, experiences U.S. trading of about 30%. The larger the percentage of trading in the United States, the more the price is determined in the U.S. market instead of the home market. But in principle, the no-arbitrage relationship should hold regardless of the primary market of price determination.7
In contrast to ADRs, “law of one price” violations have been more regularly observed for dual-listed shares. In a dual-listed shares arrangement, separate but related companies in different countries pay a combined cash flow to the shareholders of the companies. One company’s shares are not convertible into the other’s, but both shares are claims on equivalent cash flow streams.
BHP Billiton is one example of a company with dual-listed shares. BHP Billiton’s shares are held by two separate entities, BHP Billiton Ltd in Australia and BHP Billiton Plc in the United Kingdom. BHP Billiton Ltd’s shares trade in Australia in Australian dollars and have a widely held ADR in the United States, and BHP Billiton Plc’s shares trade in the United Kingdom in British pounds and also have a widely held ADR in the United States. Other companies with dual-listed shares include Investec (South Africa); Mondi (South Africa/UK), Reed Elsevier (UK/Netherlands), Rio Tinto Group (Australia/UK), and Unilever (UK/ Netherlands).
In perfect international financial markets in which there are no taxes, restrictions, or other “frictions,” dual-listed shares should sell at equivalent prices, given the spot FX rate. However, researchers have found deviations from pricing parity in dual-listed shares because the existence of various “frictions” makes perfect, easy arbitrage impossible. These pricing deviations are like those observed between Chinese A-shares and B-shares, where A-shares may only be held by Chinese investors, whereas B-shares may only be owned by non-Chinese investors.8
ADRs and dual-listed shares help us see why it is generally incorrect to use country-specific local CAPMs in a world of internationally integrated financial markets. Say we try to estimate Sony’s cost of equity, both in yen using a local Japan CAPM with an estimate of Sony’s traditional equity beta against a Japanese market index (in yen), and in US dollars using the traditional local U.S. CAPM with an estimate of Sony’s ADR beta against a U.S. market index. The mistake with this method is that nothing ensures the no-arbitrage pricing link between the Sony ordinary shares and the Sony ADRs. Sony’s ordinary shares are effectively the same asset as the ADRs, but with a different currency denomination; this fact implies that the cost of equity from the different currency perspectives should be based on the asset’s systematic risk relative to the same market factor (or factors), but from the different currency perspectives. The GCAPM is based on the idea that in internationally integrated financial markets, assets should be valued using a common risk-return model. Therefore, it would be theoretically more correct to use the GCAPM for both estimations, using Sony’s global equity beta and the global market index from the yen perspective to estimate Sony’s cost of equity in yen, and using the global beta and global market index from the US dollar perspective to estimate Sony’s equity (ADR) beta in US dollars.
It turns out, however, that although the GCAPM may be an OK cost of capital model for the US dollar perspective, the GCAPM may not be as useful from some other currency perspectives, as we’ll explain in the next chapter using a version of the theoretically superior global risk–return model called the international CAPM (ICAPM).
Summary Action Points
• In international finance theory, all assets should obey an equilibrium risk–return relation from the perspective of a given currency, regardless of the assets’ nationalities/home currencies.
• The global CAPM (GCAPM) is similar in form to the traditional CAPM, but the market index is a global market index. An asset’s global beta tends to be different from its local beta.
• In principle, there is a no-arbitrage relation between the price of an American Depositary Receipt (ADR), the home currency price of the underlying ordinary share, and the spot FX rate.
Glossary
American Depositary Receipts (ADRs): U.S. dollar-denominated and U.S. market-traded receipts on foreign-issued shares.
Beta: The sensitivity of an asset’s rate of return relative to the overall market, which is the asset’s systematic risk.
Cost of Equity: The equilibrium expected rate of return as compensation for risk of an equity investment.
Cross-listed Stocks: Stocks traded on both their home and foreign exchanges.
Dual-listed Shares: An arrangement where separate, but related companies in different countries pay a combined cash flow to the shareholders of the companies.
Global CAPM (GCAPM): A simple model of risk and return in internationally integrated financial markets in which the global market index replaces the traditional CAPM market index.
Global Beta: The beta of an asset’s rate of return versus the global market index, measuring the tendency of the asset’s returns to change systematically with the returns of the global market index.
Global Risk Premium: The minimum rate of return over the risk-free rate that investors (in the aggregate) require as compensation for risk in the global market index.
Home Bias: The tendency of investors to invest more in stocks of their own country than would be advisable given the benefits of international diversification.
Local Beta: The beta of an asset’s rate of return versus the local (domestic) market index, measuring the tendency of the returns to change systematically with the returns of the local market index.
Market Risk Premium: The minimum rate of return over the risk-free rate that investors (in the aggregate) require as compensation for the risk in the market index.
Ordinary Shares or Ordinaries: The actual local market shares that underlie depositary receipts trading in another market.
Required Rate of Return: The expected rate of return required as compensation for investing capital and bearing risk.
Problems
1. The rate of return in Swiss francs on a share of stock on the Swiss Stock Exchange is 15%. During the same period, the spot FX rate changes from 1 Sf/$ to 1.25 Sf/$. What is the rate of return on the stock from the US dollar perspective?
2. The rate of return in Swiss francs on a share of stock on the Swiss Stock Exchange is −15%. During the same period, the spot FX rate changes from 1 Sf/$ to 1.20 Sf/$. What is the rate of return on the stock from the US dollar perspective?
3. The rate of return in US dollars on a share of stock on the New York Stock Exchange is 15%. During the same period, the spot FX rate changes from 1 Sf/$ to 1.25 Sf/$. What is the rate of return on the stock from the Swiss franc perspective?
4. Brown & Co.’s global equity beta in US dollars is 1.25. Estimate the cost of equity in US dollars using the GCAPM, given a US dollar risk-free rate of 3% and a global risk premium of 6% in US dollars.
5. Assume the U.S. equity market index has a global beta in US dollars of 1. With the GCAPM, what is the US equity market risk premium, given a US dollar risk-free rate of 3% and a global risk premium of 6% in US dollars?
6. Sony’s ADR shares are traded on the New York Stock Exchange. There is one ADR share of Sony for each ordinary share. (a) If the ordinary shares are priced at ¥3,750 in Tokyo, and if the spot FX rate is 110 ¥/$, find the no-arbitrage price of a Sony ADR share in US dollars. (b) Find the time-1 price of a Sony ADR share when the ordinary shares are priced at ¥4,375 and the spot FX rate is 125 ¥/$?
7. Use information from the previous problem. Find the rate of return to a U.S. investor who buys Sony ADRs at time 0 and holds until time 1.
8. Sony’s ADR shares are traded on the New York Stock Exchange. There is one ADR share of Sony for each ordinary Tokyo share. At time 0, the ordinary shares are priced at ¥4,000 in Tokyo, and the spot FX rate is 80 ¥/$. At time 1, the ordinary shares are priced at ¥5,000 in Tokyo, and the spot FX rate is 100 ¥/$. If there is no arbitrage possible between the Sony ADR shares and the ordinary shares, find the rate of return to a U.S. investor who buys Sony ADRs at time 0 and holds until time 1.
9. CSN (Companhia Siderurgica Nacional, a real company) is a Brazilian steel products company with ordinary shares traded in Brazilian real in Sao Paulo and ADRs traded on the NYSE in US dollars. One ADR is equivalent to one ordinary share. The ordinary share price is currently Re 60 per share. The spot FX rate is 1.60 Re/$. (a) Find the no-arbitrage price in US dollars of an ADR share. (b) If an ordinary share’s rate of return over the next year is -20%, and the Brazilian real appreciates by 10% versus the US dollar, find the rate of return on an ADR share in US dollars.
Answers to Problems
1. The US dollar appreciates by 25% versus the Swissie, so the Swissie depreciates by 20% versus the US dollar. The rate of return on the stock in US dollars is (1.15)(1 − 0.20) − 1 = −0.08, or −8%.
2. Approximately: −15% − 16.67% = −31.67%; Exactly: (1 − 0.15) (1 − 0.1667) − 1 = −0.29, or −29%.
3. (1.15)(1 + 0.25) − 1 = 0.4375, or 43.75%.
4. Using the GCAPM, 0.03 + 1.25[0.06] = 0.105, or 10.5%.
5. Same as global risk premium, 6%.
6. (a) An ADR share is worth ¥3,750/(110 ¥/$) = $34.09.
(b) The new ADR share price will be ¥4,375/(125 ¥/$) = $35.
7. The rate of return in US dollars = $35/34.09 − 1 = 0.0267, or 2.67%.
8. $50/$50 − 1 = 0.
9. (a) Re 60/(1.60 Re/$) = $37.50;
10. (b) 0.80(1.10) − 1 = −0.12, or −12%.
Discussion Questions
1. Discuss the pros and cons of using the GCAPM to estimate a firm’s cost of equity.
2. The actual expected rate of return on the market index is 12% and the risk-free rate is 3%. The market is undervalued. Should you use 9% as the market risk premium in the CAPM? Explain.
3. Why should a foreign stock be in the same risk–return equilibrium as U.S. stocks?