After we finish our robustness diagrams and have a preliminary design review, it’s time to move forward into detailed design. Robustness analysis—preliminary design—is about object discovery. Detailed design is largely about allocating behavior: allocating the software functions we have identified into the set of objects that we have discovered. In this chapter, we focus on the sequence diagram as the central element of detailed design, or at least of the dynamic part of our object model.
Once we’re through doing preliminary design using robustness analysis, we’ll go back through our scenarios and do a second, more detailed pass through the design. We’re going to take another look at our informal first guesses at how these objects collaborate together and make those statements very precise. By the time we get to this point of the project, we should have accomplished two things. First, our use case text should now be very complete, correct, detailed, and explicit. Second, we should have discovered most of the objects that we’re going to need in the system, at least at a conceptual, or idealized, level of abstraction.
Figure 7-1 shows where sequence diagrams reside within the “big picture” for the ICONIX process.
You want to achieve three primary goals during interaction modeling.
Allocate behavior among boundary, entity, and control objects. During robustness analysis, you identify (or at least take an educated guess at) a set of objects that together could accomplish the desired behavior of our use cases. You also break that behavior down into discrete units and create placeholder control objects for each of those units of behavior. Now you need to decide which objects are responsible for which bits of behavior. If you are not certain about what the relevant boundary, entity, and control objects are, it’s too soon to be contemplating how you will allocate behavior. Go back to robustness analysis and make sure.
Show the detailed interactions that occur over time among the objects associated with each of your use cases. Objects interact at runtime by sending messages to each other. These messages serve as what Jacobson calls stimuli—that is, a message stimulates an object to perform some desired action. For each unit of behavior within a use case, you must identify the necessary messages/methods.
Finalize the distribution of operations among classes. You should aim to have a fairly high percentage (perhaps 75 or 80 percent) of your attributes defined within the static model when you finish with robustness analysis. We advocate a minimalist approach to defining operations during domain modeling and robustness analysis. In fact, we recommend that you don’t assign any methods during preliminary design. That’s because there isn’t enough information available with which to make good design decisions about operations at that stage of a project. (Think about it: You haven’t discovered all of the objects until you’ve completed all of your robustness diagrams, and trying to allocate behavior into an incomplete set of objects is going to be error-prone at best.) When you get to interaction modeling, however, you do have good information (at least you hope to). As you lay out the detailed behavior of your objects, on sequence diagrams, in the context of your use cases, you should begin to finalize the process of finding appropriate homes for attributes and operations. While you do this dynamic modeling, you will be updating and expanding your static model, which will solidify your increasing knowledge of how your new system should work.
The UML’s sequence diagram evolved from Jacobson’s object interaction diagram and the event trace diagram from OMT. Within the ICONIX approach, sequence diagrams represent the major work product of design. You draw one sequence diagram that encompasses the basic course and all alternate courses of action within each of your use cases. (You can use more than one page if you need to.) The results form the core of your dynamic model, in which the behavior of your system at runtime, including how the system will accomplish that behavior, is defined in great detail.
There are four types of elements on a sequence diagram.
The text for the course of action of the use case appears down the left-hand side. It’s a good idea to break up the text with white space so that it’s easy to see which sentence(s) correspond with each set of elements to the right.
Objects, which you bring over directly from your robustness diagrams, are represented in rectangular boxes with two names. The name or instance number, and the name of the object’s class, appear in the form object:class. Either name can be omitted. The objects can optionally be displayed with their robustness diagram stereotypes; this is often helpful in keeping track of messages passed among actors, boundary objects, and entity objects.
Messages are arrows between objects. A message arrow can go directly between two dotted lines, between a line and a method rectangle, or between two method rectangles (see below).
Methods (operations) are shown as rectangles that lie on top of the dotted lines that belong to the objects to which you’re assigning the methods. You can use the lengths of these rectangles to reflect the focus of control within the sequence: a particular method is in control up to the point at which its rectangle ends. Unfortunately, focus of control is often more useful in theory than in practice, because most visual modeling tools aren’t very well-behaved with respect to this particular feature. If you find yourself getting frustrated with trying to show focus of control on your diagrams, don’t hesitate to just turn its display off—you don’t want anything to distract you from making good behavior allocation decisions.
It’s been our experience that many people get stuck at this point in a development project. (This is especially likely if they’ve skipped preliminary design.) The technique we describe below evolved from helping students get “unstuck” during dozens of training workshops over the past several years.
Figure 7-2 shows the four steps you perform when drawing sequence diagrams the ICONIX way.
Copy the text for the given use case from the use case specification. Paste it onto the left margin of the page. Copying use case text to begin the corresponding sequence diagram enables that text to serve as an ongoing reminder of what you’re trying to accomplish. The result of this is that when you’re doing the design, the required system behavior is always staring you in the face. Note that if you don’t have all the relevant alternative courses of action written out for each of your use cases, you should not proceed with your sequence diagram. The diagrams will not cover all special cases, and you will not uncover all the behavior of the use case. This means that you won’t discover all of the necessary methods for your objects. (Do Not Pass GO; Do Not Collect $200.)
Add the entity objects from the robustness diagram. Each of these objects is an instance of a class that appears on the class diagram that represents your static model. (If you forgot to update your static class diagrams in response to new objects discovered during robustness analysis, do it now. These objects should have most of their attributes in place. Many of them will be serving data to other objects.) You can expect to discover missing attributes as you work through your sequence diagram. Be religious about adding them to your static model; this is likely to be your last step before code.
Add the boundary objects and actors from the robustness diagram. We didn’t mention adding boundary objects to your domain model because these objects are part of the solution space; the domain model addresses the problem space. By accounting for boundary objects on your sequence diagrams, you begin integrating the two spaces at the start of detailed design.
If you follow the ICONIX approach, the first three steps in drawing sequence diagrams are completely mechanical in nature. (In fact, we’ve reduced them to an executable script that automatically generates a skeleton of a sequence diagram. If you use Rational Rose, you can download a copy of this script from http://www.iconixsw.com/RoseScripts.html. Similar functionality is becoming available for other tools, such as GDPro from Embarcadero and Together/J from TogetherSoft.) Scripts such as this have proven to be very useful in achieving momentum as you get serious about your design. You get an immediate payback in time savings from the work you invested in your robustness diagrams, which can be very useful as you get serious about your design. The fourth step, deciding which methods go on which classes, is the essence of interaction modeling.
Putting methods on classes involves converting the controllers from your robustness diagram, one at a time, to sets of methods and messages that embody the desired behavior. (Occasionally, you might elect to turn a controller into a real control object.) Along these lines, we suggest that you use your robustness diagram as a checklist to make sure you have all the required system behavior accounted for on your sequence diagrams. You simply check off each control object as you draw the corresponding message(s) on the sequence diagrams. This will help you eliminate the “oops, I forgot about that function” error—which, as you might guess, is an insidious one. (Note that one controller on a robustness diagram can translate to several methods on a sequence diagram.)
There are two basic strategies for converting the controllers from your robustness diagrams: “control in the screen” and “use case controller.” If you were to head consistently in one or the other direction during your sequence diagramming efforts across all of your use cases, that would qualify as patternizing. The idea is that the team members who are responsible for the diagrams should establish, early in this task, some design standards that can be used across all your use cases.
Looking in another direction: As you’re diagramming the interactions among the various objects, well-established design patterns, such as those you might find in the Gang of Four book (Erich Gamma, Richard Helm, Ralph Johnson, and John Vlissides: Design Patterns, Addison-Wesley, 1995) would fit in nicely. Or perhaps you might develop new patterns to establish a standardized approach to design problems that appear across multiple use cases. Now is the time to visit your static model and reflect those design decisions on your class diagrams, then draw your sequence diagrams to match. This is where much of real object-oriented design (OOD) takes place.
You’ve already checked the robustness diagrams against your use case text. By checking your sequence diagrams against your robustness diagrams, you add a measure of assurance that you’re designing in response to what the user needs (in other words, meeting your requirements).
The flip side of the principles we just discussed takes the form of a number of common errors that we have seen students make when they’re drawing sequence diagrams on their projects for the first time. Our “Top 10” list follows.

Jacobson provided a straightforward description of the need for interaction modeling in his business process reengineering (BPR) book (The Object Advantage, Addison-Wesley, 1995): “It is only after you have drawn interaction diagrams [called “sequence diagrams” in the UML] for all courses of events in all use cases that you can be certain that you have found all of the roles that the system requires each object to play and, thus, the responsibilities of each object.”

Writing the original requirements-level text for the use case (after “disambiguation” of that text as a result of robustness analysis) in the margin of the sequence diagram provides visual requirements traceability from the design back to your user-certified requirements. The project team will have put a lot of effort into writing the use case text, and the user community should have signed off on the results. The diagram should match the narrative flow of the associated use case.

If you’re having trouble getting a sequence diagram started, you probably wrote the use case incorrectly and/or didn’t complete robustness analysis. Having proper robustness diagrams, associated with rigorously defined use cases, in place makes the job significantly easier.

Each sentence, and each sentence fragment as appropriate, within the use case text should have some white space around it, and each sentence or fragment should line up visually with the message or set of messages that correspond with the specified behavior. This will enable people reading the diagram to easily see how the system will accomplish the what that the use case describes.

It isn’t necessary to show plumbing on robustness diagrams, since they reflect a preliminary design view, but the sequence diagrams serve as the last stop before coding and as such need to show the real design in full detail.

Remember that the sequence diagram is the primary vehicle for making behavior allocation decisions. You’re really using your sequence diagrams to assign operations to your classes as you go, which means that you should not label your message arrows with free-form text, but should instead link the message name to the name of an operation on a class. (In Rational Rose, for example, you make this linkage by right-clicking the mouse on the message arrow; Rose provides visual feedback in the form of parentheses after the operation name. Behavior allocation—deciding which operations belong to which classes—is of critical importance in the ICONIX approach. Decisions made during this phase of a project dictate whether the overall design is good or bad. This is where experienced designers earn their pay.

By exploring the dynamic behavior of the system, you learn which attributes and operations are needed in the classes contained within your static model. To start, add attributes and methods to your classes as soon as you decide where they go in the context of your sequence diagrams. Note, however, that you should not spend much time drawing “getAttribute” and “setAttribute” message arrows on your sequence diagram. However, it’s still a good idea to take advantage of the principle of encapsulation: Only allow access to attributes via “getter”s and “setter”s. You just don’t have to show every “get” and “set” on your sequence diagram. This gets counterproductive because it’s easy for you to lose the flow of the scenario that way.

Messages between objects invoke the operations on the associated classes. Whereas it’s not that important to get the arrows precisely right on robustness diagrams, it’s essential that you get them right on sequence diagrams. The flow of control needs to be explicit; it should be obvious at all times which object is in control.

An object (and, by extension, a class) should have a single “personality,” and you should do your best to avoid “schizophrenic” objects. This means that a class should be focused on a strongly related set of behaviors. This parallels the well-established rules that state that objects should be highly cohesive and loosely coupled. Other principles you should focus on include reusability (the more general your objects and classes, the higher the probability that you’ll be able to reuse those objects and classes for other projects) and applicability (when you assign methods to the objects on your sequence diagrams, always ask yourself whether there seems to be a good fit between method and object, and also whether the task the method performs is obviously relevant to the object.)

It’s nice to keep a “clean” set of domain classes on a pure domain model diagram. However, it’s also a good idea to draw “localized” static class diagrams that show both solution space objects and problem space objects. A good guideline for this is one such diagram per package of use cases. As you come up with scaffolding and other types of infrastructure, such as “helper” classes, put them on the static class diagram, as well. This is where you shift your focus from the problem space to the solution space. It’s best to use localized class diagrams—say, one per use case package—because, by this time, your static model is probably too expansive to be captured within one readable diagram. Doing this also allows work to be split across teams.
The following exercises, which come from the sequence diagrams within the model for our Internet Bookstore, are designed to test your ability to spot the top 10 mistakes that people make during sequence diagramming. Each page with a red label at the top contains three or four of these mistakes; your task is to write corrections on the page near the erroneous material. Following each of these pages is a page with a white label inside a black box at the top; this page contains corrected material and explanations of the top 10 rules that were violated on the previous page. Happy hunting!
On the previous diagram:
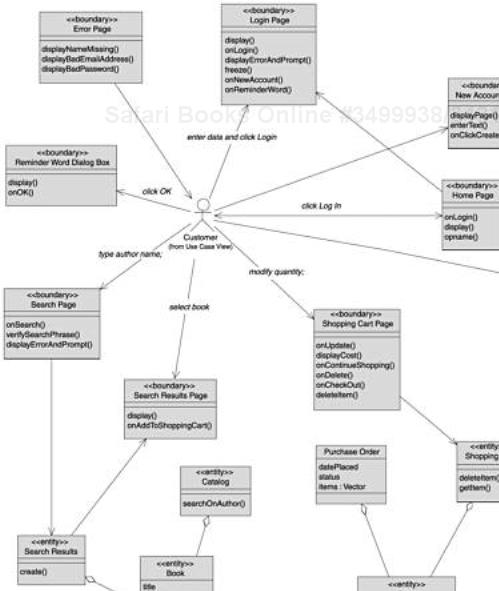
There is no Search Results object. This object would have been identified during robust-ness analysis, since we obviously aren’t supposed to display the entire contents of the catalog. (Note that the case text on that diagram was incorrect as well in this regard.)
The Search Page sent a display message even though the diagram shows that the Catalog is in control.
The Catalog object invokes the displayErrorAndPrompt method on the Search Page.
On the previous diagram:
The use case test doesn’t line up visually with the message arrows.
The Account object sent a display message even though the diagram shows that the Login Page is in control.
The arrow associated with the “reminder word” alternate course has a label, rather than behavior allocation in the form of a method.
On the previous diagram:
The use case text doesn’t appear on the left side.
The Shipper Interface is missing; the fact that the Shipping Clerk talks directly to the Shipper means that the diagram doesn’t show how the shipment gets recorded.
The Sensor object has control, even though this isn’t logical for a sensor in this kind of situation.
On the previous diagram:
The second getItem method call clutters up the diagram.
The Item object sends a deleteItem message to the Shopping Cart object.
There are no destroy messages, which might indicate a hole in the designer’s thinking, since the Items won’t actually get deleted unless the system will be coded in a language, such as Java, that provides for automatic garbage collection).
On the previous diagram:
The use case test doesn’t line up visually with the message arrows.
There is no Order Details object, which would have been identified during robustness analysis, and thus the use case text is wrong, as well.
The Order Table object invokes the displayNoOrderMessage method on the Order Tracking Page. It’s a bad idea to have persistent database tables, or their proxy objects, invoking methods on the user interface.
Figures 7-3 to 7-5 together show a design-level class diagram for our Internet Bookstore. (The classes on the left side of Figure 7-3 match up with those on the right side of Figure 7-2. Figure 7-4 has a similar relationship with Figure 7-3.)