
Chapter 15. Malicious Code Analysis Techniques
“ Practice should always be based upon a sound knowledge of theory.”
—Leonardo da Vinci (1452–1519)
Previous chapters have discussed the different antivirus defense strategies. This chapter gives a short introduction to malicious code analysis, which can provide invaluable information to the defender. Although some of the methods and tools were demonstrated previously, this chapter discusses some of their more interesting aspects.
Some of the techniques described in this chapter relate to reverse engineering of malicious code. Because the relevant law differs from country to country, please be advised to follow your local requirements regarding it. I also regret that not all of the discussed techniques are directly available to readers outside the antivirus research community because some analytical tools have not been commercialized. I have tried to minimize the discussion of these systems, but they are included for the sake of completeness—malicious code analysis techniques could fill an entire book of their own!
The manual process of malicious code analysis is closely related to the automated detection and removal of computer viruses. Furthermore, the Digital Immune System (DIS)1 developed by IBM is discussed and compared to the process of manual analysis.
15.1 Your Personal Virus Analysis Laboratory
One of the most important requirements of malicious code analysis is the installation of a dedicated virus analysis system. It is vital that such systems be connected only to “dirty” networks (other systems that are used for similar purposes). Trust me on this—you do not want to analyze virus code on a production network! A system that is used to replicate virus code should not be used for any other task, and it needs to be restored to a clean state on a regular basis, preferably after each individual test.
There are two basic choices for a dedicated system. I suggest a combination of these:
- The first possibility is based on the use of real systems, such as two regular PCs that can run a set of various operating systems fast enough. The PCs can be restored to a known state from backups. It is important to restore the clean test systems very quickly. I suggest that you use a system such as Norton Ghost to save the images of installed operating systems, such as Windows XP, and restore these from a read-only medium like a CD-ROM. It is best to preinstall your analytical tools on the system, but just in case, keep them on a CD also so you can run them from there if the malware should compromise or delete them on the hard disk.
Note
To analyze most computer worms effectively, you need at least two such PCs. In one particular installation, one of the analysis PCs might run a vulnerable Apache Server on Linux, and another analysis PC might be used to run a worm, such as Linux/Slapper. As the worm scans for new targets, you might be able to log the network activity with a tool such as tcpdump. Then you can reconfigure the network interface of the target system on the fly so the worm will naturally and quickly find and infect it. This technique works effectively if the worm uses linear IP scanning.
- The second option is to use virtual PC software, such as the excellent VMWARE or Virtual PC of Microsoft. VMWARE can run nonpersistent images of guest operating systems. This allows quick, clean restarts of a variety of host operating systems without extra hassle.
Another possible method is to use your own virtual machine based on code emulation and run this on either of the preceding configurations. Good antivirus systems come with virtual machines to emulate modern processor and operating systems. These emulators and their extended versions can be used to build a dedicated virtual machine for virus analysis. Such a tool can be extremely valuable in dealing quickly and safely with antidebugging, encrypted, polymorphic, metamorphic, and packed malicious code. I will illustrate this with VAT (Virus Analysis Toolkit), which we built at Data Fellows in Finland in 1997.
The VMWARE-based method is quickly becoming a standard choice of many researchers. However, certain threats do not work in VMWARE environments. For example, some viruses, such as W95/CIH, which were highly successful in real environments2, fail to work on VMWARE. Furthermore, the virtual environments can be detected by the malicious code, which might act against it. Nevertheless, VMWARE is an invaluable test environment, and I strongly suggest that you buy it. It will pay for itself by reducing the overall hardware cost—and it makes the process of returning to a clean state much faster.
VMWARE also has network-oriented versions, such as VMWARE GSX Server. GSX Server allows you to run a single VMWARE server, which can have several network clients running images from it at once.
In VMWARE, you can even have your own DNS server and define systems with the names of real companies. This means that you can capture a DoS attack in action against www.microsoft.com, for example—all in the virtual world.
The goal however, must be the easy administration of such a system. An overly large system is very difficult to manage. Another problem appears because many of the modern threats are vulnerability-dependent. Thus if you only have images that are patched, some computer worms will not work on your system. This can become painful, because the installation of VMWARE environments can take more time than the installation of real systems. The solution is the preparation of a diversified set of VMWARE images with software that is commonly attacked by malicious code. Different flavors of Microsoft IIS servers and Apache servers are a good start, but you cannot experience computer worms such as W32/CodeRed or Linux/Slapper without installing the vulnerable software that is exploited by a particular worm.
In Chapter 3, “Malicious Code Environments,” I illustrated that malicious code can depend on a particular environment. To analyze a particular class of computer viruses, such as macro or script viruses, you need the appropriate client software installed, such as Microsoft Office systems. Similarly, more and more malicious code will be written in MSIL, which currently requires the .NET Framework to be installed to run on most Windows systems. I also pointed out in Chapter 3 that some threats depend on the actual file system of a particular target operating system. For example, if you only have FAT systems, viruses that use NTFS streams3 cannot work completely (or at all) on your dedicated system. Thus you need to take care of the diversification of the environments at all levels, from the appropriate hardware to the necessary software.
15.1.1 How to Get the Software?
Systems like this can become rather expensive to build. You can limit yourself to operating systems that are free or cheap, but you also need the environments in which most malicious code currently operates at large, and nowadays that is the Windows platform. Where can you find the systems to install, then? A subscription to MSDN is definitely a good start. Microsoft will send you all the environments you ever need to analyze malicious code on Windows platforms. For instance, if you need a vulnerable version of Microsoft IIS, you will have it in MSDN. Need a release of SQL Server 2000 installation for another worm or exploit to analyze? You've got it in MSDN.
Beta programs to new operating systems are another effective way to get involved in new environments more quickly. Using betas allows you to gain a better understanding of the operating systems early on. In fact, if you are fortunate, you might work for the IT response team of a large corporation. In such a situation, you often get access to new hardware environments, such as 64-bit Windows operating systems on the IA-64 platforms, letting you research platforms earlier than the bad guys. Taking a look at beta boards and OS versions gives you the knowledge you will need when the threats to such platforms become real. It is always good to be ahead of time, learning as much about new platforms as possible. The more you learn about such environments, the better your chances of analyzing applications written for them. It is the environment—not the malicious code—that is the difficult part to understand.
15.2 Information, Information, Information
To succeed in computer virus analysis, you need good, thorough documentation about system architectures and operating systems, as well as other interpreted environments around you.
15.2.1 Architecture Guides
Architecture guides, such as the Intel Architecture Software Manuals, provide you with vital and detailed information about the low-level programming of Intel processors. This can help you to understand binary code on a particular platform faster. Evidently, you need to extend this list in the future as more threats target the new platforms such as ARM and EM64T (IA32 with 64-bit extension) as well.
• For Intel IA32: http://www.intel.com/design/mobile/manuals/243191.htm. This will give you the Intel Architecture Software Developer's Manual, Volume 2: Instruction Set Reference.
• For Intel IA64: http://www.intel.com/design/itanium/manuals/iiasdmanual.htm.
• For AMD 64: http://www.amd.com/us-en/Processors/DevelopWithAMD.
• For SPARC: http://www.docs.sun.com/db/doc/816-1681. This gives you details on the Intel Architecture Software Manuals assembly; the documents also contain valuable information on the ELF format.
15.2.2 Knowledge Base
A knowledge base on operating systems, networking, programming, and security is also vital to success. In the past, the Ralf Brown interrupt list was the Bible of DOS virus analysis4. Nowadays, the MSDN API libraries are among the most valuable when it comes to the Win32 worms. I also recommend that you visit sites, such as Sysinternals (http://www.sysinternals.com), that give you further information and tools for Windows and Linux.
Over the years, I have collected a small library that includes over a hundred great books on computer programming, operating systems, and computer security. For example, I strongly recommend books such as the Gary Nebbett's Native API, which is very useful in understanding more about the internal details of NT-based systems. Gary's work on the operating system internal structures is truly artistic; in fact, it is so good that several people believed that he had direct access to the source code of the operating system. (I believe that Gary used checked-builds of the operating system, which have extra symbol information about the OS modules.)
Unfortunately, many other excellent books on Windows internals, such as Matt Pietrek's Windows 95 System Programming Secrets, are out of print, but you might be able to find copies of such works used or on eBay (possibly paying several times the price of the original). I also suggest that you get familiar with the various SDKs and DDKs of the platforms on which you analyze code. Often the included files hidden in such developer environments are the only means by which to translate the parameters of the function calls into plain English. Sometimes a particular DDK or SDK is accidentally released with some treasure. For example, I found a copy of the zwapi.h file in a DDK release. Sure enough, two hours later Microsoft released a new DDK that no longer included it.
The winnt.h file in Microsoft SDKs contains a lot of up-to-date information about the PE file format. Unfortunately, some file formats are documented partially or not at all5. For example, the Windows VxD format was never officially documented by Microsoft. On the other hand, the ELF file format of UNIX systems, like Linux, is extremely well documented. All in all, your analysis will be only as good as your education in such matters. You need to stay hungry for good information.
15.3 Dedicated Virus Analysis on VMWARE
VMWARE lets you carry a mobile virus research system with you wherever you go. Since I got my first computer more than 20 years ago (a C64), I always carry machines with me. This is likely the reason why I have five notebooks; I could never really get used to traditional workstations.
The cool part of VMWARE is that it can run Linux flavors, as well as server versions of operating systems in networked mode. Back in 2000, Ian Whalley introduced VMWARE to me during one of my visits to IBM's Watson Research Labs. Ian conducted research for the Digital Immune System, and he found that VMWARE was an excellent foundation for automated analysis of malicious code6. I was hooked immediately!
Figure 15.1 shows a loaded Redhat guest operating system with several parallel guests, such as MS-DOS, Windows XP, and Windows 95.
Figure 15.1. VMWARE with a loaded Redhat guest on a Windows XP host OS.
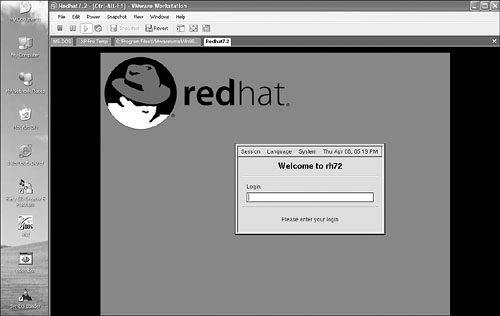
Typically, I run VMWARE in host-only mode, so the guest operating system can “see” only my dedicated virus analysis system. You need to be careful because VMWARE can access shares on the host operating system, which is one way malicious code can jump out of the box of the virtual system. A safer option is to connect VMWARE images only to a virtual network or turn off network support completely.
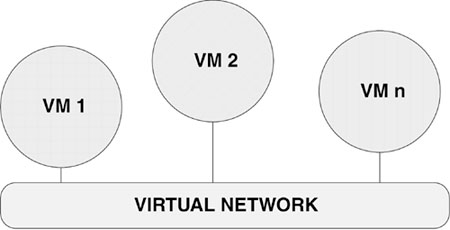
VMWARE allows you to spare some machines for other uses, and you can even implement networking among the guest operating systems via a bridged connection on a local network, as shown in Figure 15.2. This makes it possible to run a single system to analyze a computer worm easily. Do not forget that the correct set of images is only the beginning of your analysis.
Figure 15.2. A set of virtual machines on a virtual network.
In advance configurations, you might want to consider using Honeyd (http://www.honeyd.org), as well as a DNS server that forwards traffic to a Honeyd system. For example, you can simply configure Honeyd to emulate the “personality” of a Windows XP system running an SMTP server service. Such a configuration allows you to test-replicate an SMTP worm, even if the worm uses a list of hard-coded IP addresses. This is because the worm connection attempts will be successfully resolved. In fact, Honeyd emulates the personality of systems so well that even advanced network discovery tools, such as NMAP7, will believe they have found a real target.
Although simulated network services are great for dealing with the majority of simple computer worms, complete testing of worms often requires vulnerable installations. However, Honeyd can be configured to use real system services instead of emulated services only. In the case of worms such as CodeRed, natural infections can be achieved more quickly with this method. On the other hand, worms such as Linux/Slapper are extremely sensitive to such manipulations because the heap layout of the vulnerable target process might be destabilized by the extra traffic caused by too many IP addresses forwarded to the same server. In such cases, reconfiguration of the network interface is the only easy option, as I explained earlier.
15.4 The Process of Computer Virus Analysis
From the point of view of analysis, no computer viruses are exactly the same. This is why computer virus research will remain an art, even in the future. While new classes of computer viruses appear, the existing classes always extend to thousands of copycat creations. This helps the analysis process because individual classes of computer viruses can often be analyzed using the same strategy.
15.4.1 Preparation
15.4.1.1 Quick Examination
The first step in the analysis process is the quick examination of the suspected object. Nowadays, most computer viruses will arrive in an executable file format, as macros in documents or as scripts. Often computer worms use a combination of all of these objects.
This step involves the recognition of known clean files. Antivirus companies maintain a large database of clean objects by their MD5 hashes, for example. There is no good reason to spend time with a calc.exe of Windows XP if you know the file was released in clean form.
I also use special tools such as Dmitry Gryaznov's Dustbin, which recognizes standard known clean files as well as corrupted viruses that other researchers have encountered in virus collections. Over the years, Dmitry has created several custom tools for AV researchers, such as Symboot, which can simulate a disk boot sector using a file image. Another tool to deal with boot sector recognition is Igor Muttik's Boots program, which recognizes several hundred clean boot sectors using checksums. Such tools can help the filtering process dramatically.
15.4.1.2 Filtering
The second step involves filtering with a single antivirus scanner or set of scanners. If any antivirus program finds something in the object, the malicious code might be already known or might be a possible variant of the same threat. In other cases, a heuristic detection is triggered, which can help to suspect real infections (but it also can be a simple false positive that needs further confirmation).
Classification tools such as VGrep (originally developed by Ian Whalley and currently developed and maintained by Dmitry Griaznov) can help to check the cross-referenced name for known malicious code. For example, I can check whether a file detected as W32/Nimda.A@mm might be known to other antivirus software under a different name, as shown in Table 15.1.
Table 15.1. Sample Output of VGrep
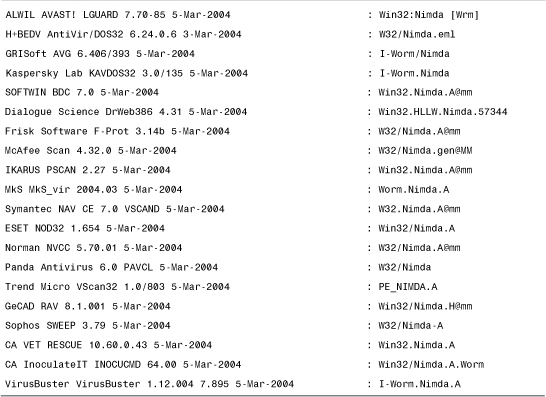
Such classification can help to reduce confusion and make it easier to connect a particular sample with existing information in antivirus databases.
Another interesting tool, called MIRA (Macro Identification and Resemblance Analyzer), was developed by Costin Raiu for macro virus classification. MIRA uses a neural network to compare new macro virus variants to previously seen macro viruses known to a neural network by training. For a given input sample, MIRA shows the percentage of similarities and the name of the virus related to the similarity score. For example, when a sample of W97M/Pri.Q is given as input, MIRA produces the output shown in Table 15.28.
Table 15.2. Output of the MIRA Tool on the W97M/Pri.Q Virus
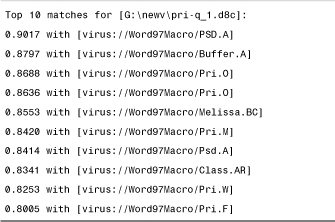
Interestingly, the first hit is W97M/PSD.A. This is because Pri.Q uses the same polymorphic engine and graphical payload as PSD.A. However, viruses are primarily classified according to similarities in their replication code, not according to features like a polymorphic engine or payload. Not surprisingly, MIRA finds these similarities, just as a human researcher would who was familiar with the PSD virus. The second hit is Buffer.A, which contains the mass-mailing routine of Pri.Q. And of course, there are several Pri variants displayed, which should be a good indication that this virus belongs to the Pri family.
Similar classification tools are in development for Win32 worms to help researchers to classify attacks better without knowing each and every virus variant inside and out. I nicknamed one of these systems VOOGLE at Symantec. VOOGLE is a search engine to find strings in computer worms based on unpacking, string dumping, and preindexing to help classification. Neural network-based correlation tools are also in the works, using an approach similar to MIRA's.
15.4.1.3 Weeding
The third step involves weeding of the files awaiting analysis. Some worms are possibly corrupted, for example, so the end of the worm file is missing. In the weeding step, researchers eliminate corrupted objects as junk. In some cases, however, this kind of junk requires identification. Under certain circumstances, computer worms fail and send corrupted copies of themselves. This can easily flood mailboxes with spam. Therefore, the detection of junk might be important, but this is preferably reflected in the name of the threat.
15.4.1.4 Quick Examination of Virus Code
The fourth step is the quick examination of the suspicious objects for the usual locations of virus code. I typically do this step with a simple binary (hex) viewer. I quickly identify the type of the object. If the object is a PE file, for example, I will see an MZ mark in front of the file, followed by a PE signature and some section names, such as .text, .data, and so on. For example, when I view NC (NetCat) in the HIEW9 tool, I know that I am dealing with a 32-bit Windows application, as you can see in Figure 15.3.
Figure 15.3. The header area of the NC (NetCat) tool in HIEW.
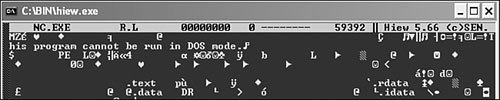
In this step, I also look around in the file, searching for copyright messages. The file information section often reveals some known company names, so I can suspect whether or not the file is a known clean program. In some cases, the malware uses misleading information to make you believe that it is a known clean program, so additional steps are required to make sure that the file is really clean. (In addition, adware and spyware might be written by completely legitimate companies.)
In many cases, however, this step helps you to find out whether the object is a commercial application, so you might have a copy of the same application somewhere. This lets you compare the two copies with a tool such as FC (File Compare) to check whether the two files are the same.
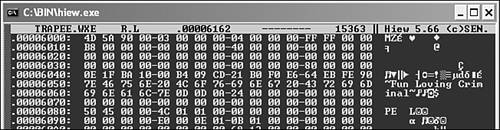
During this step, I also check the end of the file. Because most computer viruses append themselves to the end of the file, they can be quickly located there. For example, the W32/Funlove virus appends a complete PE executable to the end of infected files, so you will find two MZ headers in the image, with a surely suspicious message, as shown in Figure 15.4.
Figure 15.4. The tail section of a Funlove-infected file in HIEW.
In the same analytical step, I use a file dumper tool that understands the actual file structure in question. For example, I can use PEDUMP10 to dump and check the internal structure of a PE file, or I can use elfd to do the same with an ELF file from a UNIX system. This step can reveal structural problems with the objects, such as the fact that the image starts in the last section instead of the code section. (I already discussed such static heuristics methods earlier for the use of antivirus engines.)
15.4.1.5 String Dump
Another important step is to dump strings of the analyzed object with tools like “strings.” Be sure to use tools that know about Unicode strings. You will realize when you deal with a script malware that you can read its code easily in most cases, unless it is encrypted. In that case, you need to decrypt it first. Similarly in binary files, strings can often reveal entire sections of suspicious information, but these also can appear in packed and encrypted forms. Consider the snippet shown in Listing 15.1 after a string dump of the Nimda worm.
Listing 15.1. A String Dump Section of the Nimda Worm
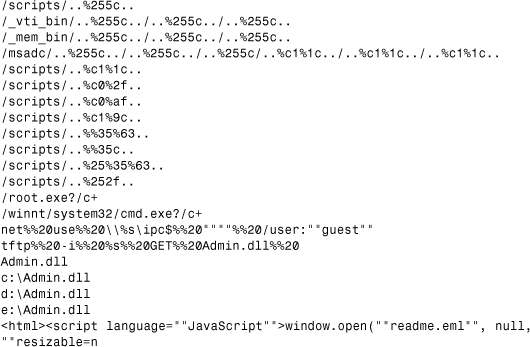
The constant strings in malicious code can be extremely helpful in figuring out quickly some aspects of the code's inner details. In the string dump shown in Listing 15.1, you can see the Web-traversing exploit and other commands, such as NET USE and TFTP, that propagate a DLL called admin.dll. Furthermore, it is clear that admin.dll is most likely copied to drives c:, d:, and e:. You also can see that a file called readme.eml will be launched with JavaScript inserted into HTML files. You might bet that readme.eml contains encoded malicious code—you're right!
It is a good idea to filter the extracted strings with a tool. Alternatively, you can use simple manual steps and look for strings one by one. I typically start searching for executable extension names using strings such as .EXE, .SCR, and .PIF, as well as other strings near places where I have found executable extensions. You can even use grep to filter the output of strings using such keywords or those associated with some network protocol. For example, you can look for MIME, From:, and @ marks to see whether you are dealing with a possible mass-mailer worm.
This step might not be immediately successful if the malicious code is packed or encrypted. The number of 32-bit standalone computer worms has increased dramatically over the last few years. By 2004, about 95% of 32-bit computer viruses belonged to a class of network worm, and 90% of them were packed with UPX, ASPACK, and similar wrappers. This dramatic turn has great influence on current analysis trends. Thus it is vital that you know methods that can deal with packers and encryption.
15.4.1.6 Disassembling
I also use a disassembler, such as IDA, to check the application's code quickly near its entry point. This can help show whether there is any unusual, hostile code at that location. As I explained in Chapter 4, “Classification of Infection Strategies,” several viruses use a powerful EPO technique to hide their invocation in the executables. However, most EPO viruses still append themselves to the end of the file. Thus 95% of the time, the entry-point code, the top, and the tail of the file will reveal something important about the object—but to be sure, you need to check everything carefully.
15.4.1.7 Black-Boxing
If there is a sign of malicious code, the next step should be focusing on running and monitoring the malicious code on a test system. In the case of viruses, this step requires the proof of recursive replication in the form of newly infected objects that also cause infections when executed. Some researchers prefer to start with this process, using a simple “black box” monitoring process. However, they might jump to the wrong conclusions if they do not understand at least partially the intentions of the malicious code. Thus I prefer to perform a quick analysis first, run the malicious code on the dedicated system, and then return to detailed analysis as the last step. In my experience, this makes the analysis process more efficient.
15.4.2 Unpacking
I mentioned previously that currently 90% of the 32-bit computer viruses belong to a class of computer worms that are packed with some sort of run-time packer, such as UPX or ASPACK. Unfortunately, the majority of run-time packers do not support unpacking back to an original file; instead, they unpack applications only in memory when the packed application is executed. Obviously, malicious code creators take huge advantage of this fact because they can hide the intent of their code under the packing or even under layers of encryption using a similar wrapper. Furthermore, packed worms might become more virulent when smaller because they require less data to travel over the wire for each penetration. Another advantage of packing, from the attacker's perspective, is that it might be able to reduce the effectiveness of some deployed protections, increasing the chances for a successful attack.
For example, UPX supports both packing and unpacking. The UPX -d command will decompress UPX-packed executables. In some cases, however, UPX might not restore the application 100% to its original form. Nevertheless, when the unpacked content is available, you can try out one of the previously mentioned strategies, such as dumping strings of the executables first. You can often recognize UPX by looking at the file headers and checking for section names that contain “UPX.” Normally, the UPX-packed executable will have only three sections. Most of the regular programs typically have at least four sections.
Note
Some attackers might change the section names to something else, but you can still recognize the packer by looking at the entry-point code in a disassembler.
The problem arises when you deal with a packer that does not support unpacking or when you encounter a slightly patched version of the packer (or wrapper). Indeed, attackers often change the run-time packer a little, and thus the unpacking routine does not recognize the packer and fails to work. In such cases, you have the following options:
• Debug the code on your dedicated machine.
• Dump memory of the malicious process to a file.
• Use a custom-made tool that emulates or unpacks code natively.
Typically, security response teams use custom-made tools that support all the common packers and wrappers, but such tools are not necessarily available to you. Thus you need to perform a dynamic analysis of the threats, which includes running the malicious code on your dedicated system and monitoring its actions.
It is often difficult to figure out what kind of wrapper is used on a file. Tools such as PEID attack this problem by using signatures to detect the packer. Unfortunately, PEID is not an official tool and is associated with the hacking community. I definitely do not recommend that you use such tools on a production system, but you can give them a shot on your dedicated research system. PEID can identify nearly 500 different wrapper variations, which can be a helpful start in getting familiar with them.
Note
Always beware what you download and use from the Internet. Even professional tools are often Trojanized. So be advised! In addition, some unpacker programs might run the code in order to unpack it. Such unpackers can execute malicious code as a result of unpacking, so you need to be careful.
As a best shot, you can attach a debugger such as TD (Turbo Debugger) or OllyDBG (both of them are free debuggers) to a running process and dump the process address space yourself. This trick can help you to deal successfully with encrypted and polymorphic code.
15.4.3 Disassembling and Decryption
A disassembler-based analysis is the most powerful method to gain information about binary malicious code. As explained previously, most computer viruses insert themselves into the execution flow near the entry-point code. Today, most computer viruses are written in high-level languages such as Delphi, C, Visual C, or Visual Basic, as opposed to the traditional art of malicious code that is written in Assembly. Nevertheless, Assembly knowledge is a requirement for performing analysis of such threats.
Several chapters of this book include disassembly snippets that were extracted from computer viruses using the IDA disassembler. Eugene Kaspersky introduced me to IDA in late 1997. Eugene was laughing, looking at my “medieval” methods, saying, “Peter, you do the right thing, but five times more slowly than you could with better tools.” Indeed, I used to comment malicious code in plain-text files. That was a lot of hard work! This process required renaming each variable, one by one, throughout the code without any cross-references.
By the early '90s, fairly good automated disassembler tools existed to analyze code, such as the powerful Sourcer. However, these tools were often limited by not allowing manual analysis to take place parallel to the automated disassembling. Fortunately, IDA (Interactive Disassembler) came to our rescue. IDA was originally developed by Ilfak Guilfanov and built further at Pierre Vandevenne's company, Data Rescue, in Belgium. I met Pierre in 1995 at a computer virus-related conference. Our meeting was not accidental. Pierre is extremely knowledgeable about computer viruses, related defenses, and data recovery. As a result, IDA incorporates many features that help to analyze malicious code, but it also accommodates the needs of professional developers.
IDA lets you rename variables that will be cross-referenced under the new name throughout the code. This saves so much time for better things! IDA recently became a user-mode debugger, which extends IDA's use to professional developers. IDA supports many processors perfectly and contains both command-line and GUI-based versions to fulfill all needs.
Note
Be careful. For a number of reasons, you can accidentally run the code instead of disassembling it. You can configure IDA to disallow debugging.
IDA stores the disassembly in its own custom database format. This speeds up the process after an application has loaded. The loading process can take from a few seconds to a few minutes, depending on how large the analyzed code is. You do not have to wait until it has finished completely, however; you can start to analyze the code as new things are cross-referenced and tagged in the background by IDA's powerful signature recognizer.
IDA can parse and load a variety of executable formats, including ELF, which makes it perfectly suited to analyze malicious code written to run on UNIX platforms.
For example, with IDA you can quickly jump to the “.data” (constant data) section of a computer worm in a PE executable. This can show you the constant strings, such as those that I extracted from Nimda earlier. By getting to the constant data first, you can take advantage of cross-references built by IDA to go to the location where the constant is used by the code. In this way, you can focus on the important areas of the code first, instead of the unimportant areas that might contain library code. For example, a Delphi-written application might be 90% library code. It could be a frustrating exercise to read the library code for hours. Fortunately, IDA helps to eliminate this pain, using so-called flirt signatures.
A very powerful reverse-engineering technique involves pattern matching. As you look at more and more executables, you slowly train yourself to see what is usual and what is unusual; soon, you begin to recognize the difference. IDA extends your abilities greatly by using signatures for library code identification. This can help tremendously by speeding up the static analysis process. It lets you focus on the “handwritten” code instead of the library code. Over the years, I have developed a very sensible eye, and some people who stand next to me never understand how I can deal so quickly with viruses. This is because I use the pattern-matching technique first, I theorize about what the malicious code might do, and then I prove whether each possible theory is right or wrong. For example, if I can recognize a routine that maps an executable file, I see a possible infection routine around it that might be code a few kilobytes long—thus a large piece of the code is clear from the structural point of view. This process goes on until I can only see areas that I cannot put into any categories. These “unclassified” areas typically contain new tricks that need close attention.
Not all researchers analyze viruses in this way, but interestingly enough, Alan Solomon (author of the scanning engine acquired by NAI) had a similar tendency, which often surprises people who have had to read the code instruction by instruction to make sense of it. Of course, even Alan and I analyzed code from instruction to instruction when we were new to the field. The trick is to develop this ability to keep the need for detailed interpretations to a minimum—but still know everything important about a particular threat. I hope you can follow the basic principles I explain in this chapter and get going earlier than we could as young researchers. There was nobody to tell us how to do this kind of research; we simply improvised as the threats evolved.
Figure 15.5 is an IDA disassembly of the W32/CTX virus of GriYo. CTX is polymorphic, so it needs to be decrypted first. Furthermore, the virus is attached to applications. Because the virus code rebases itself according to the position of the file, the variable labels would not match perfectly if the virus were simply loaded into IDA. This is why we typically cut the virus body into a standalone file in decrypted form and load it as a binary object back to IDA, carefully adjusting the base address in such a way that the variable labels match. This reduces the need to calculate manually the offset of every variable one by one.
Figure 15.5. IDA with a disassembled CTX virus.
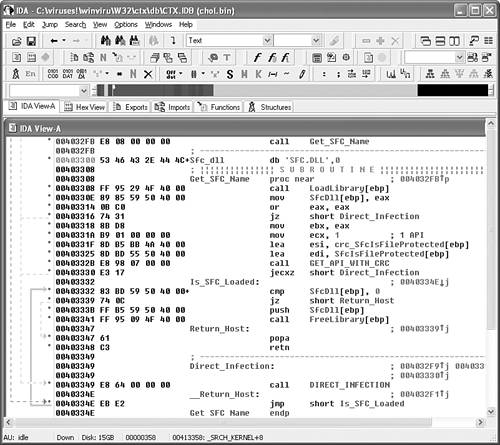
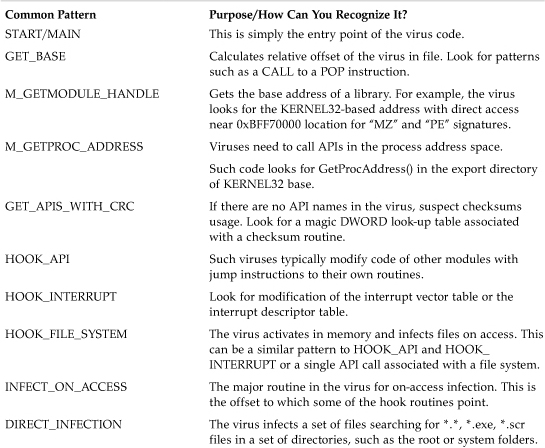
I explained earlier that I typically look for common patterns in the code that I can put into a class. For example, in Figure 15.5 you can see a Return_Host label that marks code that viruses use to run the host program. Another example is DIRECT_INFECTION, which I use to label direct-action infection routines. Table 15.3 shows a possible set of generic routines in viruses that can often be found based on common patterns in them. I typically look for these common patterns, which I can associate with code or data snippets. This kind of analysis needs a little experience, but it should give you an idea about where to start.
Table 15.3. Common Patterns in Computer Viruses
Powerful tools are programmable—as is IDA. IDA can execute IDA command script (IDC) files, which can be very useful for several reasons. For example, IDC files can be helpful in dealing with encrypted code. Because the CTX virus is polymorphic, it is encrypted in infected files. To analyze it, you need to decrypt it first. CTX is a heavyweight polymorphic, which is easy to deal with in a user-mode debugger.
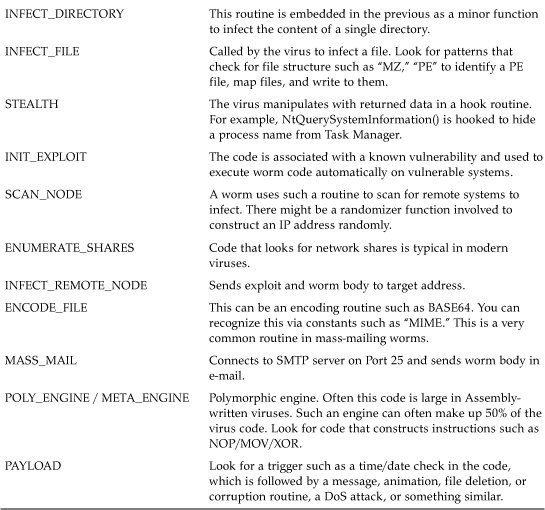
Take a quick look at the decryption routine of the virus. If it is simple enough you can implement it in an IDC file, such as the one shown in Listing 15.2. Note that some viruses such as Sobig use complicated ciphers such as DES to encrypt data in which case it is impractical to rewrite the cipher in IDC.
Listing 15.2. A Very Simple Decryption in IDC
The code in Listing 15.2 uses the SelStart() and SelEnd() IDC commands to get a selected range of bytes that first need to be highlighted in the IDA UI. Then the script decrypts each byte in the area by subtracting 1 from each byte. Finally, it uses the PatchByte() command to replace the byte in the loaded IDA database with the decrypted byte.
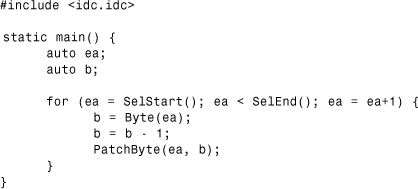
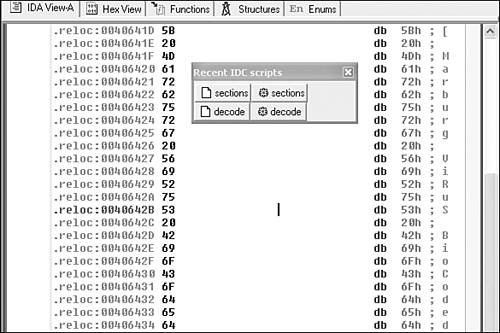
Consider the snippet of the W95/Marburg virus shown in Figures 15.6 and 15.7. In the simplest case, Marburg encrypts each byte of the virus body with a single byte. Thus the previous simple IDC decryption routine will work perfectly against an instance of W95/Marburg encryption. Figure 15.6 shows an encrypted area of the Marburg virus. I load the IDC scripts that I need, such as the simple decryption command file shown in Listing 15.2, which I called decode.idc. Next, I highlight the area that I want to pass to the decrypt function. Finally, the virus is decrypted, and the IDA database will have the decrypted bytes stored in it, as shown in Figure 15.7.
Figure 15.6. An encrypted snippet of the Marburg virus.
Figure 15.7. A decrypted snippet of the Marburg virus.
Such manual decryption can be performed in other tools, such as the excellent shareware HIEW (Hacker's View) program of Eugene Suslikov, which was intended to be used as a Norton Commander plug-in. I learned about HIEW from Vesselin Bontchev in 1996. As Vesselin pointed out, HIEW can deal with simple encryption, but it is limited in a number of ways. For example, it can only decrypt the contents of the active view, so its decryption process is rather slow. Nevertheless, it is an excellent way to deal with most simple encryptions that use 8 or 16 -bit keys.
Figure 15.8 shows a Marburg virus–infected goat file loaded to HIEW with a decryption command dialog on top. This dialog can be used to enter commands listed on the right side of the dialog box. For example, a sub al, 1 instruction means to load a byte from the active cursor position to the AL register and decrypt it by 1, write it back to the active position, and continue with the next byte. Figure 15.9 shows a partially decrypted Marburg virus using HIEW.
Figure 15.8. The decryption dialog of HIEW.
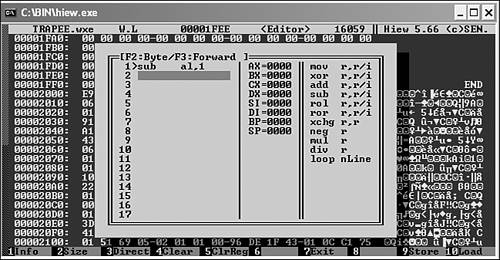
Figure 15.9. A decrypted data snippet within the Marburg virus.
![]()
15.4.4 Dynamic Analysis Techniques
So far, we have looked at static analysis techniques that can be performed without running the malicious code on a dedicated system or inside a virtual machine. Dynamic analysis techniques focus on black-boxtesting . Black-boxing techniques can be very helpful in understanding some functionality of the malicious code quickly, such as the replication of viral code from one object to another. However, such methods can lead to frustration if they are not combined with disassembling and detailed analysis of the type of virus code in question. Only detailed analysis can reveal the entire functionality of malicious code. Gather the output of black-box techniques and use it with caution. By running the malicious code on the dedicated system, you can monitor several aspects of the code, and then you can match these patterns in the disassembled object more quickly.
In this section, I will discuss monitoring of malicious code based on the following techniques:
• File-change monitoring
• Goat file–based analysis
• Registry change tracking
• Process and thread monitoring
• Network sniffing and capturing
• System call tracing
• Debugging
• Code emulation
Sysinternals provides a set of excellent utilities written by Mark Russinovich and Bryce Cogswell that can be used to demonstrate most malicious code–monitoring techniques. I have recommended Mark Russinovich's excellent work for several years. Recently, Mark coauthored a book with David Solomon on Windows 2000, XP, and Server 2003 internals and became a world-renowned expert on Windows systems.
A similarly useful integrated tool called VTRACE is available for Windows NT/2000 and can trace many aspects of the system, including the system calls and Win32 calls. VTRACE is available at http://www.cs.berkeley.edu/~lorch/vtrace. It integrates the file system logging feature of the Sysinternals tools and traces all activities on the system, including those related to the network.
15.4.4.1 Monitoring File Changes
Because most viruses change files stored on the file system, a great way to analyze their behavior is to execute them on the test system and monitor the file changes. There are several possible ways to do such analysis, but I want to concentrate on techniques that are available to you immediately. We will start with the Filemon tool from Sysinternals. This tool loads a kernel-mode filter driver, which gets attached to the file systems. The advantage of this is that file monitoring is very accurate. File monitor can show you all file system events. Alternatively, you can focus the tool to monitor the file system events related to a particular process. This is a good idea to reduce the information in the log, but it can hide some information that you might want to see. If you do not filter the output of Filemon, you will see a lot of activities, so you need some experience to process the log.
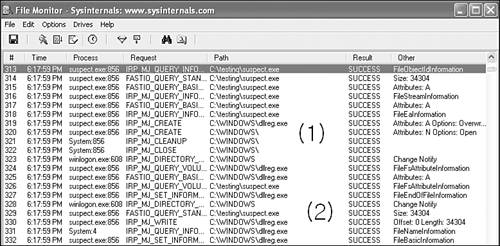
Consider the File Monitor log shown in Figure 15.10. As I run a variant of the Dumaru worm as suspect.exe, I see that it creates files such as dllreg.exe in the Windows directory (see Figure 15.10/1), and it copies the content of suspect.exe to this new file (see Figure 15.10/2) for 34,304 bytes.
Figure 15.10. The Dumaru worm copies itself to the Windows folder as dllreg.exe.
Such an event gives you a very good idea about what a virus might do on the system. For example, you can see whether or not it adds the same bytes to all infected programs. You also can see the errors. For example, if the virus looks for an executable with a particular name, you will be able to see this request. This is a big advantage of dynamic file monitoring systems.
In the next example shown in Figure 15.11, you can see a Dumaru-infected notepad.exe. Dumaru infects files by placing the original content of its host into an alternative data stream called STR and overwriting the content of the main stream with itself. I see the write event to notepad.exe with File Monitor, and then I can check for the streams using the write application.
Figure 15.11. An infected notepad.exe, with the content of the host in a stream.
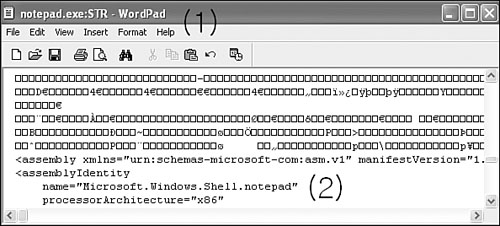
The command “write notepad.exe:STR” shows that the notepad.exe:STR stream indeed exists in the host file. When I browse the content of this stream, I find the content of the original notepad.exe, shown in Figure 15.11/2. Please note, the only reason I do not show you the header of this file (starting with the MZ marker) is to make it clear that we look at notepad, not something else. You can see the assembly name stored in the file within the STR stream as “Microsoft.Windows.Shell.notepad.”
Another great, free tool to use to find alternate data streams is LADS by Frank Heyne (available at www.securityfocus/tools/1251/scorit). For example, LADS will find the “Zone.Indentifier” stream in files on Windows XP SP2. On Windows XP SP2, Internet Explorer and Outlook Express tag downloaded files and saved attachments with ZoneID, in an attempt to keep track of their origin.
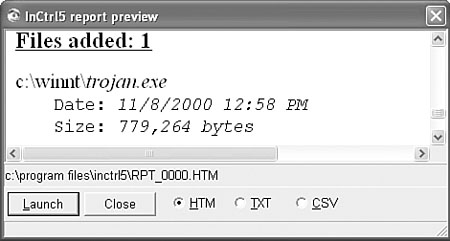
Of course, there are alternative techniques of file-change monitoring. One example is using a file integrity checker to show a log of all the changes. The disadvantage to this technique is that even user mode–written stealth viruses, such as members of the Gaobot worm family, can get around it, so you will not see any changes. However, this technique can be more effective when combined with Registry tracing. For example, PC Magazine has a tool called InCtrl11, which takes snapshots of your disks and Registry. The next time you run the tool, it compares current state to the previously saved snapshot, as shown in Figure 15.12. It can be helpful in quickly pinpointing new and modified executables and Registry keys, similar to an integrity checker. In fact, InCtrl is very similar to my first program, which I created in 1990 to deal with computer viruses, based on snapshot-based integrity checking.
Figure 15.12. InCtrl shows a new file created in the WINNT folder.
15.4.4.2 Natural Infection Testing Using Goat Files
When you deal with unknown programs and look into them on a regular basis, you know that it can be difficult to tell at first glance whether or not a program is infected. Goat files were introduced by computer virus researchers to make a clear distinction between host programs and the computer viruses attached to them in the blink of an eye.
On DOS a simple goat file might not contain more than an INT 20h (0xCD, 0x20), “Return-to-DOS” interrupt call in the front of the file followed by N number of NOP instructions (0x90). A goat file might be specified with a custom size such as 1K, 4K, or 16K (and so on) to fulfill the special taste of some computer viruses. A well-known goat-file generator, GOAT was introduced by Igor Muttik in the mid-1990s. Igor's program is still available from FTP locations today. GOAT demonstrates many standard features of such tools. It can quickly generate a large number of test files of various sizes and also supports different file formats.
Such goat files can be used in several situations. As discussed in Chapter 4, the W95/CIH virus uses the fractionated cavity method; thus its body is fragmented, making the analysis of an infected file more difficult. When CIH appeared, I quickly created test files that had a large enough header section, so the virus infected these in a single piece. Thus, I could start to analyze the virus in a single section of code. Others wrote programs to fetch the virus body, but writing such programs might take more time than using an appropriate goat file for the task.
There are two basic kinds of goat files: simple goat files that do practically nothing, and smart goat files12 that perform some extra functions. For example, the smart goat files of Joe Wells display the interrupt vector table when the host is executed. This can be useful in seeing whether the virus hooked any interrupts as it was executed. Furthermore, smart goat files can perform self-checking for consistency and return error codes when they are modified. This can be useful in running batch processes until all goat files get infected on the test system. Another example of a smart goat file is used for disinfection checking. Such goat files make calculations in registers when executed and return the result of the calculation13. By returning the calculations in an error code, the disinfection of the virus can be tested automatically. If the virus was incorrectly repaired, the calculation of the running code will reflect it. As a result, the wrong disinfection is easily noticed.
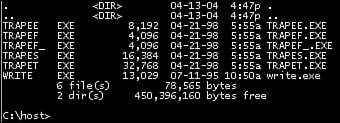
Consider the example of my typical goat files, which I call trap files, in Figure 15.13. The write.exe application is infected with the W95/Marburg virus. Notice that 13,029 is divisible by 101, which is the marker of the virus.
Figure 15.13. Clean goat files and a W95/Marburg-infected write application.
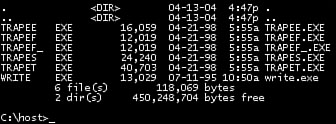
In Figure 15.14, you can see that all of my trap files got infected as I executed the virus a number of times. Typically, I execute the first infected program, and then I check whether a replica also infects other programs correctly. This is necessary to confirm that the virus is not intended.
Figure 15.14. Infected goat files.
I typically save information about the program as a message in my goat programs. For example, I created special goat files for Marburg because the virus infects files differently when there are no relocations present near the host's entry point. To simulate that, I simply put enough NOP instructions at the entry point of the host file. These tricky goat files can be useful later, when another virus uses a similar trick to infect executables.
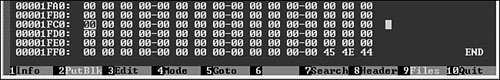
I also mark the ends of the files with an END mark, as shown in Figure 15.15. This can usually help me to find the start of the virus body more quickly, which will be right after this mark in my test files.
Figure 15.15. The tail of a clean goat file in HIEW.
Infected goat files are an extremely important part of the analysis process. By knowing which part of the file is changed, tools can automatically compare and map the constant ranges of most computer viruses efficiently enough to create nearly exact detections. Such comparison maps provide a good-enough basis for exact identification, which can be checked further by an analyst for higher precision.
If you need to create goat files for various operating systems on Intel platforms, I recommend NASM (Netwide Assembler), a free x86 assembler that supports Windows object file formats and PE formats, as well as ELF, COFF, and a.out formats on Linux and BSD platforms. You can get it at http://sourceforge.net/projects/nasm.
15.4.4.3 Monitoring Registry Changes
Another essential tool is Regmon from Sysinternals. This tool can show you all the Registry access of a program with the changes it makes to the Registry. Figure 15.16/1 shows Registry Monitor capturing the Dumaru worm's access to the HKLMSoftware MicrosoftWindowsCurrentVersionRun keys to set a program called load32.exe to run the next time any Windows user logs on.
It also sets another key in HKCUSoftwareMicrosoftWindows NTCurrentVersionWindows un to run dllreg.exe, as shown in Figure 15.16/2. Indeed, this is the file I captured with File Monitor, as shown in Figure 15.10.
You also can see that suspect.exe (the Dumaru worm) queries values, but the worm is bogus, and the queries result in failure. Such events can give you a clue about what possibly went wrong for the worm. For example, you can see access to keys that store an SMTP server name or Windows Address Book. If the queries are not accurate, chances are that the worm will not work completely, so you can make appropriate changes in your test environment and run the worm again.
Figure 15.16. Monitoring Registry changes of the Dumaru worm.

15.4.4.4 Monitoring Processes and Threads
Monitoring processes and threads is also essential. I illustrated many techniques in Chapter 12's (“Memory Scanning and Disinfection”) discussion of memory scanning techniques. It is a good practice to monitor process and thread activity because this can show you important information about a worm's internal structure. For example, if you see a few threads created, chances are that this information will be useful when looking at the worm in a disassembler. You can use standard tools such as the Windows Task Manager to see thread and process information. Be advised, however, that several threats will hide themselves from the Task Manager. For example, malicious code and worm programs can register themselves as services so they do not show up on the Windows 9x/Me Task Manager. You can use the Sysinternals tool called Process Monitor to overcome most such problems and kill unwanted tasks quickly.
Another great tool is HandleEx, which can show DLLs loaded by a process with their associated open handles to files, memory sections, and named pipes.
15.4.4.5 Monitoring the Network Ports
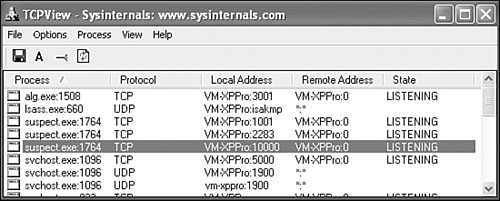
It is important to monitor the list of open network ports on the system. Backdoor programs and built-in backdoors in computer worms often open a single port or set of ports to which the attacker can connect. You can use standard commands, such as netstat -a, to display all open ports that listen on a system and even to display PID (process ID) information. However, a much nicer option is to use TCPView, which shows the name of each process associated with TCP and UDP ports.
When I run suspect.exe (the Dumaru worm) on a VMWARE test system, I see that it opens three TCP ports: 1001, 2283, and 10000, as shown in Figure 15.17.
Figure 15.17. The Dumaru worm opens ports on the system.
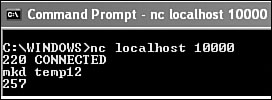
With a quick look into the constant data area of the worm, I suspect the commands associated with these ports, and using the NC (NetCat) tool, I can even try out the backdoor. For example, I can connect to localhost on port 10000/tcp using the command NC localhost 10000. (Obviously, an attacker would use a remote system's target IP address instead of localhost.) I use the mkd backdoor command with the parameter temp12, expecting it to create a directory called temp12, as shown in Figure 15.18.
Figure 15.18. Connecting to the Dumaru backdoor using NC (NetCat).
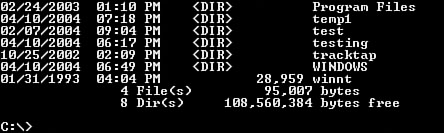
However, when I check the result by making a directory list, as shown in Figure 15.19, I see that the backdoor created temp1 instead of temp12, dropping the last character.
Figure 15.19. The test shows that the backdoor created a folder as temp1.
As this experience demonstrates, dynamic testing can give you a better look and feel of the malicious code. Indeed, port monitoring is a great way to deal with malicious code that works as in the example. Keep in mind, however, that not all backdoors work via newly opened ports. Some backdoors communicate via Internet control message protocol (ICMP), using ICMP echo requests. This kind of backdoor is gaining popularity because many companies allow certain kinds of ICMP messages across their firewall14. Loki is an example of such an attack and is discussed in Phrack magazine (http://www.phrack.org/phrack/49/P49-06). A tricky backdoor also can use port stealth to hide the port on which it is listening. You must monitor this kind of malware with other tools, such as a sniffer, which is discussed in the next section.
15.4.4.6 Sniffing and Capturing Network Traffic
The previous section explained port monitoring and its possible drawbacks. In this section, I discuss the use of sniffing tools to enhance understanding of malicious code. As discussed in Chapter 14, “Network-Level Defense Strategies,” such tools are based on the promiscuous mode of network cards, which instruct the network interface card to accept all incoming packets as their own. In your dedicated malicious code analysis, you can use such tools without disturbing anyone with your activities. This can be useful for analysis in a number of ways. Network captures are necessary to create efficient IDS signatures and to test these systems later on. Furthermore, complete working functionality of the worm code can only be proved via successful test replications. These test replications can reveal extra functionality and are also useful to test decomposers in active gateway antivirus scanners.
In Chapter 9, “Strategies of Computer Worms,” I discussed the internal working mechanism of SMTP worms. In this short section, I would like to illustrate how typical SMTP worm traffic looks on the wire. This information can be useful in extending one's knowledge base of worm attacks, letting network system administrators, for example, look for such traffic on their own networks. Figure 15.20 shows a network capture of the W32/Aliz@mm worm.
Figure 15.20. W32/Aliz@mm captured with Ethereal.
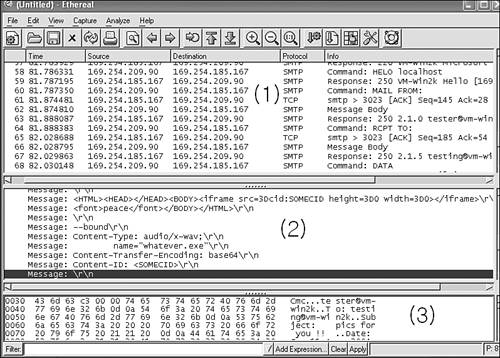
I arranged two virtual machines for this experience. The test machine on which I ran the worm is 169.254.209.90. The target system runs Microsoft IIS for SMTP on 169.254.185.167. I ran Ethereal on the source machine to reduce the need for yet another system. Ethereal sniffs the network traffic on the interface of the virtual network between two virtual machines running VMWARE. In the main Ethereal window (see Figure 15.20/1), you can follow the communication between the SMTP client (the Aliz worm) and the SMTP server. In Figure 15.20/2, you can see a part of the e-mail body that goes to the SMTP server. Figure 15.20/3 shows raw data of the e-mail header.
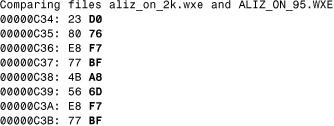
What can be learned from this experience? If you think that natural replication of computer worms in test environments can be rather frustrating, you are right. However, there are many rewards. Only natural infection tests give you an idea about the true nature of computer worms. In this example, W32/Aliz has an interesting detail in its replication mechanism. Unlike most computer worms, Aliz encodes and sends its in-memory copy instead of encoding and sending itself as a file image. This has an interesting side effect. Because the Windows system loader might change the API bound offsets in the import directory of any loaded PE executable, the loader might also change the bound imports of the computer worm. So far, this is completely normal. However, Aliz sends its encoded body using the in-memory code of the worm, so these changes will be propagated to new systems, changing the worm body slightly. In other words, the MD5 of the worm on the source system might not be the same as on the target system, even though the worm does not have any built-in evolutionary functionality, such as polymorphism. Content-filtering software might rely on MD5s hashes or some kind of checksums to eliminate unwanted traffic and, as a result, will fail to stop Aliz properly in all circumstances.
Listing 15.3 shows that the source image of the source and the target image are different according to the File Compare tool.
Listing 15.3. Comparing the Source and Destination Copies of the Aliz Worm
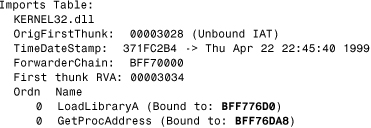
Using PEDUMP, I can quickly dump one of the images to check where the preceding byte pattern belongs. The worm has only two APIs in its import table and picks the other APIs dynamically. I can see that the bound addresses of the LoadLibrary() and GetProcAddress() functions correspond to the changes that I found with File Compare, as shown in Listing 15.4.
Listing 15.4. Using PEDUMP to Check the Import Table of the Aliz Worm
For another example of network sniffing–based analysis, look at the network capture of the Witty worm in Figure 15.21. In this example, 192.168.0.1 is an attacker system, and 192.168.0.3 is the vulnerable target machine. The vulnerability is only exploitable on the target if the source port on 192.168.0.1 (in this example) is 4000/udp because the worm simulates an ICQv5 protocol request to hit a vulnerable BlackIce firewall that inspects such incoming packets. (As a matter of fact, BlackIce Firewall, and ISS products in general, have only a few reported critical vulnerabilities.)
Figure 15.21. An Ethereal capture of the Witty worm.
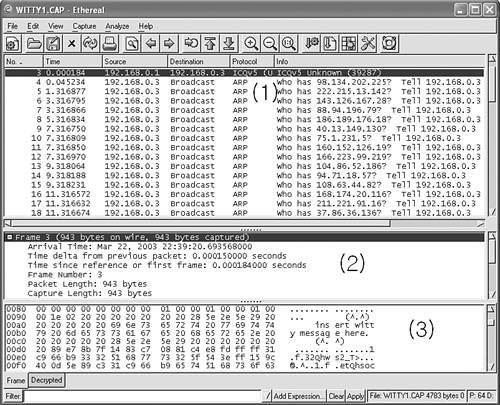
For us to test these conditions, the target must have the vulnerable BlackIce firewall installed. Ethereal is used to capturing the traffic on the network interface used by the two systems. On the source machine, you can use NetCat to inject the worm packet. As the worm hits the target, there is a quick succession of ARP broadcast requests from the target as the worm attempts to send itself to randomly generated IP addresses, as shown in Figure 15.21/1. You can clearly see that 192.168.0.3 is continuously generating new IP addresses, such as 98.134.202.225, 222.215.13.142, and so on. Figure 15.21/2 shows the captured packet's information on the wire. In Figure 15.21/3, you can see the worm's message: “insert witty message here (^.^)”—hence the worm's name.
Witty's code only makes sense inside the vulnerable host process because the worm uses hard-coded addresses in the address space. The code of the worm is difficult to analyze in a disassembler because the analyst must make many guesses. Such guesses, however, can easily lead to wrong conclusions and incorrect analysis. It is much simpler to do a proper analysis with the right tools and natural infections. I believe it is easier to understand such details with debuggers. The next section explains the basics of debugging-based analysis.
15.4.4.7 System Call Tracing
Another possible way to collect information about a running application is to use an interrupt or system tracer that can log the called interrupts or APIs as the program executes on the system. Such tools are often difficult to use, and there are very few that operate correctly on Windows systems. On UNIX systems, such system tracing tools are included by default and can be used for malicious code analysis.
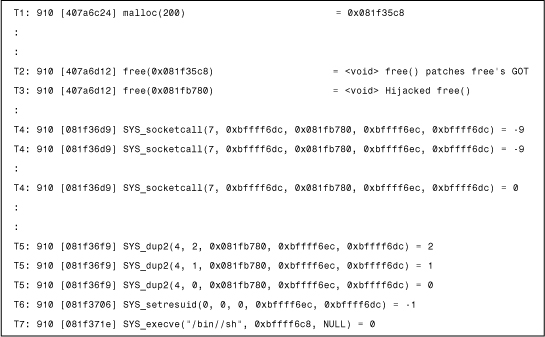
In Chapter 10, “Exploits, Vulnerabilities, and Buffer Overflow Attacks,” I demonstrated the use of the Interrupt Spy tool, which is particularly useful for DOS interrupt tracing. Similarly, on a Linux system there can be situations in which a system tracer can give you better insight into a problem. For example, during a Linux/Slapper attack, we used the strace tool with Frederic Perriot on Linux to trace the system calls made by the vulnerable Apache processes to understand the exploit code better. We knew that the exploit uses sys_execve with a /bin/sh parameter to run the shellcode at one point. Looking the strace log of the attack from the execve() call backward, we understood better how the shellcode got control on the heap. Figure 15.22 shows a snippet made by the strace tool during a Linux/Slapper attack.
At T1, a malloc() function allocates memory. This is called by the vulnerable Apache process. At T2, a free() function is called, but this one patches the GOT entry of free() (see Chapter 10 for details). Next, at T3 there is yet another free(), but this is not a real free() function anymore. Although strace believes that this is a free() function based on the GOT, this call is already hijacked and points to the shellcode.
At T4, the first function SYS_socketcall is called by the exploit code repeatedly to find the socket on which the exploit code arrived at the system. Then at T5, the handles are duplicated, a bogus SYS_setresuid() function is called, and finally the SYS_execve() function runs a command shell (/bin/sh), which will be connected to the attacker system via the “reused” attacker socket.
Figure 15.22. The strace log of Linux/Slapper's exploit code.
As this experience demonstrates, strace/ltrace-like tools can be often useful to understand something better or to prove a point. In practice, however, there are far too many function calls to look at, so you can easily get lost in the overwhelming information placed into the execution log file. In some case, a better approach is debugging, so you can limit yourself to the information you need to see.
15.4.4.8 Debugging
There are several kinds of debuggers that can be used to trace the execution of computer viruses and other malicious programs in action. Select the debugger according to the type of analysis you wish to perform. There are several kinds of software-only debuggers to trace binary code:
• Kernel-mode debugger: An example is SoftICE, which is a commercial tool. If you want to trace kernel-mode code, there is nothing better on Windows than SoftIce (http://www.compuware.com/products/numega.htm).
• User-mode debugger: A free tool is OllyDBG. This powerful free debugger contains many great features, such as memory search and dump. You can find it at http://home.t-online.de/home/OllyDBG. (An excellent commercial solution is IDA, which also supports debugging in newer releases.)
• Virtual debugger: An example is Turbo Debugger in V86 mode. The excellent Turbo Debugger 5.5 release became a free tool and is available at http://www.borland.com/products/downloads/download_cbuiler.html.
• User and kernel -mode debugger: Microsoft's WinDBG is a free tool. WinDBG has come a long way over the years. It can be used to trace code in both the checked and the free builds of Windows, locally or remotely. You can download it from Microsoft's Web site at http://www.microsoft.com/whdc/ddk/debugging/default.mspx.
Note
If you are already there, do not forget to download the symbols files for Microsoft Windows code. This can help you to debug malicious code much faster. A variety of tools, including SoftICE and IDA, can also use these symbols. Microsoft also offers a set of other console-level debugging tools. Do not overlook what you might already have, such as DEBUG or NTSD debuggers on Windows.
The preceding recommendations are generally Windows oriented. I also suggest that you use gdb (GNU debugger) if you need to debug malicious code on the Linux platforms. You can find GDB at http://source.redhat.com/gdb.
Each large macro and script environment, such as VBA and VBS, supports debugging, which can be a similarly helpful addition to your toolkit for analyzing macro and script viruses.
Some debuggers can work in more than one mode. SoftICE can be useful to trace user-mode programs, and Microsoft WinDBG (“Wind Bag”) can also support both user and kernel -level debugging.
Many debuggers support remote debugging over a network interface. For example, I used to trace code on an IA64 box from an IA32 system using WinDBG. Newer IDA releases support a variety of remote debugging as well. For example, you can use IDA to remote debug malicious code on a Windows system from a Linux box, as well as Windows-to-Windows and Windows-to-Linux. This can help you deal with user mode–based malicious code extremely well.
If you need to analyze kernel-mode rootkits or viruses in action, it is essential to have a debugger that can trace kernel mode code. There are very few good debuggers that can trace malicious code that use kernel-mode functionality. My favorite debugger that supports kernel-mode debugging on Windows systems is SoftICE. The name SoftICE originates in the powerful hardware-level debugging device called ICE (in-circuit emulator). The soft prefix suggests software-level, rather than hardware-level, debugging. ICE systems typically use an extra CPU and can show you even microcode-level details of a running processor in action. There is simply not a more powerful debugging tool than an ICE, but such devices can be extremely costly and therefore remain beyond the reach of most of us.
Software-only solutions also can be rather powerful, and SoftICE is certainly such a tool. I started to use SoftICE in the DOS days but only got addicted to it when I began developing kernel-mode drivers for Windows NT systems. Back in 1996, the need for SoftICE was major because Microsoft WinDBG was in a very early development stage, crashing frequently in all sorts of debugging situations. A crash is really the last thing you want to experience when you are debugging malicious code! Fortunately, WinDBG came a long way, and the recent versions are a lot more friendly.
SoftICE can be extremely helpful in difficult situations, such as tracing antidebugging code, like the trick built into W95/CIH that uses an INT 3– (break point) based transition to kernel-mode halting debuggers (see Chapter 6, “Basic Self-Protection Strategies”). Even SoftICE can run into this antidebug trick in standard mode. However, the trick of W95/CIH virus can be bypassed using the BPM (break point on memory access) command of SoftICE, which uses debug registers instead of an INT 3–based break point. By not relying on INT 3 as a break condition, the debugger is less likely to be tricked by the malicious code. However, there are many other antidebugging tricks in malicious code nowadays (which I explained in Chapter 6), and these can challenge even the best debuggers—unless you are aware of the tricks and pay attention to them.
SoftICE is very helpful in showing you the API names and even the parameters of APIs in many cases. You can load extra symbols on the system, and using such symbols you can inspect malicious code much more quickly.
SoftICE is also powerful in dealing with code that uses structure exception handling tricks, common in malicious code. A user-mode debugger like Turbo Debugger can easily lose track of such code, because Windows exception handling will trigger kernel-mode code, in which a user-mode debugger cannot place break points. I used SoftICE to trace the CodeRed worm in action. This was necessary to understand CodeRed's stack overflow attack, which was based on Windows exception handler hijacking.
Virtual debuggers, such as Turbo Debugger in V86 mode, can help you to trace aggressive antidebug DOS code that continuously modifies the interrupt vector table of INT 1 and INT 3 to interfere with your debugging. In V86 mode, Turbo Debugger uses a driver that switches the processor to V86 mode to run CPU-based virtual machines. Virtual machine debuggers will not save you in many situations. Malicious code can check how much time is spent between one instruction and the next and take action based on this event, guessing that you are tracing its code slowly in a debugger. You need to notice these tricks, but V86 debugging is really more powerful than normal methods. In fact, this mode of debugger influenced me to design true CPU emulation-based debugging systems to deal with malicious code better, which I will discuss later in this chapter.
The majority of computer viruses can be effectively traced using a user-mode debugger. I like the fact that user-mode debuggers can run parallel to other applications on the system, so I can use a single machine in multitasking mode. I can easily cut and paste interesting data from the debugger to another file. For example, I can attach a debugger to a running malicious process, break into the process address space of the malicious code, and cut and paste decrypted code/data sections into a text editor. This trick is also possible with SoftICE, but it is a little bit more complicated because SoftICE owns the control of the system when you break the execution of the OS. The trick in SoftICE is to dump important areas of the process address space to the command console and let the program continue to run. When control returns to the system, you can use the user-mode SoftICE component (System Loader) and save the command history into a file, which will have the memory and code dumps that you were interested to capture.
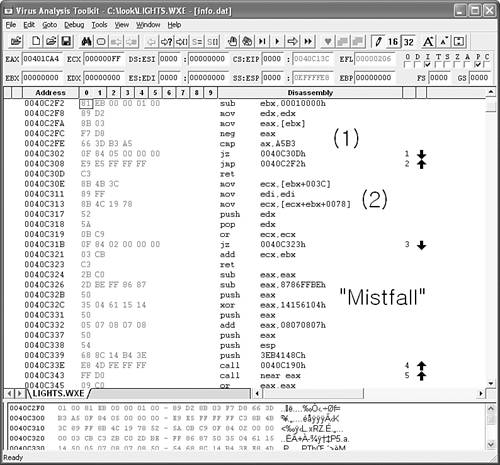
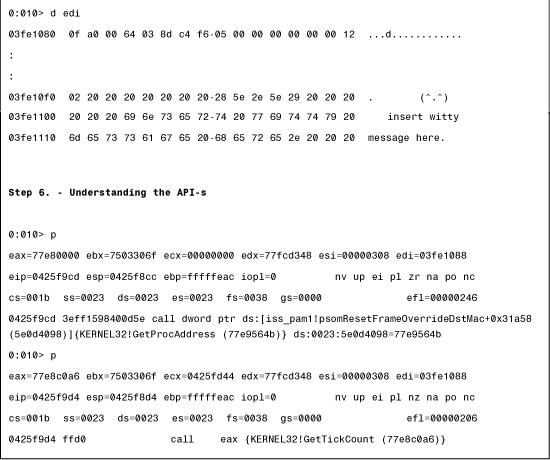
Next I will show you a detailed debug log of the Witty worm analysis process. I already demonstrated the Witty worm in action in an Ethereal network capture. The natural infection can help you to understand Witty's code much better, if you prepare debugging in advance on the target system. Also see Figure 15.23, which shows the memory layout and control flow of a Witty attack.
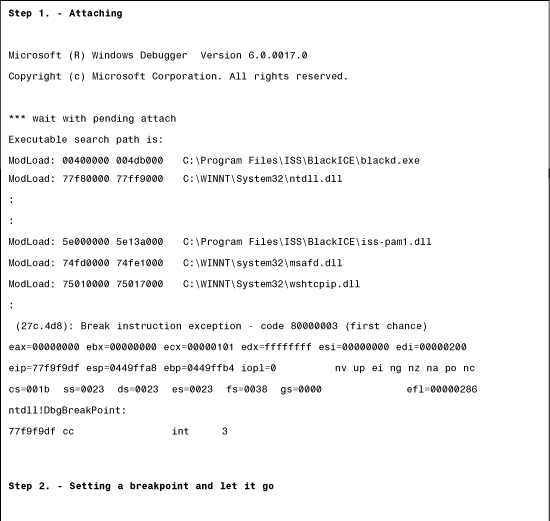
When we analyzed Witty with Frederic Perriot and Peter Ferrie, we decided to read the worm's code in the vulnerable process address space using WinDBG in action, knowing that this was the easiest way to understand the worm with 100% accuracy.
First, we observed the worm's code in a disassembler and guessed that the code was based on the hijacking of a return address via a stack overflow condition. In particular, we suspected that a return address would be hijacked to point to 0x5E077663, which would likely run the stack by using an instruction such as JMP ESP.
- To prove this point, we first break into the process address space of the vulnerable BlackICE process using WinDBG, shown in Figure 15.26, step 1.
Figure 15.26. Looking W95/Zmist's metamorphic body under encryption.
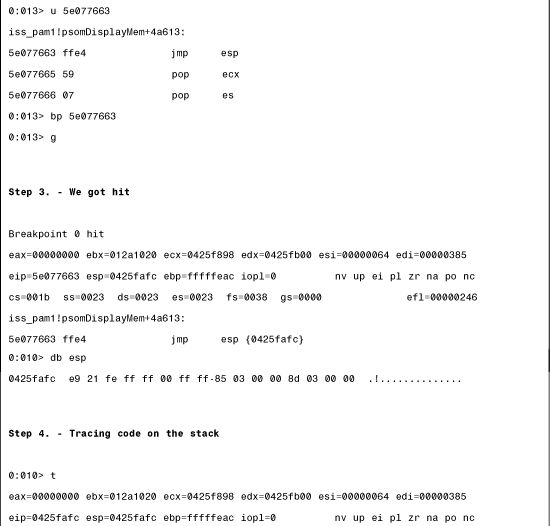
- In step 2, we check whether 0x5E077663 will likely be an offset to where a hijacked return address will point. Using the U command, we see that there is indeed a JMP ESP instruction at that location. Next, we set a break point on this address, using the BP command. We hope that when the worm hits the target, the debugger will be invoked automatically. Finally, we use the G command to continue running the vulnerable process.
- In step 3, we inject the worm from a source machine to the target using NetCat. Immediately upon doing so, we get hit at our break point. We see that the JMP ESP instruction is indeed running the worm's code on the stack because it points to another backward jump instruction (0xe9) in the worm's body.
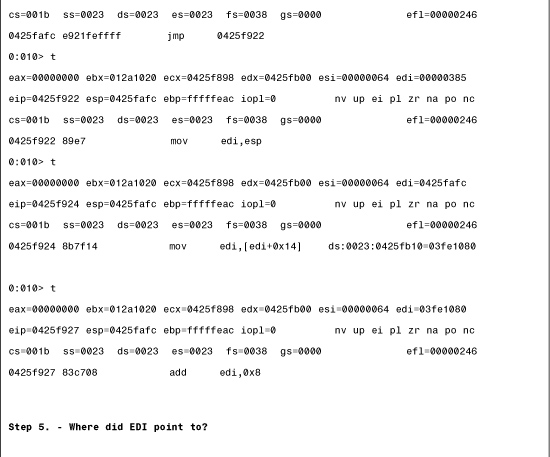
- In step 4, we continue tracing the worm. Shortly, we arrive at the top of the worm's code.
- In step 5, we are interested in where the EDI register points. We confirm that EDI is a pointer to the worm on the heap that holds the incoming UDP packet—hence the EDI+8 calculation in the worm to skip the UDP header.
- In step 6, you can see that API names are resolved by the debugger as the worm executes, and you can see how the GetProcAddress() and GetTickCount() APIs are called by the worm. This is the information that you must guess when you rely on static disassembly analysis only. When you use a debugger properly, you have it for free.
Figure 15.23. A WinDBG trace into the Witty worm.
The lesson of this experience is that using a debugger can help you to understand viral code much more quickly. You can always use a break point, which you need to select carefully. For example, you can trace computer viruses by placing a break point on file open functions and tracing the infection routine in action when the virus opens a file.
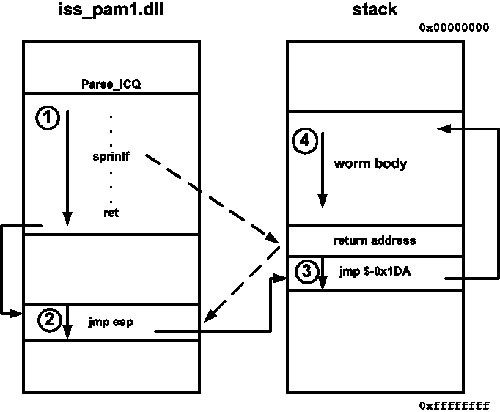
Figure 15.24 shows the memory layout and control flow during the attack, which you can use to understand the preceding debug trace better. The worm gets control in four steps: In step 1, a vulnerable sptrinf() function smashes the stack and overwrites a return address, and the return address is picked by a RET instruction in iss_pam1.dll. In step 2, the JMP ESP instruction executes the stack, which is inside the worm body. In step 3, a backward jump instruction finally runs the worm start code located at step 4.
Figure 15.24. The memory layout and control flow during a Witty worm attack.
Note
Be extremely cautious when you analyze computer worms in a debugger because break-point instructions like 0xCC opcodes might be inserted into the code flow of the replicas. A good practice is to throw away the results of all replicas after such analysis.
15.4.4.9 Virus Analysis on Steroids
Finally, we arrive at the discussion of my favorite tool. Indeed, you can hardly find a better tool that suits your analysis needs than the one that you design and build yourself. We built Virus Analysis Toolkit (VAT) to simplify many difficult analysis tasks, such as exact identification, manual definition creation, and polymorphic virus analysis. We built VAT (shown in Figure 15.25) at Data Fellows (now called F-Secure) in 1997. In its underlying concept, VAT is similar in its capabilities to expert systems15. (I need to give huge credit to Jukka Kohonen for his excellent skills in UI development that enabled the re-creation of my vision of the tool 100%.)
Figure 15.25. VAT with a W95/Zmist-infected file loaded into the emulator.
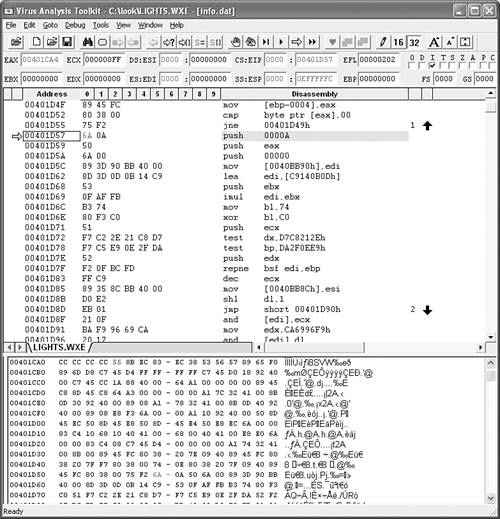
The heart of VAT is a powerful code emulator. It can understand different file formats, so it can easily load files such as COM, EXE, PE, and so on. Just as in a debugger, you can trace the execution of programs, but the virus code has no way to infect your system because it runs in the software-emulated environment. Because everything is virtualized, difficult antidebugging tricks are handled easily in VAT. For example, the emulator supports exception handling, so it can bypass many tricks unnoticeably.
One of the basic advantages of VAT is that you can place break points anywhere. Normally, you need to trace a polymorphic decryptor in a debugger until it decrypts enough code (at least one byte) where you wish to put a break point. Not so in VAT because the emulator does not need an INT 3-based break point.
Figure 15.25 shows a W95/Zmist-infected application loaded into VAT for emulation. As explained in Chapter 7, “Advanced Code Evolution Techniques and Computer Virus Generator Kits,” Zmist integrates itself into the code flow of the host code. Figure 15.25 shows how the polymorphic decryptor of Zmist starts with a PUSH instruction right after a conditional jump of the host code. I can set the instruction pointer (EIP) directly to that location and let the code execute in VAT. VAT can track all changed bytes in the virtual memory and show them highlighted in red. This is very useful for seeing decrypted code. VAT automatically stops and offers a break point when suspicious code snippets are executed, such as a CALL to a POP instruction typical in viruses. It also stops the emulation whenever decrypted code is executed in the virtual machine. Thus, I can simply run the virus within the emulator and wait until it decrypts itself for me.
Figure 15.26 shows a decrypted area of the metamorphic virus body of Zmist under a layer of encryption.
You can notice the metamorphic code by reading the code carefully. For example, you can see a MOV EDX, EDX instruction in Figure 15.26/1, which is one of many garbage instructions inserted into the code flow. At this point in the disassembly, you can see a tricky MZ comparison obfuscated with a NEG instruction. In Figure 15.26/2, you also can see some other garbage instructions, such as MOV EDI, EDI, and a push EDX–pop EDX pair. Check the code carefully around the Mistfall sign, and you can see how this signature of the metamorphic engine is placed on the stack in decrypted form, signaling the start of the metamorphic engine.
Indeed, Zmist is currently among the hardest viruses to detect. The great difficulty of the virus detection arises not only because the virus uses polymorphic and metamorphic code, but because there are also hidden characteristics of these engines.
For example, the metamorphic engine uses garbage code insertion and an equivalent instruction generator. The trick is that the garbage code can be mutated into instruction that produces the equivalent result when executed. To control the growth of the virus body, a garbage collector is used; however, the garbage collector will not recognize all forms of the metamorphic garbage instructions. This feature (a possible bug?) introduces unexpected code growth that will look unnatural at first glance, but it is really “generated” by the strange interaction of the metamorphic engine routines.
VAT can open several applications in parallel and run emulation instances multithreaded. This is very useful because after each emulated and decrypted instance, individual copies of the virus bodies can be compared to each other using VAT commands. This can highlight the similar code in the virus body in the different instances and greatly help to obtain exact identification. Of course, metamorphic viruses can easily attack such comparisons, but even highly polymorphic viruses can be compared using this option.
VAT also can save the decrypted code from the virtual machine's memory back to a file, such as a PE image. This is a very useful feature because the decrypted binary can be loaded quickly into an IDA session for further analysis and commenting.
Interestingly, emulation-based debugging is gaining popularity. I tried to encourage the developers of IDA to build such an emulator years ago, but I was unsuccessful. To my surprise, an IDA user, Chris Eagle, built an IDA plug-in called ida-x86emu16 with support for some of the most common Intel CPU instructions. Although this emulator is still somewhat limited, I suggest you look into it because it is distributed as a GNU project and demonstrates Windows API emulation. Although the x86-emu plug-in does not support features such as floating point unit, and MMX instruction set as of yet, it demonstrates the basis of the idea of emulation-based analysis. Currently there is no support to run the code until a break-point condition because Chris considered it a dangerous operation due to some limitations. You can try to use this emulator to trace UPX and other similar packers in IDA, just like I do in VAT. I hope you will find it as an exciting experience as I do!
15.5 Maintaining a Malicious Code Collection
My space is running out for discussion of the malicious code analysis process, but I need to talk about one more very important subject: virus collection maintenance. It is extremely important to save your analysis for future reference. Malicious code needs to be classified into families, and this process can be more efficient if you have saved old analyses of malicious code and its samples. A good read on collection maintenance is a paper by Vesselin Bontchev17, which I strongly recommend.
Good AV detection and repair, heuristics, and generic detection cannot be developed without a well-maintained collection.
15.6 Automated Analysis: The Digital Immune System
In the previous sections, I detailed the basic principles of manual malicious code analysis. This chapter would not be complete without a discussion of automated code analysis techniques, such as the Digital Immune System operated by Symantec. DIS was developed by IBM Research starting around 199518. There are three major analyzer components of the system, supporting DOS viruses, macro viruses, and Win32 viruses.
DIS supports automated definition delivery to newly emerging threats via the Internet, end-to-end. Figure 15.27 shows a high-level data flow of DIS.
Figure 15.27. A high-level view of the Digital Immune System.
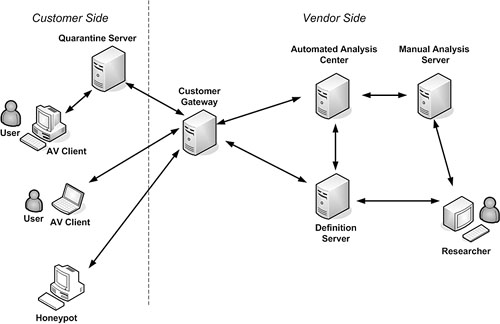
There are a number of inputs to the system from the customer side to the vendor side via the cluster of customer gateways. Obviously, there are a number of firewalls built in on both the customer side and the vendor side, but these are not shown to simplify the picture19. The system developed by IBM can handle close to 100,000 submissions per day.
The input to the system is a suspicious sample, such as a possibly infected file, which is collected by heuristics built into antivirus clients. The output is a definition that is delivered to the client who submitted the suspicious object for analysis.
Several clients can communicate with a quarantine server at corporate customer sides. The quarantine server synchronizes definitions with the vendor and pushes the new definitions to the clients. Individual end users also can submit submissions to the system via their built-in AV quarantine interface. Suspicious samples also can be delivered from attack quarantine honeypot systems9.
The automated analysis center processes the submission and creates definitions that can be used to detect and disinfect new threats. Alternatively, submissions are referred to manual analysis, which is handled by a group of researchers.
The heart of the automated analysis center is based on the use of an automated computer virus replication system. In late 1993, Ferenc Leitold and I realized the need for a system to replicate computer viruses automatically. When we attempted to create a collection of properly replicated samples from a large collection of virus-infected sample sets, we observed that computer virus replication is simply the most time-consuming operation in the process of computer virus analysis20.
A replicator system can run a virus in a controlled way until it infects new objects, such as goat files. The infected objects are collected automatically and stored for future analysis. This kind of controlled replication system was also developed by Marko Helenius at the University of Tampere for the purpose of automated antivirus testing21.
On the other hand, IBM built on the groundwork of replication systems that used virtual machines, such as Bochs (http://bochs.sourceforge.net), in modified forms using the principles of generic disinfection. IBM researchers realized that heuristic generic disinfection (discussed in Chapter 11 “Antivirus Defense Techniques,”) was essential to achieving automated definition generation. The principle of generic disinfection is simple: If you know how to disinfect an object, you can detect and disinfect the virus in an automated way.
Figure 15.28 shows the process of automated virus detection and repair definition generation. The input of the system is a sample of malicious code. The output is either an automated definition or a referral to manual analysis, which results in a definition if needed.
Figure 15.28. The automated definition-generation process in DIS.
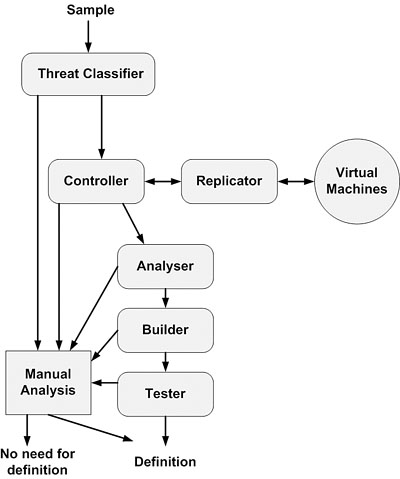
In the first step, the sample arrives at a Threat Classifier module22. In this step, the filtering process takes place first, analyzing the format of the possibly malicious code and referring it accordingly to a controller module. Unrecognized objects go to manual analysis. The filtering process involves steps that were previously discussed as part of the manual analysis process. It is important to understand that multiple analysis processes can take place simultaneously.
In the second step, a replication controller runs a number of replication sessions. The replicator fires up a set of virtual machines, or alternatively, real systems to test replicate computer viruses. For example, documents containing macros are loaded into an environment in which Microsoft Office products are available. The replication process uses modules loaded into the system that run the viruses. The virtual machines run monitoring tools that track file and Registry changes, as well as network activity, and save such information for further analysis. The replicator loads and runs more than one environment by starting with a clean state each time until a predefined number of steps or until the virus is successfully replicated.
If insufficient information is collected about the computer virus in any of the test environments, the controller sends the samples to manual analysis. Otherwise, the controller passes information to the analyzer module. In turn, the analyzer checks the data, such as the infected goat files, and attempts to extract detection strings23 from them (or uses alternative methods). If this step fails, for example if the virus is metamorphic, the replicated sample set will be forwarded to manual analysis.
If the analyzer can create definitions to detect and disinfect the virus, it passes the definition to a builder module. The builder takes the source code of the definition and compiles it to new binary definitions. At this point, a temporary name is assigned to the new viral threat automatically. The temporary name is later changed based on classification by a researcher.
Finally, the builder passes the compiled definitions to a tester module. The tester module double-checks the correctness of definition and tests it for false positives. If a problem is detected in any of the previous steps, the sample set is forwarded to manual analysis. Otherwise, the definition is ready and is forwarded to the definition server and then to the system that submitted the sample.
For example, the W32/Swen.A@mm worm was automatically handled by DIS as Worm.Automat.AHB. There is nothing more fascinating when there are no humans required to respond to an outbreak.
References
1. Jeffrey O. Kephart, Gregory B. Sorkin, Morton Swimmer, and Steve R. White, “Blueprint for a Computer Immune System,” Virus Bulletin Conference, 1997, pp. 159-173.
2. Ian Whalley, private communication, 2000.
3. Rajeev Nagar, Windows NT File System Internals, O'Reilly & Associates, Sebastopol, CA, 1996, ISBN: 1-56592-249-2.
4. Ralf Brown and Jim Kyle, PC Interrupts, Addison-Wesley, Reading, Massachusetts, 1991, ISBN: 0-201-57797-6.
5. File Formats Information, www.wotsit.org.
6. Ian Whalley, “An Environment for Controlled Worm Replication and Analysis (or: Internet-inna-Box),” Virus Bulletin Conference, 2000, pp. 77-100.
7. Nmap ( “Network Mapper”), http://www.insecure.org/nmap/.
8. Costin Raiu, private communication, 2004.
9. Eugene Suslikov, HIEW, http://www.serje.net/sen/.
10. Matt Pietrek's home page, http://www.wheaty.net.
11. Neil J. Rubenking, “Stay In Control,” PC Magazine, http://www.pcmag.com/article2/0,1759,25475,00.asp.
12. Joe Wells, Documentation of the Smart-Goat Files, 1993.
13. Pavel Baudis, private communication, 1997.
14. Ed Skoudis with Lenny Zeltser, Malware: Fighting Malicious Code, Prentice Hall, Upper Saddle River, New Jersey, 2004, ISBN: 0-13-101405-6.
15. Dr. Klaus Brunnstein, Simone Fischer-Hubner, and Morton Swimmer, “Concepts of an Expert System for Computer Virus Detection,” IFIP TC-11, 1991.
16. Chris Eagle, IDA-X86emu, http://sourceforge.net/projects/ida-x86emu.
17. Vesselin Bontchev, “Analysis and Maintenance of a Clean Virus Library,” Virus Bulletin Conference, 1993, pp. 77-89.
18. Jeffrey O. Kephart, Gregory B. Sorkin, William C. Arnold, David M. Chess, Gerald J. Tesauro, and Steve R. White, “Biologically Inspired Defenses Against Computer Viruses,” IJCAI, August 1995, pp. 985-996.
19. Jean-Michel Boulay, private communication, 2004.
20. Ferenc Leitold, “Automatic Virus Analyser System,” Virus Bulletin Conference, 1995, pp. 99-108.
21. Marko Helenius, “Automatic and Controlled Virus Code Execution System,” EICAR, 1995, pp. T3, 13-21.
22. Steve R. White, Morton Swimmer, Edward J. Pring, William C. Arnold, David M. Chess, and John F. Morar, “Anatomy of a Commercial-Grade Immune System,” Virus Bulletin Conference, 1999, pp. 203–228.
23. Jeffrey O. Kephart and William C. Arnold, “Automatic Extraction of Computer Virus Signatures,” Virus Bulletin Conference, 1994, pp. 178-184.