Chapter 6. The Simplest Way to Scale Artificial Intelligence
Scale is about making what you build as useful as possible to as many people as possible without drowning in complexity or expense. Scaling any kind of software system (including AI) isn’t simple. However, there are things that you can do to make scaling AI as simple as possible. The simplest way to scale AI is to build and deploy utility services.
The AI Infrastructure
Utilities set standards that make technologies work together and ensure that everything is available through a common interface. Treat AI platforms as commodities. Design the AI applications so that platform components can be plugged into and swapped out of the existing legacy infrastructure. Choose technologies capable of running AI as widely available, reliable services.
Figure 6-1 shows the blueprints of an AI algorithm. These are the basic technical elements needed to deliver a functional, operational, and industrial AI.

Figure 6-1. A blueprint for the AI utility
Utilities set standards for simplicity. Consistently choose the minimum viable algorithm you need to test out your hypothesis. Don’t, for example, build convolution neural networks when linear regression will do. Pull in as little data as possible and map all of the data consumed to a standard domain model. Don’t build a world-class data warehouse when a simple file store will do. However, do code up every component so that it will be available via a web API.
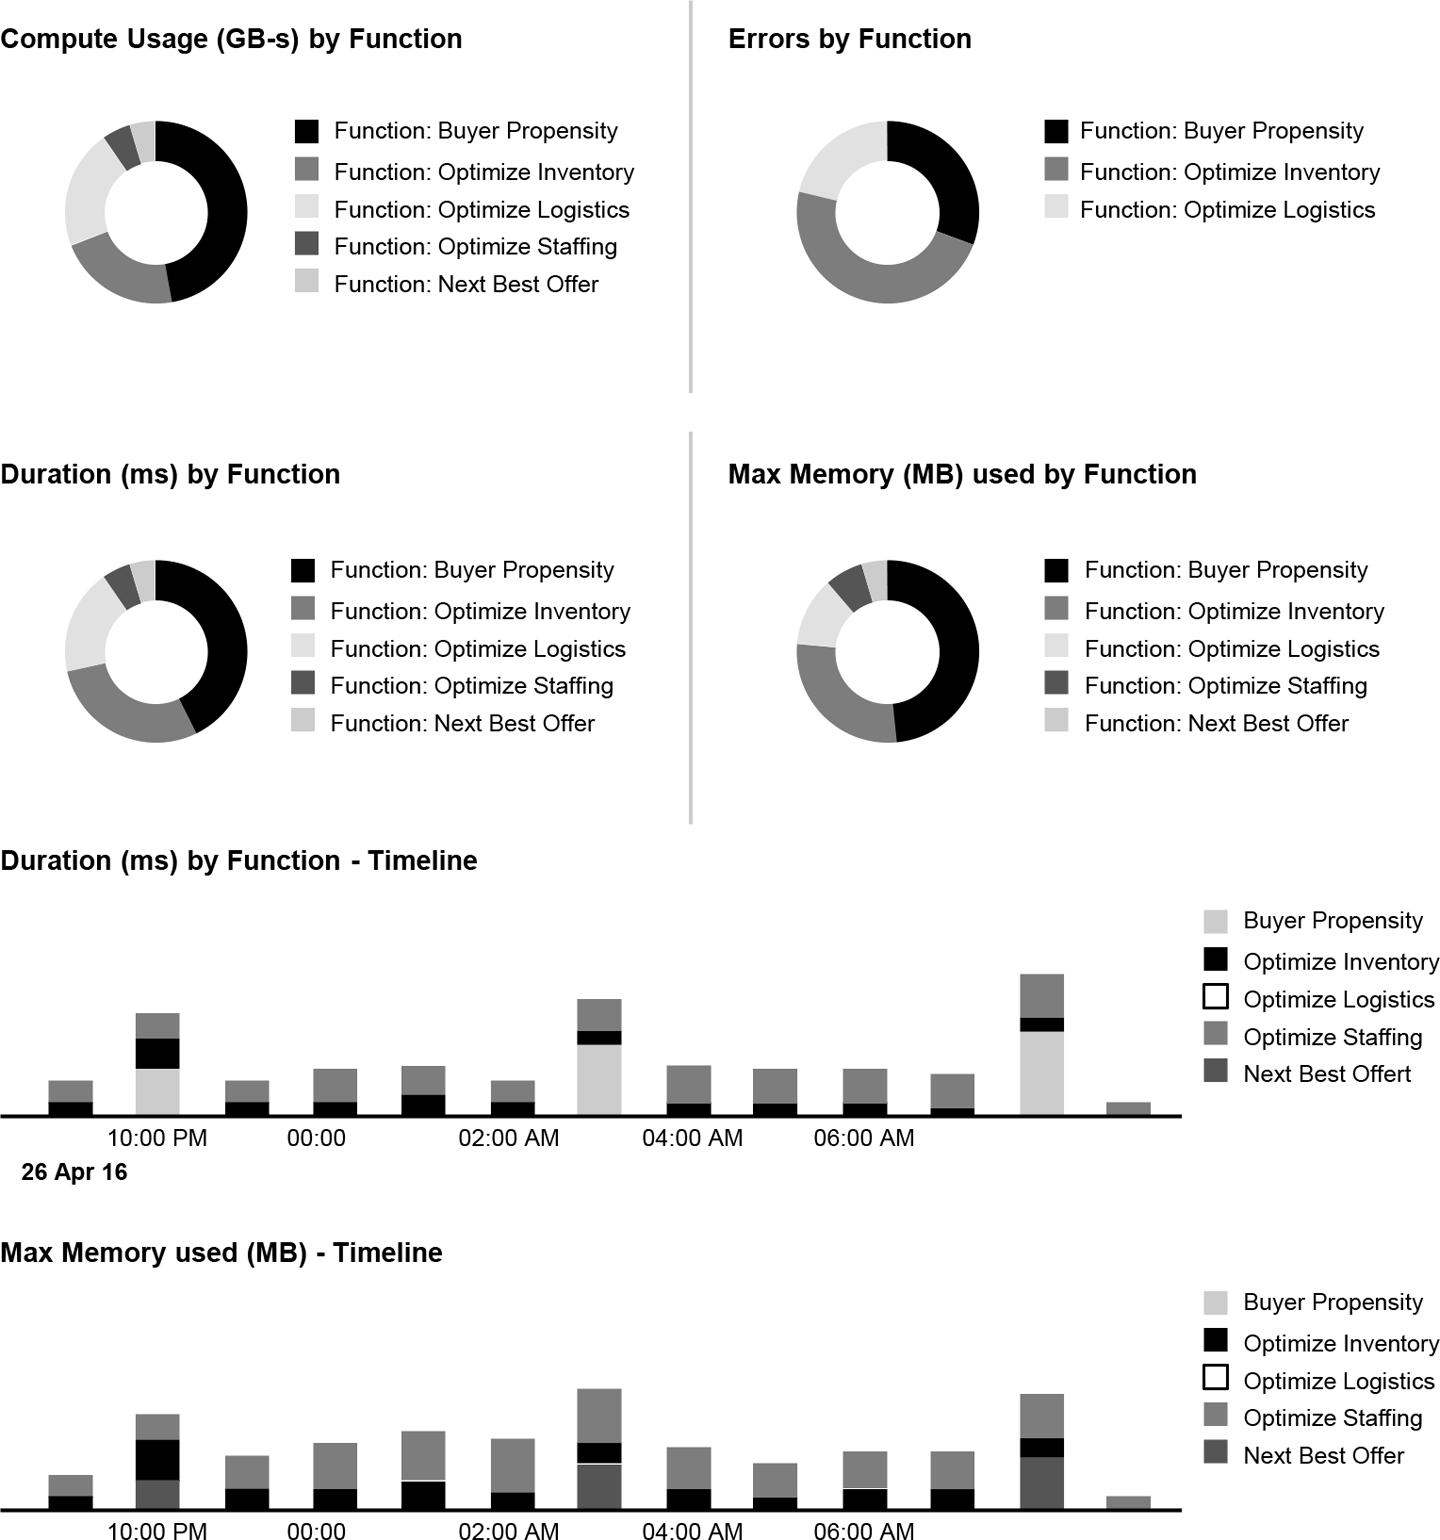
Is the AI Working?
The AI utility is a living, breathing entity. The simplest way to keep it going is to keep an eye on key statistics and generate early warnings when things go wrong. Understand whether the utility is running the algorithms that provide the utility services. The simplest way to monitor (and manage) these algorithms is to build, run, and monitor them as serverless functions. Going serverless means that you don’t need to worry about the compute and storage infrastructure, and you can focus on the algorithms themselves. Keep an eye on whether they stay running, how often they run, and how many resources they consume (see Figure 6-2). Have an idea of what is normal and recognize when elements of the operation are performing too far outside the norm. Analyze the performance and prove that it actively supports the chosen portfolio of experiments.