Chapter 2. The Simplest Way to Find Your Artificial Intelligence Potential
Your business has areas that could improve significantly in cost reductions, efficacy, or new business ventures if you made better use of available information. Perhaps you could improve the way you monitor and predict failure. AI can help reduce cost, reduce waste, or even improve operational efficiency. Or, perhaps you could augment certain executive decisions. AI can help improve the allocation of your staff or increase the loyalty of your customers.
Whatever the potential, the simplest way to begin this discovery is to brainstorm on areas of the business with the largest intelligence gaps. Prioritize areas by their potential to improve the company. Then, begin filling the gaps with hypothetical AI data stories.
Tell Stories
An AI data story describes how AI could be applied in the company. Like any good story, it has a setting, a plot, and a resolution. AI—or more accurately, your application of AI—is the hero that resolves some important problem. In the same way that every hero needs a good villain, every good application of AI data needs a specific measurable business metric to improve.
Table 2-1 shows Act I of a three-act story of how AI might be applied to improve innovation in manufacturing. Act I begins by introducing the setting, presenting applied AI as the main character, describing an unresolved state of affairs, and describing the desired final outcome.
|
Act I: Set up the story |
|
|---|---|
|
The setting |
Imagine if you could make smarter production design decisions that optimize the overall manufacturing process. |
|
The hero |
AI has the potential to decrease the time it takes manufacturers to discover and act on innovation by 50%. You stay relevant by finding good industrial design ideas and acting on them quickly. |
|
The imbalance |
Competition can come from anywhere, but good industrial design sets you apart. A study by the National Endowment for the Arts found that design-led manufacturers enjoy a 9% higher job growth rate than their peers. |
|
The balance |
Manufacturing simulation automates the search for new designs. Real-time production and supply chain planning lets you react quickly. |
|
The solution |
AI-based simulation of the manufacturing process (the digital twin) can use stochastic simulation to generate what-if scenarios that can help manufacturers avoid costly product quality issues while speeding time to market and increasing throughput. |
Table 2-2 shows Act II of the data story. Act II moves the story forward starting from the unresolved state of affairs in Act I. Here, we describe the actions required to apply AI (the main character) in response to the story’s setting.
|
Act II: Develop the action |
|
|---|---|
|
Story at the elevator-pitch level of detail |
Story at the presentation-level of detail |
|
Creating a digital twin starts with establishing new pipelines of manufacturing data. The next step is to take the manufacturing process and model it using rules. |
We can use data pipelines to automate the collection of data, for example, from materials and design. |
|
The Internet of Things (IoT) adds another layer of insight. We can augment the manufacturing process with sensors and automatically generate data about operations, performance, and maintenance. |
|
|
When integrated with historical operations performance data, we now have what we need to support a digital twin. |
|
|
With the digital-twin approach, we build stochastic simulations, or prescriptive models. |
We use AI to discover rules that map from design to performance and add randomness to simulate risk. |
|
The prescriptive data from the simulations shows how new products will work. |
|
|
By analyzing simulation results, we can detect design flaws early. We can predict and minimize cost. We can also use this intelligence to build improved products in the future. |
|
|
Turning point |
Making good manufacturing design decisions keeps you lean. The McKinsey Global Institute found that 80% of manufacturing costs are affected by decisions made in the design phase. |
Table 2-3 shows Act III of the data story. Act III ends the story by describing how the actions of Act II allowed application AI to overcome the central problem in the story.
|
Act III: Frame the resolution |
|
|---|---|
|
The crisis |
We are far from putting all this data to good use. Research by McKinsey’s Global Institute suggests that, as of 2016, manufacturers typically capture only 20–30% of the value of their data. |
|
The solution |
Analytics, advanced analytics, machine learning, and AI are how you capture that remaining 70–80%. |
|
The climax |
Manufacturing simulation automates the search for new designs. Real-time production and supply chain planning lets you react quickly. |
Assuming that visuals and dialog will play a major role in telling the story, the script from Tables 2-1, 2-2, and 2-3 can be delivered as a 45-minute presentation. Telling a story is a natural and powerful way to communicate the potential value of AI. Stories tap into natural patterns underlying the way we think and communicate. Even though the subject of the story is technical, the listener does not need special training or technology to understand its message. A story ties together otherwise scattered pieces of information into a focused, clear, and engaging message.
Map the AI Journey
A solution to one story can be the setting for another. Stories share a dependency when one picks up where the other leaves off. Each individual data story can be linked, in dependency order, into a comprehensive story arc—an extended or continuing storyline. This extended storyline tells the big picture for how AI could transform your organization.
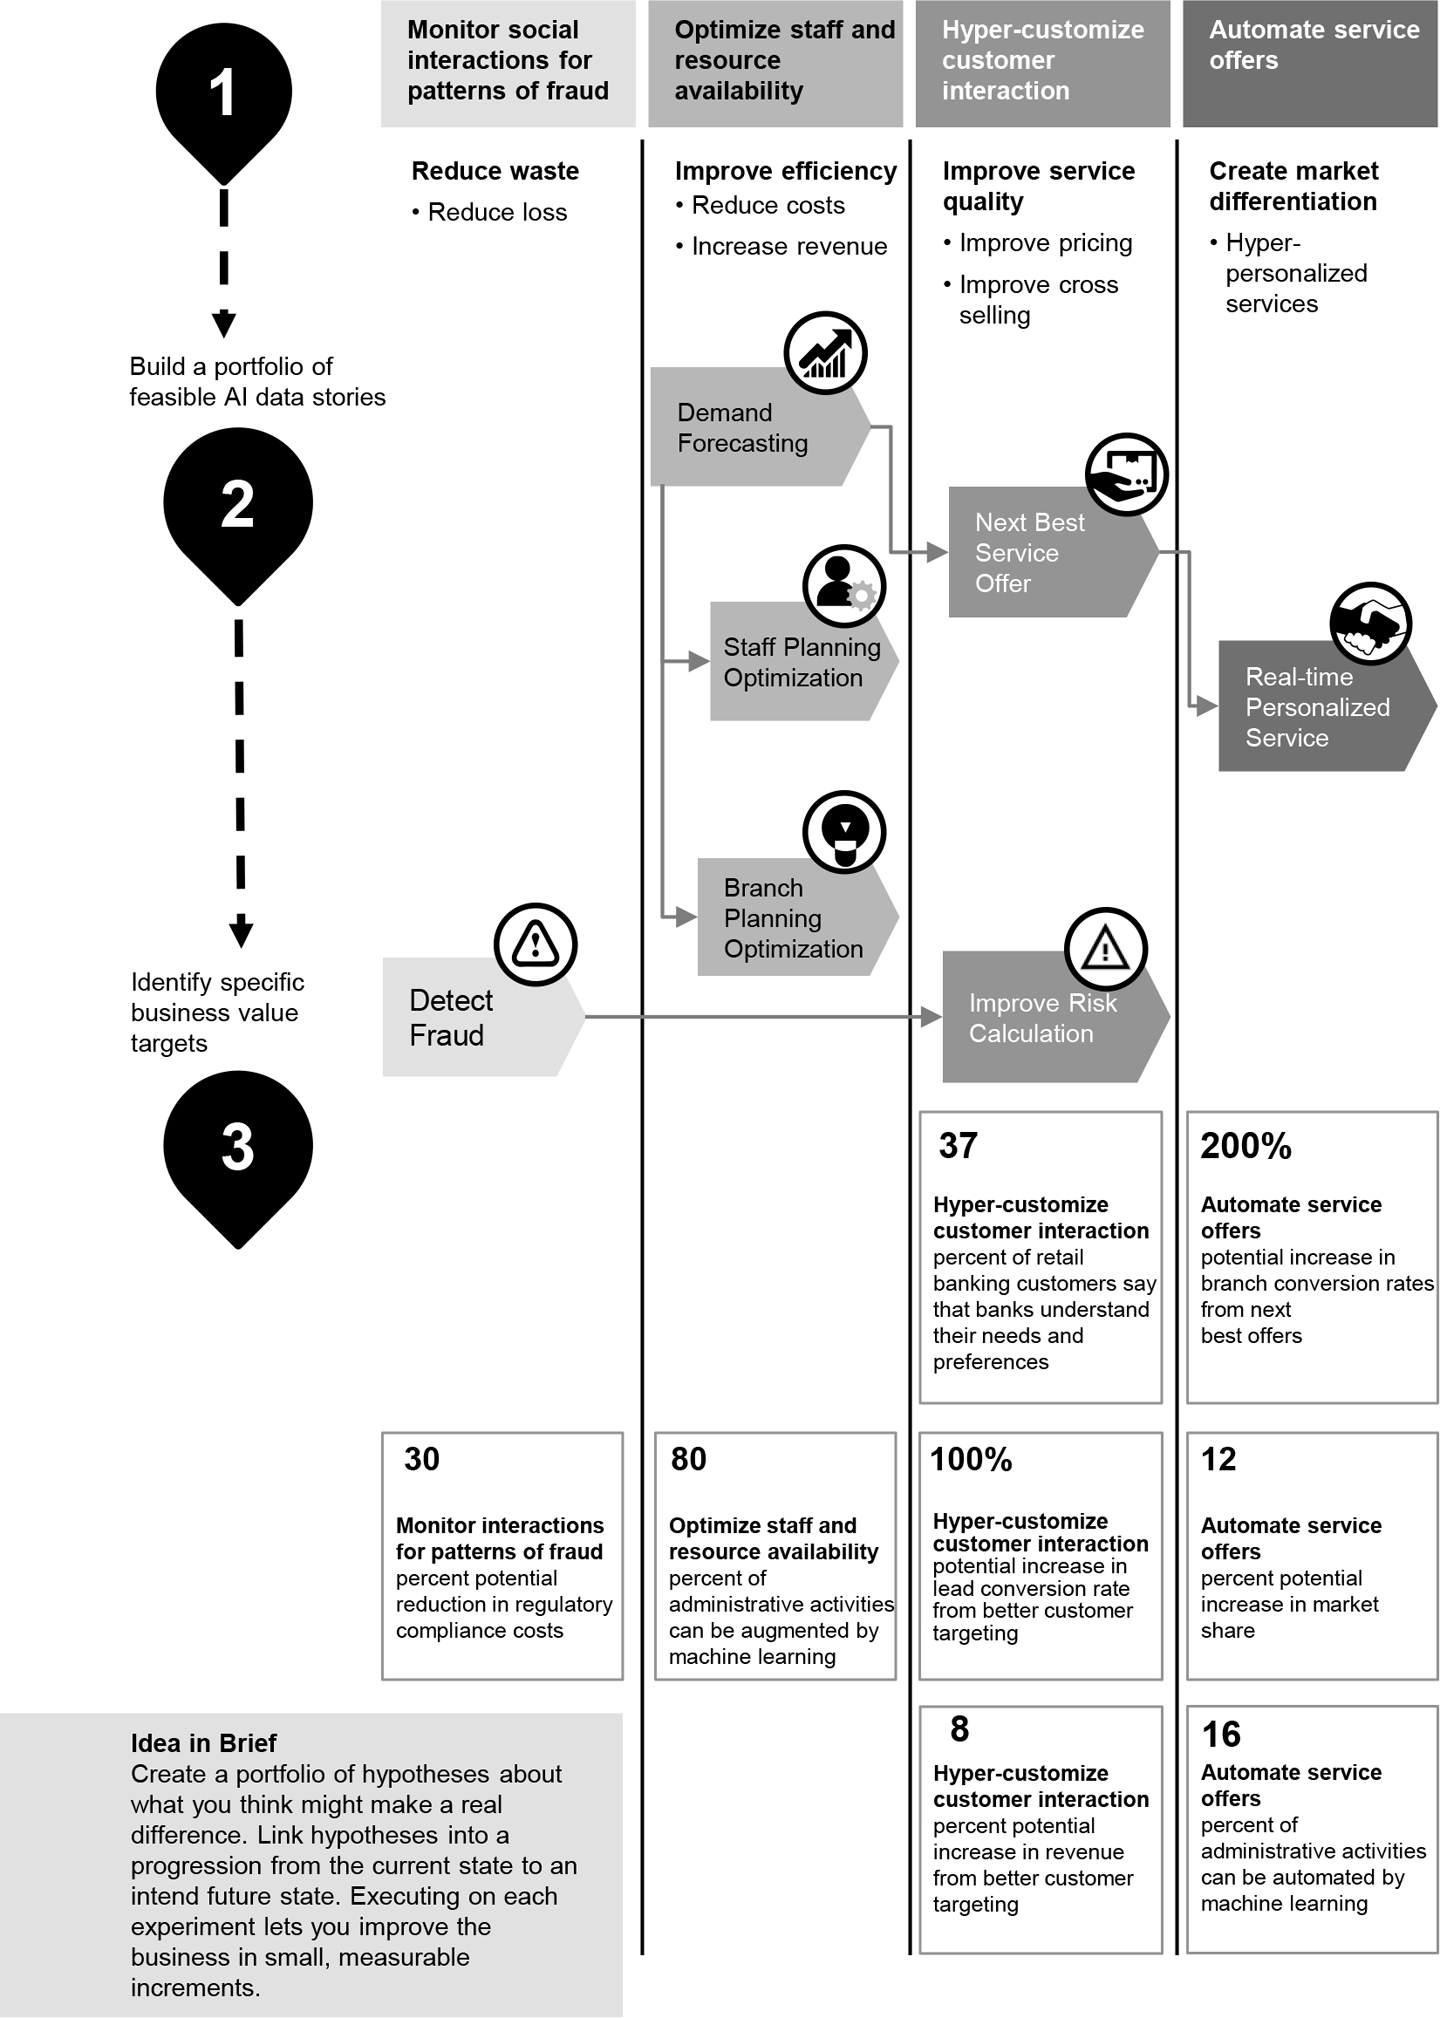
The AI data stories represent a portfolio of experiments that should drive your AI innovation program. Each data story can be distilled down to a simple hypothesis about what you think can be accomplished with the proper application of AI. Each hypothesis will eventually drive the development of individual projects.
Figure 2-1 demonstrates how you can evaluate your organization’s AI needs as a minimal hypothesis. Each swim lane represents an area of the business that could improve with better use of information. Inside each swim lane are AI data stories that describe the needed improvements. The boxes at the bottom show the expected business impact of successfully implementing each story.