
8
Modified Firefly-Based Maximum Power Point Tracking Algorithm for PV Systems Under Partial Shading Conditions
Chitra, A.1*, Yogitha, G.1, Karthik Sivaramakrishnan1, Razia Sultana, W.1 and Sanjeevikumar, P.2
1 School of Electrical Engineering, Vellore Institute of Technology, Vellore, India
2 Department of Energy Technology, Aalborg University, Denmark
Abstract
On handling partial shading conditions the power obtained at the output from the PV modules decreases drastically and the P–V characteristics of the photovoltaic modules is non-linear with multiple peaks including several local peaks and giving a single global peak. In such condition, it is challenging to track exact global maximum power point (GMPP). Conventional MPPT methods like Perturbation and Observe, Incremental conductance, Hill-climbing, etc. often lose to track GMPP as they often get confused with local peak and global peak resulting in extracting less power from PV modules. This paper presents modified firefly algorithm which is nature inspired implemented to track the GMPP. Its tracking efficiency is compared with the original firefly and also incremental conductance algorithm. The simulated results shows that the proposed algorithm can track high power, has better tracking quickness, and has effectively faster convergence time. The proposed modified firefly algorithm is fed to a DC–DC converter and the results are simulated.
Keywords: Evolutionary algorithm, partial shading, MPPT, firefly algorithm, GMPP
8.1 Introduction
Energy plays a noticeable part in the economic development and is important for the economy of a nation and even to the society. Future improvement and economic development relies upon the long-term accessibility of energy from the sources that are accessible, non-polluting, affordable, secure and non-destructive [1]. At present, non-renewable energy sources are the significant energy provider worldwide. Fossil fuels discharge nitrogen dioxide (NO2), carbon dioxide (CO2), carbon monoxide (NO), sulphur dioxide (SO2), and other different gases which when burnt create adverse impacts on the widely varied flora and fauna exists in the planet. The harmful impacts incorporate, however not restricted to, green-house effect and air pollution. These days, the utilization of sustainable energy sources could diminish the greenhouse emissions and gives positive effect to the world. Among all renewable energy sources, solar photovoltaic standout among the most vital sustainable energy sources in view of the long-term benefits, free maintenance and ecological friendliness. Nonetheless, the low energy conversion efficiency and high initial cost of photovoltaic module have been perceived as the significant prevention in its far spread acknowledgment. Tremendous measure of works have been done to increase the solar energy performance. With enhancing the most extreme power point tracking (MPPT) capacity, the solar system efficiencies can be created. It is one among the most conservative ways that can be possible. The primary challenge in the MPPT is the profoundly nonlinear characteristics curves of PV source which changes in like manner to the environmental impacts like temperature and solar irradiation. Since the V–I characteristics changes continuously, the maximum power point on P–V characteristics curve is not consistent, cause issues in the tracking execution. During partial shading conditions, where PV array receives a non-uniform solar irradiation, the maximum power-point tracking procedure turn out to be more complicated. The impact of partial shading is the PV curve complexity which gives various peaks and it is hard to track the real and exact true MPP. The MPPT procedures can be classified into two kinds which are conventional techniques and soft computing techniques. For the first type, the conventional or traditional techniques which incorporates hill-climbing (HC), P&O, fractional short-circuit and open-circuit voltage, incremental conductance (InCon). While for the second sort depends on soft computing technique which comprises of artificial neural network (ANN). Fuzzy logic controller (FLC) and evolutionary algorithm (EA). The conventional method is most generally utilized because of their advantages and simplicity in implementation. Conventional strategies can give great dynamic and steady-state performance under general conditions. However, they ordinarily show high oscillation around the operating point and unfit to track MPP under fast changing solar irradiance. Moreover, none of the conventional systems have ability to manage partial shading conditions (PSC). This is a result of the ineptitude of the conventional strategies to differentiate local and global peaks. In [2] and [3], the authors recommend that the P&O calculation is a standout among the most generally utilized algorithms in solar energy systems. Reference [3] calls attention to that the customary P&O algorithm neglects to track changing MPP amid changing irradiance and temperature conditions. Authors of [4] depict in detail the confinements of P&O algorithm in consistent ecological conditions and recommend a two-advance P&O strategy to expand the productivity of the regular algorithm. Reference [5] states that the primary utilization of P&O technique for MPP tracking was in the 1970s for aviation applications and states that the irritation period ought to be lower than the system settling time. The algorithm suffers from two major disadvantages. Determination of the ideal perturbation value is difficult. One should carefully perform the trade-off between speed of algorithm and accuracy to determine the perturbation value. A very small perturbation value slows down the algorithm, while a large perturbation value leads to higher oscillations around the MPP. In addition, when the irradiation and/ or cell temperature vary, the error in P&O algorithm is more. The incremental conductance algorithm is more qualified than P&O for varying environment conditions. Nonetheless, the execution is comparatively complex. Moreover, the ΔV can be utilized to increasing the MPP tracking, however a high value of ΔV will make the system away around the MPP, which is not worthy. Executing the incremental conductance requires the current and the voltage output values from the panel. Along this, it requires one current sensor and current sensor. This algorithm is normally actualized utilizing a microcontroller or a DSP. The authors exhibit the issues identified with ordinary P&O and InCon calculations and propose a variable-advance InCon technique for exact MPP tracking. They call the strategy as powerful self-optimization. Researches communicated their inventive by proposing soft computing techniques based on global search algorithm to discover global maxima amid shaded conditions. Among soft computing techniques ANN and FLC ended up proving their better dynamic and steady state execution than conventional techniques. These two strategies are hard to accomplish optimized design. FLC requires a specialist learning while ANN needs a lot of training information. To conquer these constraints, Evolutionary algorithm is the best method to manage the MPPT issue since it work in view of set of points rather than single point utilized as a part of conventional search and optimization strategies. Recently, a few EA techniques have been recommended, for example, the most prevalent ones among are particle swarm optimization (PSO), differential development (DE), Genetic Algorithm (GA). Among the EA methods, PSO is exceedingly potential because of its simpler structure, fast computation capability and easy implementation. In [6], the writers actualize the PSO algorithm for PV system under the partial shading conditions. The working of the MPPT has been obviously clarified. The standard PSO has additionally been changed to meet the practical contemplations. The writers pass on that the MPPT effectiveness is higher than 99.9%, simple usage and better convergence. In [7], the authors audit the PSO technique with reference to solar PV. The writers say that the PSO algorithm is incredible and non-resistive since they don’t require any subordinate estimations. In [8], the author utilizes PSO to decide the exhibit volt-age and afterward track the MPP in an independent PV framework. The effectiveness of following is seen in [9] to be over 98% with a union time of 14 ms. The writers have utilized PSO with the capacity of direct duty ratio to track the MPP of system so as to wipe out the PI controller which is utilized to control the duty cycle. The outcomes demonstrate that the proposed strategy has better execution when compared and the customary hill climbing algorithms. The authors of [10] suggest ant colony based search in the underlying phases of tracking took after by P&O technique. The proposed strategy, the local search capacity of P&O and global search capacity of ACO are both coordinated. This yields better performance, faster convergence and efficiency. The [11] presents the ACO based control technique to tune the PI controller for tracking MPP. The ACO is optimized utilizing fractional open-circuit voltage (FOC) technique to quickly and precisely track the MPP. In this paper, the performance of the system with conventional and evolutionary algorithm under PSC is com-pared. A meta-heuristic algorithm known as firefly algorithm is implemented and the modification is done for the firefly algorithm for tracking quickness, performance, tracking efficiency is improved in comparison with existing firefly algorithm and conventional incremental algorithm.
8.2 System Block Diagram Specifications
The proposed system consists of a solar PV panel as a source. It is connected to DC–DC boost converter with resistive load. The pulses to the boost converter are sent through a MPPT controller. System performance under partial shading conditions is tested with three different MPPT algorithms namely incremental conductance, firefly algorithm and modified firefly algorithm. The system block diagram in shown in the Figure 8.1.
Solar panel is the main source of the system. A solar PV array of two panels is connected in series. The solar panel used is developed through Simulink blocks present in MATLAB library and the panel specifications are taken from KC200GT solar panel data sheet. So two solar panels of a rating of 200 W are connected in series and the performance of the system only under PSC is considered and whether solar PV is operating at global peak and not at local peaks under PSC is observed. The solar specifications are mentioned in Table 8.1.
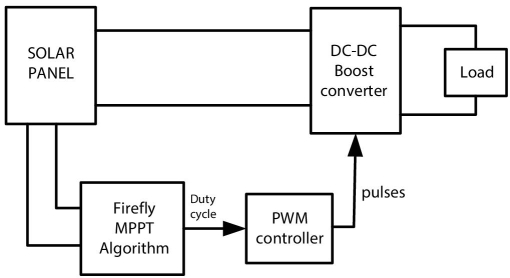
Figure 8.1 System block diagram.
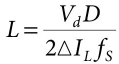
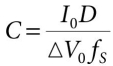
Boost converter is used to step-up the voltage at the load end. Here boost converter is used to connect with the load. The boost converter parameters L and C are designed using design specifications which are described in detail in Boost Converter Design section. Main objective of the work is to observe the modified firefly algorithm to get maximum power from the solar panel.
The MPPT block is used to extract the maximum power from the solar panel. Usually MPPT strategies are divided into 2 types conventional and evolutionary. The most commonly employed MPPT strategies are P&O, incremental conductance, hill-climbing, etc. all these conventional algorithms failed to extract maximum power under PSC as they often get confuse at local peak and global peak. This problem is sorted by employing evolutional algorithm taken from natural phenomenon. Some of the commonly used evolutionary algorithms are practical swarm optimization-PSO, artificial neural network, genetic algorithm-GA, Ant colony optimization-ACO, etc.
Table 8.1 Solar specifications.
| Specification | Value |
| Imp | 7.61 A |
| Vmp | 26.3 V |
| Isc | 8.21 A |
| Voc | 32.9 V |
| Ns | 54 |
| Pmax | 200.143 W |
8.3 Photovoltaic System Modeling
A Photovoltaic cell is considered as foundation stone of the solar panel. Many such Photovoltaic cells are grouped to form PV modules and thereafter PV arrays are formed by arranging PV modules in parallel and series connection. These PV arrays are usually used in PV generation system to generate electricity. A single diode structure of a Photovoltaic cell is modelled by using a current source, two resistors and a diode [12, 13]. The equivalent circuit of a single-diode photovoltaic cell is shown in Figure 8.2.
It consists of shunting resistance (Rs), series resistance (Rsh), the cell photo-current is represented by the current source Iph and a diode. Mostly, the value of Rs is so small whereas Rsh is very large, thus they are ignored to abridge the analysis. Generally based on the knowledge of semiconductors the main equation is mathematically derived and the V–I characteristic equation of the ideal Photovoltaic cell is given as
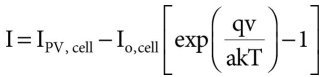
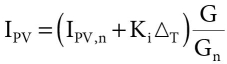
Equation (8.1) stated above about the fundamental photovoltaic cell does not show the I–V characteristics of Photovoltaic array. The cells connected in series will provide high voltage at the output whereas the parallel connected cells increases the current at the output. In practical applications the arrays consists of numerous PV cells connected and its features at the endpoints of the Photovoltaic array involves the accumulation of the other parameters added to main equation as is given as
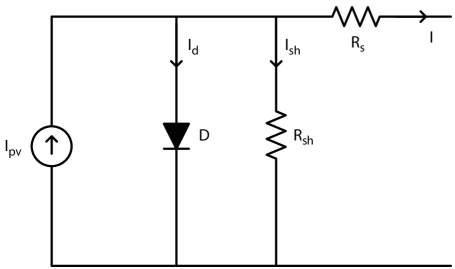
Figure 8.2 Equivalent circuit of single-diode model.
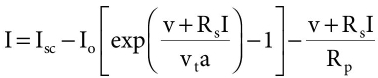
The cell used in practical areas has a stronger influence of series resistance Rs when the cell is operated in voltage source region and has a stronger influence of shunted resistance Rp when it is operated in current source region. The prediction Isc ≈ Ipv is usually made during the modeling of solar PV cell because the parallel resistance Rp is high and serial resistance Rs is low in practical devices. The equation of diode saturation current is stated as
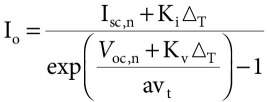
The saturation current Io depends on temperature so that according to practical temperature/voltage coefficient the temperature net effect is directly proportional of open-circuit voltage. Equation (8.3) shortens the complexity involved in the algorithm by eliminating the model error which is present near the open-circuit voltages, and thereby also at the many places on the I–V curve. The PV cell characteristics are the combination of the diode and current source. The diode I–V characteristics are derived separately and current source I–V characteristics are determined in separate fashion. In this case the diode and current source are circuited in parallel, hence by summing both the currents the characteristics of PV array are achieved. Figures 8.3 and 8.4 represent the P–V and I–V curves of a Photovoltaic cell.
It is inferred that the Photovoltaic cell functions as constant voltage source for the corresponding operating current at low values and as constant current source for the corresponding operating voltages at low values.
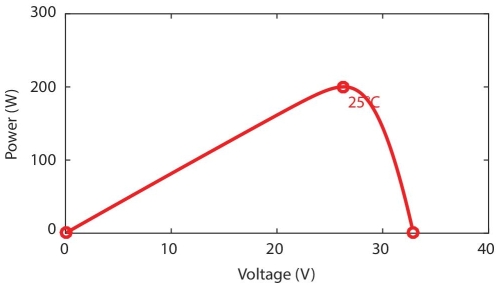
Figure 8.3 P–V characteristics of KC200GT solar panel.
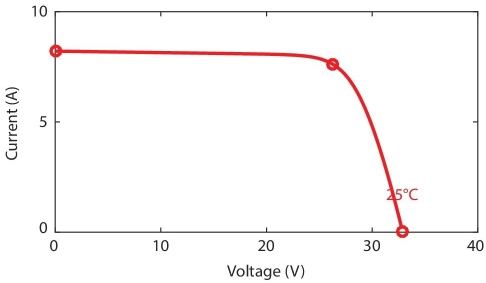
Figure 8.4 I–V characteristics of KC200GT solar panel.
8.4 Boost Converter Design
A DC–DC converter is one of the most important components of an independent Photovoltaic system. The voltage level of PV panels will be continuously varied because of the place of the operating point through which the direct supply of the DC PV power to electric load may be inappropriate. Usually, in a MPPT system the DC–DC converter is utilized to convert varying input power to a regulated power along with the desired level of voltage. Switch-mode DC–DC converters are presently most popular as they possess the advantages of high compatibility and small volume-size in comparison with other existing DC–DC converters. The main process of the DC–DC boost converter is to increase the voltage of the given DC power in the input. The circuitry of the boost converter is shown in the following Figure 8.5.
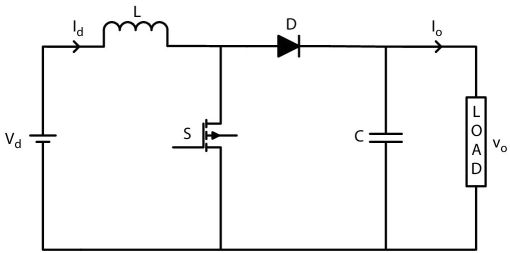
Figure 8.5 Boost converter.
Diode will be in reverse bias condition when during on state of the switch. The input voltage will be the cause for the inductor current to increase linearly. In this considered case the output will be isolated and capacitor will discharge to supply the load. And when the switch is in off condition, diode will be in forward bias i.e. diode is conducting. At this time the load will get supply from the inductor and the input voltage source. The inductor current waveform during the conduction is given below as we can see that the inductor current is continuous. During the steady state conduction of the converter. Duty ratio is given by Equation (8.5). The following equations calculate the operation of the inductor and capacitor in continuous conduction mode.
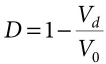
From Equation (8.5), we can see that the output voltage is increasing, as the switch’s duty cycle is increasing. Also if any change occurs in the duty cycle of the switch there will be changes in the current at the input and output of the above stated converter.
8.5 Incremental Conductance Algorithm
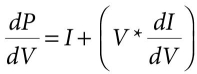
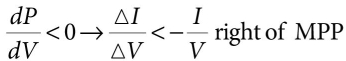
This MPPT technique abides the principle that the slope of the P–V characteristic is positive when the MPP is greater than the real power. When the MPP is lesser than real power the slope of PV curve is negative, and the slope is zero when the real power is same as the MPP. In other words, this strategy utilizes the V–I curve slope to track MPP. Consider the maximum power (PMPP) and power output (P) equations.
Differentiate with respect to voltage,
The differential of the power have to be equated to zero for the power to be maximum. In other words, this implies,
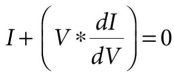
Which is approximated as,
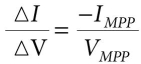
By evaluating Equation (8.12), the MPP is tracked. The conditions to track MPP are as explained by Equations (8.13) to (8.15),
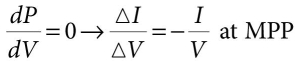
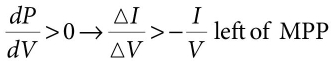
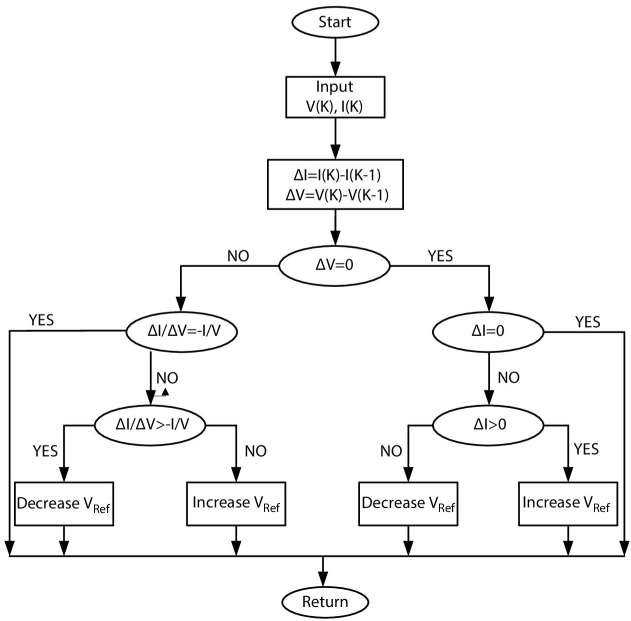
Figure 8.6 Incremental conductance algorithm flowchart.
The incremental conductance algorithm flowchart is stated below in the Figure 8.6.
8.6 Under Partial Shading Conditions
In this condition, the shaded cell in the series connection will block the current from passing through it. To get away with this circumstance a bypass diode is circuited across the cells to make flow the current from the un-shaded cells. Because of this link of bypass diodes there will be multiple peaks formation in I–V and P–V graphs. The above modeled system is now simulated with the three different solar irradiation levels and the characteristic curves of current, voltage and power are observed. In this report, two different shading patterns are considered for the clear understanding and also for analyzing the behavior of the PV system under different shading conditions. The two different shading patterns are: 1. For 1,000 and 800 w/m2 irradiation level; 2. For 800 and 600 w/m2 irradiation level. The characteristic curves of I–V and P–V for the two considered shading patterns with multiple peaks are represented in the Figures 8.7 and 8.8.
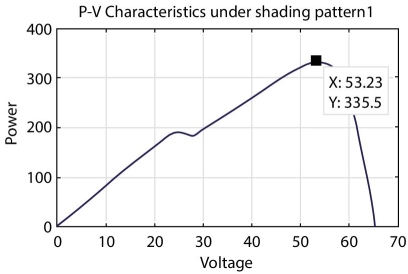
Figure 8.7 P–V characteristics under shading pattern 1.
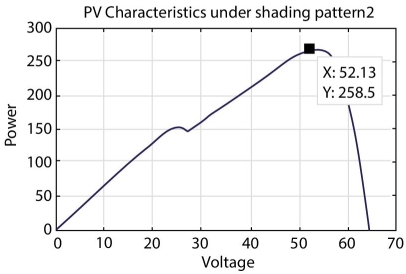
Figure 8.8 P–V characteristics under shading pattern 2.
8.7 Firefly Algorithm
The firefly algorithm, is relatively unique and evolutionary algorithm proposed by Yang in 2008 [14–16]. FA is a bio-inspired stochastic optimization technique based on swarm behavior and the population of fireflies [17]. It is a meta-heuristic algorithm developed for the optimization of problems from the flashing nature and the movement of fireflies. The fireflies uses their fundamental flashes in order to draw attention of the prey towards them and also to find their coupling partners. The FA mainly consists of two elements which are brightness and attraction degree. The firefly movement, direction and step size are determined by the brightness which is reflected from the location. Once the updating of attraction degree and brightness of fireflies is completed all the fireflies will move towards the brightest firefly in order to achieve optimization goal. In the case of expansion problem, the firefly illumination will be always linear to the objective function value. The following three assumptions are made to simplify the implementation of firefly logic. Firstly, all the fireflies are of same gender so that each one can be get fascinated to the other firefly irrespective of their gender. Secondly, the relative brightness between the two fireflies is directly proportional to the degree of attractiveness which can be defined by calculating the relative distance between them. The firefly with the less brightness will move towards the firefly with more brightness until all the fireflies in the colony are compared except for itself. The firefly move randomly when there is no brighter one in that colony. Lastly the light intensity or brightness of a firefly is completely dependent on the value of objective function. Mathematically, the FA algorithm can be expressed by the following equations. Let i, j be the two fireflies which are located at the positions Xi and Xj, respectively and are separated by the distance rij. The distance between the two fireflies is formulated as
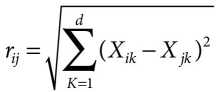
Where Xik and Xjk are the ith and jth firefly’s spatial coordinates of kth component and d is the number of dimensions. For maximum power point applications the number of dimensions is considered as one. Thus, the distance between two fireflies is simplified as
is the attraction degree which can be determined using the distance rij and is formulated by
In the above mentioned equation, γ is the parameter which is related to the variations of light intensity and is named as absorption coefficient which has its range [0–10] and m is a integer and is chosen as 2 [18]. β0 is initial attractiveness at which is taken as 1. Thus, the brighter firefly definitely decides the other fireflies’ position in its particular neighbourhood [19]. For the case, if the brightness of jth is greater than the ith firefly, the position of firefly i is updated by the new position formula which is mentioned as below
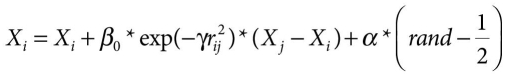
Where α is random movement value which has range of [0, 1] and it is a constant value throughout the execution of the program. For every single movement of firefly rand is a diffused random number which lies between 0 and 1. Equation (8.19) clearly depicts that the firefly movement is affected by the randomization and the brightness or attractiveness of a brighter firefly. This randomization concept affords a very good way to move in search of global scale by moving away from local search. In general, the large value of α helps in facilitating the firefly globally while the small value tends to local search [20].
8.8 Implementation Procedure
The boost converter poses as a platform between the load and the Photovotaic system. The firefly algorithm controls the operation of the DC–DC converter and directs it to work at its optimum duty cycle which corresponds to the MPP. The implementation steps of firefly algorithm towards MPPT undergo setting of parameter, firefly initialization, evaluation of brightness, updating firefly position, checking for termination criteria and reinitiating. All the mentioned steps are discussed in detail in the following steps:
Step 1: Setting of Parameters: Initialize the constant parameters of the firefly algorithm, namely γ, α, m, β0 number of fireflies N i.e. population size of fireflies in the colony, maximum iterations count which is the termination criteria of the algorithm. Duty cycle for the DC–DC converter is taken as the position of firefly. The obtained power from the Photovoltaic module is considered as the bright-ness of every firefly with respect to location of the firefly.
Step 2: Firefly Initialization: All the fireflies are located in the permitted space having upper boundary and lower boundary limitations. Here, the boundary limitations represent Dmax and Dmin which are the two extreme values of duty cycle of the converter. Dmax is set to 98% whereas Dmin in set to 20% in this work. Thus, it is cleared that the duty ratio is represented by the position of the firefly. The population size of fireflies is considered as 6 based on the general analysis that, if the number of fireflies increases it automatically results in the increased computing time, whereas the less population size of fireflies will be resulting in local maximum.
Step 3: Evaluation of Brightness: In this step, depending upon the firefly position, the boost converter is operated and the Photovoltaic module’s power obtained at the ouput is considered as respective firefly’s light intensity or brightness corresponding to each duty ratio. For the entire population of fireflies this step is repeated and the brightness of each firefly is generated.
Step 4: Updating Firefly Position: The firefly possessing higher or maximum brightness will remain in its respective position while the other fireflies with less brightness will update their position accordingly. The new position of the firefly is calculated with the help of position formula which is mentioned in Equation (8.19).
Step 5: Checking for Termination Criteria: The optimization algorithm continues to execute upto the last iteration as mentioned in step 1 and the program is terminated once the termination criteria is reached. If this is not the case, it will go to step 3 and again the loop gets executed. The algorithm is terminated if all the fireflies’ displacement value in successive steps achieves set lowest value. The boost converter works at optimum duty ratio parallel to the global maximum point once the firefly algorithm gets terminated. The flowchart of the algorithm is stated in Figure 8.9.
8.9 Modified Firefly Logic
With reference to the position formula as mentioned previously in Equation (8.19) in which α represents random value of distribution. The position equation represents three major terms which the movements of fireflies consist, they are, current location of firefly i, the locomotion of firefly i towards the other brighter firefly and the random movement of it which persists the period between [0, 1]. T. Niknam introduced modified firefly algorithm for the elucidating of the economic dispatch problems. It can be seen that there are two major parameters that has to be tuned to outperform the firefly algorithm in tracking efficiency and speed of MPP. The stated modified fire-fly algorithm decreases the randomness of all the fireflies by the help of utilizing α which is said to be the randomization parameter. In modified firefly algorithm process, the random parameter α will be updated for every iteration and the change of iterations is achieved by implementing a simple modification to α (randomization parameter). For each iteration, α is decremented by 0.0001. The tracking efficiency of the MPP will be increased by the MFA. By this way when compared to last iteration the firefly will move much faster for every next iteration. This modification improves the convergence rate than that of standard firefly algorithm with the same accuracy and effectiveness of tracking the MPP.
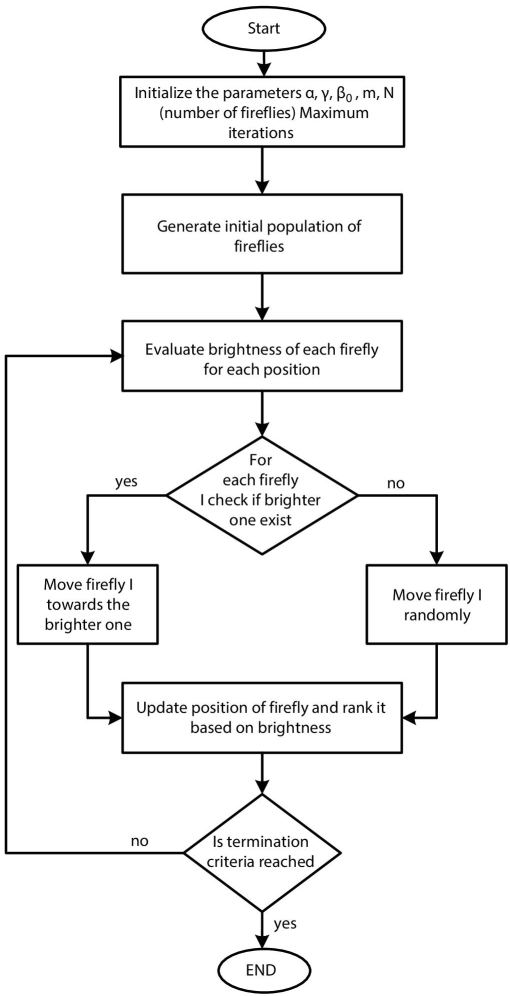
Figure 8.9 Firefly algorithm flowchart.
8.10 Results and Discussions
For shading pattern 1: Figure 8.10 represents the power obtained at output, current and voltage from the solar panel with irradiation pattern of 1,000 and 800 w/m2 for incremental conductance (a), Firefly (b) and Modified firefly algorithm (c). It can be inferred that with modified firefly algorithm maximum power of 330 W, firefly algorithm is able to trail 326 W from the total power of 335.5 W, whereas conventional algorithm (i.e. Incon) is able to extract 310 W of power only. It can be inferred that with modified firefly algorithm maximum voltage of 51.1 V, firefly algorithm is able to track 50.2 V. Whereas conventional algorithm (i.e. Incon) is able to extract 47.9 V. It can be inferred that with modified firefly algorithm maximum current of 6.47 A, firefly algorithm is able to track 6.49 A, whereas conventional algorithm (i.e. Incon) is able to extract 6.48 A. For shading pattern 2: Figure 8.11 represents the power obtained at output, current and voltage from the solar panel with irradiation pattern of 800 and 600 w/m2 for incremental conductance (a), Firefly (b) and Modified firefly algorithm (c). It can be inferred that with modified firefly algorithm maximum power of 255 W, firefly algorithm is able to track 254 W from the total power of 268.5 W, whereas conventional algorithm (i.e. Incon) is able to extract 247 W of power only. It can be inferred that with modified firefly algorithm maximum voltage of 51.30 V, firefly algorithm is able to track 51.10 V. Whereas conventional algorithm (i.e. Incon) is able to extract 49.59 V. It can be inferred that with modified firefly algorithm maximum current of 4.97 A, firefly algorithm is able to track 4.97 A, whereas conventional algorithm (i.e. Incon) is able to extract 4.98 A. Table 8.2 shows the comparative results between incremental conductions, firefly and modified firefly algorithms. From these outcomes it can be inferred that the tracking efficiency of the modified firefly algorithm is high with 98.36% and 96.847% for the both shading patterns when compared to conventional and firefly algorithm.
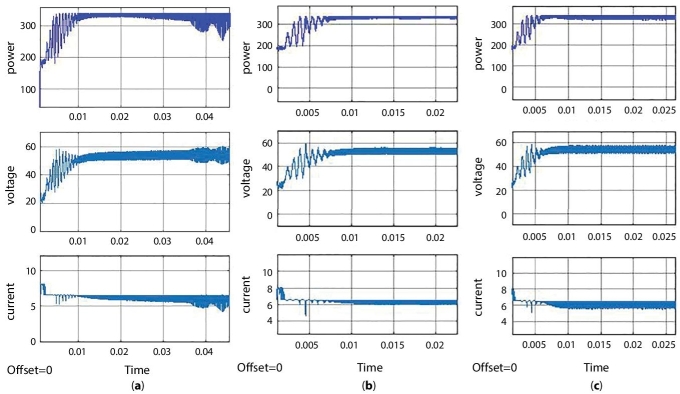
Figure 8.10 Output graphs for (a) Incremental Conductance, (b) Firefly algorithm and (c) Modified firefly algorithm for shading pattern 1.
With the better tracking speed of 6.4 ms for shading pattern 1 and 1.8 ms for shading pattern 2. From the obtained results we can see that the modified firefly algorithm had higher efficiency and less tracking speed and also maximum power can be utilized from the solar panel.
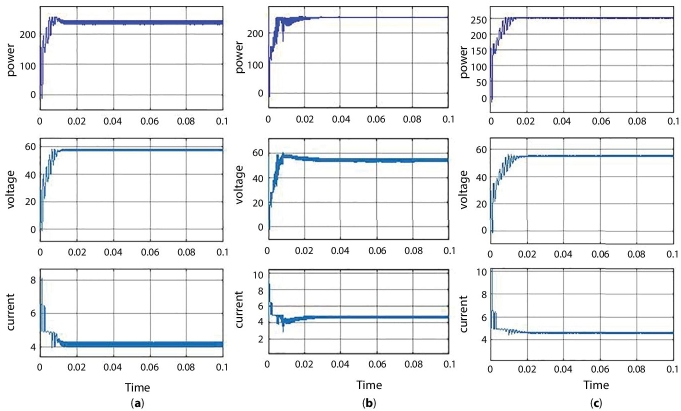
Figure 8.11 Output graphs for (a) Incremental Conductance, (b) Firefly algorithm and (c) Modified firefly algorithm for shading pattern.
Table 8.2 Comparative study of algorithms.
| Shading pattern | MPPT Techniques | Power (watts) | Voltage (volts) | Current (amperes) | Maximum Power (watts) | Tracking Efficiency (%) | Tracking speed (ms) |
| 1 | Incremental | 310.6 | 47.9 | 6.48 | 335.5 | 92.578 | 15 |
| FA | 326 | 50.2 | 6.49 | 97.168 | 8.7 | ||
| MFA | 330 | 51.1 | 6.47 | 98.360 | 6.4 | ||
| 2 | Incremental | 247 | 49.59 | 4.98 | 268.5 | 93.801 | 1.2 |
| FA | 254 | 51.10 | 4.97 | 96.467 | 3.2 | ||
| MFA | 255 | 51.30 | 4.97 | 96.847 | 1.8 |
8.11 Conclusion
The simulation of MPPT strategy with MFA for PV system is implemented with the help of MATLAB/Simulink and the performance analysis of the system is presented. Our concept is to update parameter for each looping step only then to achieve quicker convergence which increases the tracking speed and tracking efficiency. Due to the significance of Photovoltaic systems specifically in the area of renewable energy sources, this paper presents an efficient method for tracking Maximum Power Point for photo-voltaic array using Modified Firefly Algorithm. A better performance is exhibited by the proposed Modified Firefly Algorithm to track MPP even when shading conditions are partial. The performance comparison between incremental conductance, Firefly algorithm and Modified firefly algorithm are tabulated. The proposed algorithm was tested with varying irradiance and temperature conditions in order to simulate the results. Obtained simulated results show that the MFA can accurately track MPP and has superior tracking quickness. The stated algorithm decreases the fluctuations of the Firefly Algorithm in steady state condition.
References
- 1. Oyedepo, S.O., Energy and sustainable development in Nigeria: The way forward. Energy Sustain. Soc. 2, 15, no.1, 2012.
- 2. Tafticht, T., Agbossou, K., Doumbia, M.L., Cheriti, A., An improved maximum power point tracking method for photovoltaic systems. Renew. Energy, 33, 7, 1508–1516, 2008.
- 3. Hua, C. and Lin, J., An on-line MPPT algorithm for rap-idly changing illuminations of solar arrays. Renew. Energy, 28, 7, 1129–1142, 2003.
- 4. Mamarelis, E., Petrone, G., Spagnuolo, G., A two-steps algorithm improving the P&O steady state MPPT efficiency. Appl. Energy, 113, 414–421, 2014.
- 5. Silva, F.A., Power Electronics and Control Techniques for Maximum Energy Harvesting in Photovoltaic Systems (Femia, N. et al.; 2013) [Book News]. IEEE Ind. Electron. M., 7, 3, 66–67, 2013.
- 6. Ping, W., Hui, D., Changyu, D., Shengbiao, Q., An improved MPPT algorithm based on traditional incremental conductance method. In 2011 4th International Conference on Power Electronics Systems and Applications, vol. 1–4, IEEE, 2011.
- 7. Hare, A. and Rangnekar, S., A review of particle swarm optimization and its applications in solar photovoltaic system. Appl. Soft Comput., 13, 5, 2997–3006, 2013.
- 8. Azab, M., Optimal power point tracking for stand-alone PV system using particle swarm optimization. In 2010 IEEE International Symposium on Industrial Electronics, pp. 969–973, 2010.
- 9. Ishaque, K., Salam, Z., Shamsudin, A., Application of particle swarm optimization for maxi-mum power point tracking of PV system with direct control method. In IECON 2011-37th Annual Conference of the IEEE Industrial Electronics Society, pp. 1214–1219, 2011.
- 10. Besheer, A.H. and Adly, M., Ant colony system based PI maximum power point tracking for standalone photo-voltaic system. 2012 IEEE International Conference on Industrial Technology, pp. 693–698, 2012.
- 11. Sundareswaran, K., Vigneshkumar, V., Sankar, P., Simon, S.P., Srinivasa Rao Nayak, P., Palani, S., Development of an improved P&O algorithm assisted through a colony of foraging ants for MPPT in PV system. IEEE T. Ind. Inform., 12, 1, 187–200, 2015.
- 12. Ramaprabha, R. and Mathur, B.L., Genetic algorithm based maximum power point tracking for partially shaded solar photovoltaic array. Int. J. Res. Rev. Inf. Sci. (IJRRIS), 2, 161–163, 2012.
- 13. Sridhar, R., Jeevananathan, D., ThamizhSelvan, N., Banerjee, S., Modelling of PV array and performance enhancement by MPPT algorithm. Int. J. Comput. Appl., 7, 5, 0975–8887, 2010.
- 14. Tsai, H.-L., Tu, C.-S., Su, Y.-J., Development of generalized photovoltaic model using MATLAB/SIMULINK. In Proceedings of the world congress on Engineering and Computer Science, pp. 1–6, 2008.
- 15. Yang, X.-S., Firefly algorithms for multimodal optimization, in: International symposium on stochastic algorithms, pp. 169–178, Springer, Berlin, Heidelberg, 2009.
- 16. Chandrasekaran, K. and Simon, S.P., Optimal deviation based firefly algorithm tuned fuzzy design for multi-objective UCP. IEEE T. Power Syst., 28, 1, 460–471, 2013.
- 17. Niknam, T., Azizipanah-Abarghooee, R., Roosta, A., Reserve constrained dynamic economic dispatch: a new fast self-adaptive modified firefly algorithm. IEEE Syst. J., 6, 4, 635–646, 2012.
- 18. Yang, X.-S., Multiobjective firefly algorithm for continuous optimization. Eng. Comput., 29, 2, 175–184, 2013.
- 19. Milea, L. et al., Theory, Algorithms and Applications for Solar Panel MPP Tracking, in: Solar Collectors and Panels, Theory and Applications, pp. 187–210, 2010.
- 20. Xiao, W., Ozog, N., Dunford, W.G., Topology study of photovoltaic interface for maximum power point tracking. IEEE Trans. Ind. Electron., 54, 3, 1696–1074, 2007.
Note
- * Corresponding author: [email protected]