
Computing with/on Images
11.1 INTRODUCTION
In the recent years, the problem of reasoning with/on images has been addressed from several points of view. In Reiter and Mackworth (1989/90), for example, the problem of image interpretation and depiction is considered, in Wang and Lee (1993) that of visual reasoning, in Chang (1986), Wittenburg et al. (1990) and Golin (1991) definitions are suggested for visual languages and related compilers. Chang (1995) also proposed active indexes as a tool for efficient image manipulation, i.e. storage, retrieval and reasoning. However the execution of real tasks, such as deriving a diagnosis from a biopsy or designing a mechanical part with a CAD system, requires computing with/on images, i.e., the ability to execute image analysis, synthesis and manipulation within the same session.
To perform the above activities we propose a common framework that formalizes the image, the description domains and the mapping between the two: such domains are described as formal languages. This proposal stems from the study of the user-machine main channel of communication – the visual one – and allows the specification, design and implementation of systems to execute the different activities on or with images. In a typical interactive session, a person (from here on named ‘user’) looks at a display, interprets the image appearing on it to understand the state of his/her work, decides which action to perform next and interacts with the machine to have the action performed.
On the user side, the signal sent to the machine may be as simple as a button press on a certain zone of the screen or as complex as drawing a new structure on the screen. See Figure 11.1 for a typical screen layout containing the digital image of a biopsy with which a physician is interacting. For a detailed comment see Section 11.3. On the machine side, the program manages the screen bitmap: the image on the screen materializes this bitmap as organized by the program which is in control of the machine; the messages generated by the user interacting through the screen are captured exploiting the one-to-one correspondence between the bitmap and the screen elements to be interpreted by the program. In the sequel we will refer to any kind of bi-directional interaction as a user-program one.
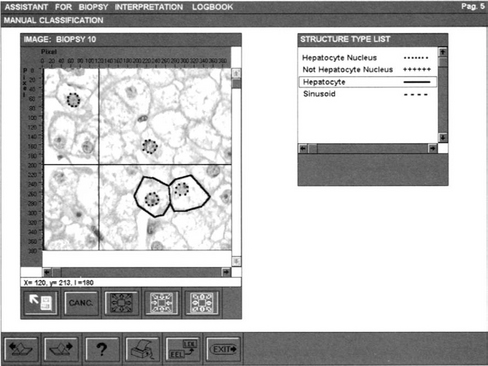
Figure 11.1 Screen display during interactive classification of characteristic patterns in a liver biopsy.
The screen becomes the communication surface between the user and the program. This surface assumes the role of a bi-directional channel in the transmission of a message – the image on the screen – between user and program (Tondl, 1981).
Once captured by the system, however, the image is interpreted by the programs which control the machine following a well defined model of the activity to be performed. This model derives from the programmer’s understanding of the activity to be performed and of the user’s expectations, goals and habits – the so-called ‘user model’ in Kobsa and Wahlster (1989).
Visual languages will be here introduced exploring the nature of the visual messages in the user-program communication. The way in which the program associates a computational meaning to an image and, conversely, the way in which it generates a pictorial description of a computation on the screen are examined. A definition of a visual sentence as an interpreted image is then proposed: visual languages are viewed as sets of visual sentences in a bi-directional user-program dialogue.
From this perspective, the study of visual languages appears as the extreme evolution of the linguistic approach to pattern recognition as it was initially introduced by Narashiman (1969) and Shaw (1969) to derive image descriptions which are meaningful in some knowledge domain (Fu and Tsai, 1980).
In the last ten years, the study of visual languages has evolved into a separate discipline to meet the new requirements created by the diffusion of end-user computing (Brancheau and Brown, 1993) and by the integration of information from different sources as, for example, in the manipulation of documents for the design, management and manufacturing of industrial objects. Visual languages intend to solve, or overcome, these problems by formalizing the languages developed and exploited by users to express and communicate problems and solutions in their own working environments. In such languages text, images and diagrams are combined. Our approach to the definition of visual languages is general and can be used to derive parameters for the analysis of existing visual systems. Five such systems are examined showing how the proposed definition provides a basis on which computing with/on images activities can be described.
11.2 TOWARD VISUAL LANGUAGES
Informally, a visual language is a set of images associated with their computational meaning. To make this concept precise, we first introduce the definition of digital image as a bidimensional string. Next, the sets of images occurring in a user-program communication are characterized as languages.
11.2.1 Pictorial languages
A digital image i is a bidimensional string
where rmax and cmax are two integers and P is a generic alphabet.
Definition 2
Each element of a digital image is called a pixel.
A pixel is described by the triple (r, c, p) where r ∈ {1,…, rmax} is the row, c ∈ {1,…, cmax} is the column and p ∈ P.
Definition 3
A structure is a subset of a digital image.
If the structure is rectangular, it is a 2D string itself, a substring of the original digital image and a digital image on its own.
Definition 4
A pictorial language PL is a subset of the set I of the possible digital images:
The definition of image as a bidimensional (2D) string highlights that its elements can be ordered in several ways. On the contrary, a one-dimensional (1D) string s (defined as s: {1,…, n} → V) exploits the linear ordering only, and the consequent definition of concatenation. Linear ordering is not privileged in the analysis of 2D strings, where it is instead important to state which one of the possible orderings is to be exploited (Golin, 1991) and hence which definition of concatenation is to be adopted (Rosenfeld and Siromoney, 1993).
Several types of digital image (from now on simply image) can be defined depending on the algebraic structure which is imposed on the defining alphabet. For example:
1) Gray level images (GLI) are defined on a segment of the integers: P = {0,…, q} with q = 2h − 1, h being an integer. GLI can be operated on by numeric or weaker operators.
2) Black and white images (BWI) are defined on P = {0,1}. BWI can be operated on by Boolean or weaker operators.
3) Segmented images (SI) are defined on a set of arbitrary labels P = {li, …, lk} on which no numerical structure is imposed. SI can be operated on by nominal and order scale operators.
Note that in SI, each label li is in general associated with a meaning. The segmented image appears as partitioned into (possibly non-connected) sets, each set being identified by a label, which denotes its meaning.
11.2.2 Characteristic patterns
The meaning of an image may be coded as a description constituted by vectors of values, each value being assumed by an attribute. Values are traditionally called features (Haralick and Shapiro, 1991). As an example of image description we may refer to Figure 11.1. Here the window IMAGE: BIOPSY 10 shows a gray level histological image in which four nuclei and two cells have been outlined. A description of this image is ![]() where 10 is the image identifier, 4 is the value of a first attribute, the CURRENT # OF HEPATOCYTE NUCLEI and 2 the value of a second attribute, the CURRENT # OF CLASSIFIED HEPATOCYTES. Structures, being images in turn, can be similarly described. A hepatologist can, for example, describe the rightmost hepatocyte nucleus in Figure 11.1 by
where 10 is the image identifier, 4 is the value of a first attribute, the CURRENT # OF HEPATOCYTE NUCLEI and 2 the value of a second attribute, the CURRENT # OF CLASSIFIED HEPATOCYTES. Structures, being images in turn, can be similarly described. A hepatologist can, for example, describe the rightmost hepatocyte nucleus in Figure 11.1 by ![]() where the first number is the nucleus identifier, the next two numbers are the (X, Y) COORDINATES of the leftmost pixel of the structure, the fourth is its AREA and the fifth is its PERIMETER.
where the first number is the nucleus identifier, the next two numbers are the (X, Y) COORDINATES of the leftmost pixel of the structure, the fourth is its AREA and the fifth is its PERIMETER.
In syntactic pattern recognition, this definition has been extended to admit not only measurements in the rational scale, but also in scales which admit fewer operators, such as the nominal or the ordinal ones (Siegel, 1956). Hence the description of a hepatocyte, whose sub-structures are the fourth classified nucleus and the first classified membrane, can be:
where ‘normal’ denotes the nominal value of the attribute STATE and (‘nucleus4’,’membranel’) the two nominal components of the attribute CHARACTERISTIC PATTERNS. These nominal components identify two structures in the image that the hepatologist considers important for understanding the image meaning.
In general, the description of an image requires the recognition of those structures that an observer considers necessary to understand and communicate its meaning. These structures are named ‘characteristic patterns’ (or ‘form features’ (Cugini et al., 1988)).
An observer identifies the characteristic patterns of an image on the basis of their functional meaning, which derives from their geometrical, topological, chromatic and morphological properties.
The users identify characteristic patterns of similar meaning through a common name.
Definition 5
A characteristic pattern (or form feature) is a structure identified by a name.
The set of characteristic patterns defining the meaning of an image depends on the context and the goals to be achieved on or through the image. If the interpretation context changes, the set of characteristic patterns recognized in an image may also change. An example is shown in Figure 11.2 where different interpretations of a remote sensed image are singled out.

11.2.3 Description languages
An image can be described by enumerating the characteristic patterns an observer extracts from it. More precisely, an observer describes an image both by a name – as a whole characteristic pattern – and a set of features.
The name resumes the observer’s overall interpretation of the image and the features are the values of the attributes the observer decides as relevant to describe the image. Some of these features in turn may be names of characteristic patterns. Again, the observer can describe such a characteristic pattern by a vector containing its name and the values of its features. More precisely: let T be the set of names of characteristic patterns and ![]() and
and ![]() where At is the set of the attributes of the characteristic patterns denoted by the name t and Pai is the domain of the attribute ai (Fu and Tsai, 1980).
where At is the set of the attributes of the characteristic patterns denoted by the name t and Pai is the domain of the attribute ai (Fu and Tsai, 1980).
Definition 6
The description of a characteristic pattern is the (m + 1)-tuple constituted by a name t ∈ T and a m-tuple of properties:
This description has the structure of an attributed symbol (Knuth, 1968). Indeed: let V be an alphabet and ![]() and
and ![]() where Av is the set of attributes of the symbol ν and Pai is the domain of the attribute ai.
where Av is the set of attributes of the symbol ν and Pai is the domain of the attribute ai.
Definition 7
An attributed symbol is the (m + 1)-tuple constituted by a symbol v ∈ V and m elements pai ∈ Pai, 1 ≤ i ≤ m. We call W = V × Pa1 × … × Pam the alphabet of attributed symbols.
11.2.4 A generalization of the concept of description
A description of an image can refer not only to static properties of the structure, but also to their possible evolution in time, i.e. dynamic properties. The specification of such evolution can be a program; in this case the description becomes executable. For example, in an object-oriented approach each attributed symbol defines an object, in which the attributes play the role of the state variables of the objects and the names in T play the role of names of methods. More generally, if t ∈ T denotes a type of characteristic pattern (say tombolo in Figure 11.2a and d) in the description of an image, it may be interpreted as the name of the class of objects associated with that type of characteristic pattern.
This generalization imposes some constraints on the set of attributes. A full description of the object must include:
11.3 VISUAL SENTENCES
Computing with/on images requires the integrated management of images and descriptions. In the different stages of the computation, the program can be required to describe or synthesize an image as well as to retrieve the description associated with a characteristic pattern or conversely to present the characteristic pattern associated with a given description. To perform these activities it is necessary to specify the relations among characteristic patterns in the image and the attributed symbols in the description. Figure 11.3 exemplifies the relations between the characteristic patterns of a liver biopsy and the corresponding attributed symbols in a description. The description consists of a string of seven attributed symbols. Let nu ∈ T denote cell nuclei. The two attributed symbols with name nu describe the two nuclei and are characterized by five features: 1) numeric identifier, 2) position identifier (x, y), 3) area, 4) perimeter, 5) diagnostic value.

Characteristic patterns and attributed symbols are related in two ways: first, each characteristic pattern in the original image must be associated with an interpretation, so that a user selecting the characteristic pattern on the screen may reach such interpretation. Second, an inverse relation must be established associating at least a characteristic pattern with each attributed symbol (Chang et al., 1987). Note that the image i is itself a characteristic pattern (a 2D string) described by an attributed symbol in the description d (e.g. the symbol bp in Figure 11.3). The characteristic patterns of i are described by the other attributed symbols in d.
Hence, a visual sentence vs can be defined:
11.3.1 An insight on the relation between images and descriptions
Note that <int, mat> must be defined taking into account that they may relate a substring to a finite set of substrings. For example, a pixel may belong to several characteristic patterns (and hence be related to several attributed symbols) and, conversely, an attributed symbol may correspond to several characteristic patterns in an image. In the case illustrated in Figure 11.3, for example, pixels belonging to a nucleus also belong to a cell, due to the fact that a nucleus nu is part of a cell.
In a similar way as happens in Figure 11.4, a description is represented on the screen both by a facsimile, iconically and through a polygonal approximation of component characteristic patterns.

The relation ![]() is called the interpretation of the image and associates each pixel belonging to a characteristic pattern with a set of attributed symbols. On the other hand,
is called the interpretation of the image and associates each pixel belonging to a characteristic pattern with a set of attributed symbols. On the other hand, ![]() is called the materialization of the description and associates an attributed symbol with a set of characteristic patterns (Chang et al., 1987). The structure of
is called the materialization of the description and associates an attributed symbol with a set of characteristic patterns (Chang et al., 1987). The structure of ![]() becomes more complex whenever an image i in PL is subject to different interpretations. In these cases a same set of pixels is classified as being part of different characteristic patterns. Thus, several descriptions in DL are associated with it and several vss can be defined from i. Analogously, the same description can be materialized into different characteristic patterns. The two phenomena are illustrated in Figures 11.2 and 11.4. For example, in Figure 11.2c the pixels in the segment 2 can be interpreted as a part of tombolo or as a part of the lagoon. In Figure 11.4, on the contrary, the same string describing the overall interpretation of the fish can be materialized in three different ways, namely by labelling each pixel in the original contour with a colour resuming the meaning of the structure to which the pixel belongs; by producing a polygonal approximation of the original contour; or by an iconic representation associating arbitrary shapes with each kind of structure. Multiple interpretation and multiple representations can then be described by defining set-valued functions. However, for our present purposes, we may treat int and mat as functions and take the liberty of overlooking their structures.
becomes more complex whenever an image i in PL is subject to different interpretations. In these cases a same set of pixels is classified as being part of different characteristic patterns. Thus, several descriptions in DL are associated with it and several vss can be defined from i. Analogously, the same description can be materialized into different characteristic patterns. The two phenomena are illustrated in Figures 11.2 and 11.4. For example, in Figure 11.2c the pixels in the segment 2 can be interpreted as a part of tombolo or as a part of the lagoon. In Figure 11.4, on the contrary, the same string describing the overall interpretation of the fish can be materialized in three different ways, namely by labelling each pixel in the original contour with a colour resuming the meaning of the structure to which the pixel belongs; by producing a polygonal approximation of the original contour; or by an iconic representation associating arbitrary shapes with each kind of structure. Multiple interpretation and multiple representations can then be described by defining set-valued functions. However, for our present purposes, we may treat int and mat as functions and take the liberty of overlooking their structures.
Allowing the description d to represent a program P imposes a more rigid form on the two mappings int and mat. Characteristic patterns in the image appearing on the screen are connected by tools implementing int to blocks in the program which drives them and, vice versa, blocks in the program P are connected to characteristic patterns in the image by tools implementing mat. In a typical user-program interaction, a user points and selects a zone of the screen, thus indicating a characteristic pattern – for example, even a button associated with a program block m.
The program P receives the coordinates of the selected pixel, identifies the computational meaning of the message sent by the user – say, to activate the program block m associated with the button – and then checks whether some given conditions hold and, if this is the case, activates m. A result of this computation can be a modification of the image or the creation of a new one.
For example, in Figure 11.1 a histologist is exploiting ABI – the automatic Assistant for Biopsy Interpretation (Mussio et al., 1991a) – to interactively interpret the digitized biopsy BIOPSY 10. The pictorial string on the screen materializes the present state of the interpretation – as it is recorded by ABI. Two windows are presented to the histologist. The first (IMAGE BIOPSY 10) materializes a gray-level image together with a set of tools which help its reading. The second (STRUCTURE TYPE LIST) materializes the list of the names of characteristic pattern types, known to ABI. Note that the strings of characters on the screen are built as sets of pixels, i.e. as structures.
From the histologist’s point of view, the interpretation is a two-step activity. First, s/he has to select the type of patterns s/he intends to look for. To this end, s/he points a name in the STRUCTURE TYPE LIST by a first mouse gesture. Then s/he has to identify the patterns of this type present in the image. For each pattern, s/he steers the mouse with a continuous gesture to draw the pattern closed boundary on IMAGE: BIOPSY 10. ABI, on its side, is a logbook, a set of visual sentences called pages. Each page description is a program P. Its int captures the pixels selected by each user gesture. P interprets the pixels according to its present state (i.e. the knowledge of the actions performed in the past and of the obtained results).
In the first interaction the message from the user to ABI is a single event, deriving from a single click on the mouse. P interprets this event to derive the type of the structures which will be selected next, the rules for their storage and representation and the line pattern for marking its instances on the biopsy image. In the second interaction, the message is a set of events identifying the pattern to be marked on the image. P interprets it deriving the coordinates of the pixels in the pattern contours and processing these data according to the current rules. The tools implementing mat materialize them as shown in Figure 11.1.
11.3.2 Image analysis, synthesis and visual reasoning revisited
The role of a vs and its components along a computation varies depending on the systems’ current state, goals and available tools.
Image analysis:
in a given context, a visual sentence vs is deduced from a given image i by a pattern recognition activity. The characteristic patterns present in the image are detected and described; the vs is completed by adding the definition of int and mat.
Image synthesis:
in a given context, a visual sentence vs is deduced from a given description d by a synthesis activity and its pictorial part is materialized via both the synthesis and materialization rules holding for that context. The characteristic patterns are materialized depicting their meaning; firstly a bidimensional string is derived from d by applying synthesis rules and then mat materializes it on a suitable medium, e.g. a screen.
11.4 VISUAL LANGUAGES
We are now in the position to formalize the intuitive notion of visual language. We are here interested not only in highlighting the mathematical structure of the VL, but also in specifying the different image and description domains which are necessary to design programs for visual computing. Last, we are interested in allowing users to specify VLs tailored to their interests; hence we shall examine the problem of the definition of VLs from the three different points of view. Through these three characterizations, visual languages can be regarded as a generalization of 1D languages (Salomaa, 1973). From the first point of view, we attempt to capture the formal structure of a visual language as a (possibly infinite) set of interpreted bidimensional strings.
Definition 12a
A visual language VL is a set of visual sentences:
For example, interacting with ABI a biologist uses a visual language constituted by all the arrangements of windows, buttons and string of texts which can be interpreted as the page of a logbook in the biomedical domain. Figure 11.1 displays the image part of one of these visual sentences while Figure 11.3 shows the four components of a sub-sentence of Figure 11.1. Unfortunately, this definition neither can be considered as an operational one, nor does it clarify the complex relations among images and descriptions.
As a second point of view, we therefore adopt the VL designer one. The designers need to define programs that: a) analyse a given image to obtain an interpretation; b) synthesize an image from a given description; c) assess images exploiting the relations among a given image and a given description and d) use visual sentences in user-program dialogue. Hence, they are interested in a definition identifying the set of images and descriptions which are the objects and the targets of the image analyser and synthesizer, as well as the set of functions relating characteristic patterns in the images and substrings in the descriptions. It was pointed out that the 2D strings (images) of a visual language constitute a pictorial language PL and that the set of meaningful descriptions in the current operational context form a description language DL. A third component (RE) must be specified: a set of the pairs of functions ![]()
The following definition summarizes the latter considerations:
Definition 12b
A visual language VL is a triple ![]() Each of the three sets can be defined following the technique better suited for the development style adopted by the system designer. This definition also allows a first classification of visual languages, based on the meanings associated with the images, i.e. on the description language DL. If a 2D string i in PL is regarded as the description of an activity to be performed – i.e. the characteristic patterns in i are interpreted as (sub-)programs – then, VL is a Visual Programming Language. If a 2D string i in PL is regarded as the representation of a scene – i.e. the characteristic patterns in i are interpreted as constants, then VL is a Visual Interpretation Language (Figure 11.5).
Each of the three sets can be defined following the technique better suited for the development style adopted by the system designer. This definition also allows a first classification of visual languages, based on the meanings associated with the images, i.e. on the description language DL. If a 2D string i in PL is regarded as the description of an activity to be performed – i.e. the characteristic patterns in i are interpreted as (sub-)programs – then, VL is a Visual Programming Language. If a 2D string i in PL is regarded as the representation of a scene – i.e. the characteristic patterns in i are interpreted as constants, then VL is a Visual Interpretation Language (Figure 11.5).

The third point of view we introduce is that of the users. For them it is useful to reason in terms of elementary visual sentences which can be composed to form complex ones.
For example, in Figure 11.1, a histologist reasons in terms of cells which are arranged to form a liver tissue. Hence, from the point of view of the users a visual language is defined by:
1) A Visual Lexicon VX, a finite set of elementary visual sentences, i.e. a set of elementary images and associated computational meanings. For example, Figure 11.6 shows the lexicon of a visual programming language for the simulation of liver cell populations (Mussio et al., 1991b). In this case the elementary images are the icons shown in Figure 11.6, the computational meaning of each icon being an object.

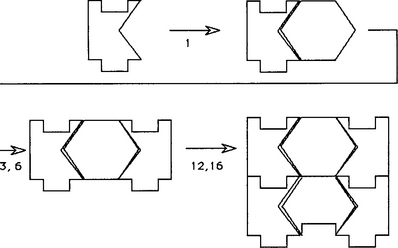
2) A finite set R of visual composition rules, which state how to compose elements of the lexicon into complex visual sentences. Each rule is expressed by a syntactic part and by a semantic one. The syntactic part specifies how to compose the pictorial sentences of the lexicon into the pictorial part of a new visual sentence; the semantic part how to derive the meaning of the new visual sentence from the meanings of the component images. Figure 11.7 shows the syntactic and semantic parts of a rule used to define the liver simulation language. Figure 11.8 shows the syntactic parts of all the rules for that language. 3) The set of admissible visual sentences the users can reach by applying the rules. This set is called the set of axioms (AX). In the case of the liver simulation language, from the point of view of the users, the set of axioms is the set of rectangular configurations obtained fitting together elementary images, i.e. images which correspond to a correct puzzle as that shown in Figure 11.9. Due to the definition of the semantic part of the rules, these configurations correspond to executable programs.
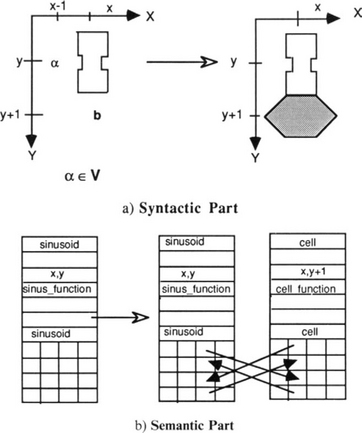
Figure 11.7 a) Syntactic and b) semantic parts of a visual rule. The rules implicitly define the relations between graphical elements in the syntactic part and elements in the descriptions, establishing the links and the values assumed by some object variables.
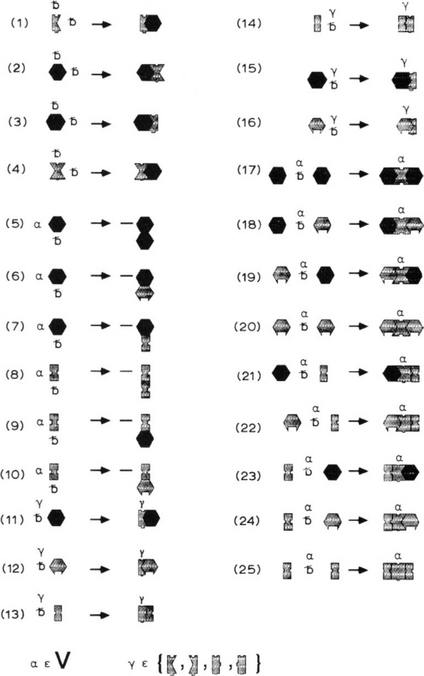
Figure 11.8 The syntactic rules of a visual language for the simulation of cell populations [reproduced from Mussio et al. (1991b). Reprinted with permission from Academic Press Ltd].
The definition of int and mat results from the definition of VX and R. In this way a) the shape and topology of the resulting structures appearing on the screen are made explicit by the syntactic part of the rules (Figure 11.7a); b) the evaluation of the semantic part of the rules establishes the geometrical properties of the structures as well as the links between the programs implementing int and mat and the objects in the description (Figure 11.7b).
Thirdly, a definition of visual language oriented towards the user is:
Definition 12c
A visual language VL is the set of vss generated (recognized) by the system ![]() where VX is a finite lexicon, R a set of visual composition rules and AX a set of visual sentences on VX.
where VX is a finite lexicon, R a set of visual composition rules and AX a set of visual sentences on VX.
Note that in the case of liver simulations, the set of axioms correspond to the set of executable programs which can be represented as correct puzzles; from the point of view of formal languages our definition allows the solution of the membership problem through the construction of an interactive, incremental compiler for the cell simulation language. However, the latter definition is quite general: axioms can be defined to be the initial (final) state of a generative (recognizing) procedure.
11.5 A WALK THROUGH EXISTING SYSTEMS BASED ON VISUAL LANGUAGES
We explore the evolution of the visual language paradigm by reviewing five systems (VIVA, Khoros, LabVIEW, Smart Images, Image Interpretation Management Systems) which are devoted or can be used for image interpretation tasks. The five systems represent different phases in the evolution of the concept of visual language, even if their design and development occurred within the same time span. Note that the term ‘visual language’ is here used as defined in previous sections and not with the meanings that the different quoted authors associate with it.
The descriptions of these systems focus on different issues concerning user program interaction, visual programming and communication. Often, two different system presentations focus on rather different issues and even when they focus on a same issue, they reflect different design choices. Hence we try to standardize the different descriptions by assuming the following dimensions.
1) Parameters which influence the visual language design:
2) Parameters which define the visual language:
3) Parameters which influence the user-program communication power:
The terms in (e) and (f) are used with the usual meaning in computer science. Adaptability is the capability of redefining or extending lexicon, syntax and semantics. Liveness (Tanimoto, 1990) is the level of live feedback the vs presents to its users. Tanimoto identifies four levels of liveness:
1) ‘informative’ level: a vs is a non-executable, passive visual document;
2) ‘informative and significant’ level: a vs is an executable visual document (e.g. the executable specification of a program);
3) ‘edit-triggers updates’ level: any edit operation performed by the user on the vs triggers a computation by the system;
4) ‘stream-driven updates’ level: the system continually updates the vs to show the generally time-varying results of processing streams of data according to the program as currently laid out.
Reactivity
(Chang et al., 1992) is the ability of the visual program to react to environmental changes or to the user.
VIVA
Visualization of Vision Algorithms (VIVA) (Tanimoto, 1990) provides a first frame for visual interactive image processing, underlining the importance of the feedback of the system toward the user. VIVA is an extended data-flow visual language for image processing. VIVA both provides a learning tool for students of image processing, and achieves a software foundation that can serve as a research platform for work on user-program interaction, parallel algorithm design, automatic or semi-automatic programming, attractive presentation medium for image processing and computer vision algorithms. Programs are defined following the metaphor of electronic circuits: components are connected by directional wires which determine the data flow (Figure 11.10).
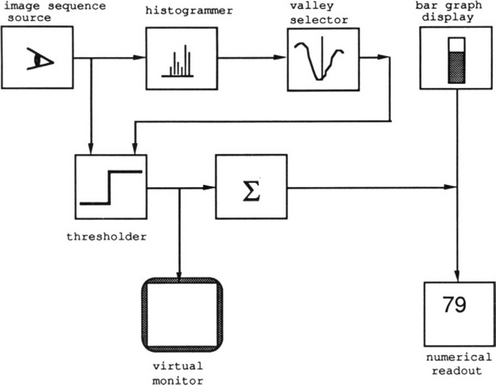
The lexicon is constituted by two types of elements: nodes in the form of icons and one-directional wires in the form of arrows. Four types of nodes exist: sources (input programs), operators (image processing programs), monitors (output programs), control panels (I/O operators to be attached to programs to facilitate interactive checks). Each icon denotes a program. The syntax is not explicitly stated; wires and nodes are always active and carry their information simultaneously, ready to respond to triggers and to display the results of actions.
A program is a vs, built-in a 2D programming space by arranging the processing components and their interconnections. Procedural abstraction is provided by allowing the definition of icons denoting subprograms (Figure 11.10). Separate menu spaces are reserved for menu components and/or subprograms. A third type of space may be used by individual components to provide for special interaction with the user.
VIVA is designed to exhibit liveness at all four levels. The capability of redefining or extending lexicon, syntax and semantics is not mentioned. VIVA does not present reactive characteristics.
Khoros–Cantata
Khoros (Rasure and Williams, 1991) is designed stressing the integration of different tools in image processing together with the interface.
Khoros is a comprehensive system which relies on existing standards (X-Window and UNIX) to allow non-professional programmers to tailor it into high level interfaces to domain specific operators. A resulting Khoros application consists of domain-specific processing routines which are accessed by an automatically-generated user interface. The Khoros infrastructure consists of several layers of interacting subsystems whose organization is inspired to the metaphor of a chorus, ‘any speech, song or other utterance made in concert by many people’. Khoros is based on Cantata, a general purpose visual multistyle data-flow programming language. The styles employed are flow-graphs, forms with various buttons and sliders, and textual programming.
A Cantata program is a data-flow graph, constructed from a user definable lexicon composed of: glyphs (operator or function), direct arcs (a path over which data tokens flow) and forms (interfaces between the visual data-flow graph and the textual nodes) (Figure 11.11). The descriptions of the lexicon elements are conventional programs. A textual label in the image part of a glyph identifies the associated description, arrow buttons identify the inputs and outputs, and icon buttons (e.g. Run, Reset buttons) are used to drive the execution mode (Figure 11.12).
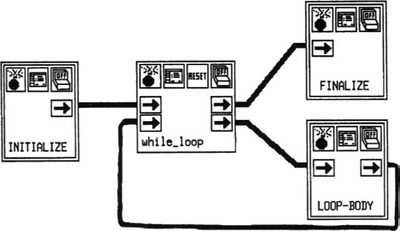

Figure 11.12 CANTATA: a noise cleaning visual program [reproduced from Rasure and Williams (1991), with kind permission from Academic Press Ltd].
A program is built by arranging the processing elements and their interconnection. Procedural abstraction is allowed: a subgraph can be associated with a glyph and substituted by it in the main graph.
Cantata is an interpretative language: the user can stop the execution, modify parameters or connections and continue the execution or SAVE the entire workspace, including the data flow graph and intermediate results. It supports both data-driven and demand-driven execution approaches. It also supports single step execution, parallel execution and responsive modes. Khoros exhibits a) high user-driven adaptability; b) the fourth degree of liveness through animation of the glyphs; a programmable level of reactivity allowing automatic triggering of re-execution of the flow-graph. Originally based on a software environment created for research in image processing, Khoros is currently being used as a research and development tool to solve a variety of problems at numerous sites through the world. It is available at no cost via anonymous ftp at chama.unm.edu.
LabVIEW
LabVIEW (National Instruments, 1992) is a commercial product, embodying some of the features of the first two systems, and including the capability of interacting with data acquisition and actuation tools. It is a graphical programming system for data acquisition and control, data analysis and data presentation. LabVIEW offers an object-oriented programming methodology in which the user graphically assembles software modules called Virtual Instruments (VIs). The exploited metaphor is the control panel of the VIs.
The lexicon has two types of elements: components of a Front Panel (user interface) and block diagram components to build the VI source code.
The elementary vss in a block diagram of a front panel are icons that can be also defined by the user exploiting an icon editor.
The elementary vss in a block diagram are: I/O components (routines to acquire or present data), computational components (routines to process data) and icon/connector components (to connect the input/output of VIs to front panels), lines to connect the different components (directing the flow of data). The data types (which will flow along the lines) are visually presented by the line thickness and/or color. Each type of component of a block diagram shows a different characteristic pattern. For example, the characteristic pattern of a logical operator is a rectangle with a label identifying the operator. The characteristic patterns associated with the control constructs are graphical structures surrounding the icons to be controlled (Figure 11.13).

Figure 11.13 LabVIEW: a control panel [reproduced from National Instruments (1992), with kind permission from National Instruments].
A block diagram is built by placing components on the panel and connecting the nodes of a block diagram by clicking on the output bottom of an icon and on the input button of another icon. As a response, LabVIEW connects the two points by a line. During the construction of a program, type checking is performed. If the input to an operator is not of the appropriate type, a warning is sent to the user.
Control structures are iterative loops, conditional loops and case statements for sequential, repetitive or branching operations.
The presence of modularity in LabVIEW allows procedural abstraction: a set of VIs can be associated with an icon and used in the block diagrams of other VIs. The single VIs can be tested alone.
LabVIEW is based on a data-flow paradigm, thus being able to simultaneously execute independent data paths and VIs. The underlying visual language is of an interpretative nature, but can also be compiled so as to obtain an optimized code.
An icon editor is available to the user to complete and refine the lexicon. Icons so defined can be used to build front panels or to associate to a subgraph. LabVIEW presents the second level of liveness, i.e. ‘informative and significant’ in that the block diagram specifies the computation and can be executed, but it does not present any reactive characteristics.
Smart image information system
Back to academic prototypes, within the biomedical domain the Smart Image Information Systems (SIIS) (Chang et al., 1992) uses images not only as the objects to analyse but as a support to anticipate the user needs by accomplishing operations in advance without explicit requests. The SIIS exploits the data flow and rule-based paradigms to link an image to a knowledge structure.
The SIIS proposal is based on the metaphor of the ‘smart house’, where the house will automatically turn on lights, turn off the air conditioning system, switch the TV to monitor the entry door, and so on, according to environmental conditions and its design rules. In general, a smart house knows when to apply operations without an explicit request from the residents. Similarly a SIIS automatically responds to environmental changes by browsing, retrieving and pre-fetching or storing images. These reactions are guided by the knowledge structure S associated with an image I. The couple (I, S) image-knowledge structure is called ‘smart image’. S determines the representation on the screen of data sets other than I in the form of graphs, sketches and different images.
This data structure can be profitably described as a vs composed of four types of visual sub-sentences: raw image, hot spot, protocol, and attributes; int and mat of these sentences are not made explicit in the definition of SIIS (Figure 11.14).

Figure 11.14 SMART IMAGE: overall structure [reproduced from Chang et al. (1992), with kind permission from Academic Press Ltd].
Raw images are vss whose characteristic pattern is an image and whose descriptions are the programs for its management.
A hot spot is a vs, of which the characteristic pattern ss is a rectangular area superimposed on a raw image. A hot spot description is a couple (p, a); p is a predicate that expresses a condition to be satisfied to trigger the action a, i.e. a sequence of activities. A hot spot is activated when an event associated with ss occurs, such as selection by the user or by a running program. Hot spot descriptions are organized as active indexes. An active index is a network of active cells. Each cell implements a decision rule, based on a variable number of inputs. Active indexes realize the system’s responses to environmental changes.
A protocol codes and mimics the expected user’s actions with/on the image. A protocol is derived by a visual lexicon of two types of elementary vss: nodes and arcs. The characteristic pattern of a node is a rectangle having a string inside. Each node corresponds to a user’s operation that causes environmental changes, and its description points to active index structures and/or hot spots. The rectangle background can be in one of two colors, signalling if the hot spot is active or not. Arcs are represented by arrows and determine the data flow. Hence the image part of a protocol results into a flowchart of named rectangles linked by arrows. The protocol description is specified by a tuple (protocol name, decision-graph, protocol-state). The protocol name is the unique identifier of a specific protocol, the decision graph describes the strategy of image usage in a certain application and the protocol state is the current state in this strategy.
Attributes are domain-related information and traditional image information (e.g. patient name, image size, …) visualized as formatted text. The user can exploit editors to define and update a smart image with respect to each of its components. Moreover, a smart image incrementally increases its intelligence by updating its knowledge structure to include more information on the image usage. To allow this, the lexicon of the SIIS visual language is enriched by hot spot buttons (to associate a hot spot description to a hot spot image), hot spot definition buttons (to define new hot spot types) and command buttons (associated with operations such as quit and voice recording).
The syntax of the visual language is not mentioned.
SIIS presents the ‘informative and significant’ second level of liveness: hot spots describe the computation to be performed. Moreover, it is adaptable in that the user can define new hotspots.
In conclusion, SIIS is: a) proactive, in that environmental changes caused by environment actions may automatically trigger further actions; b) reactive, in that environmental changes caused by users’ interaction with images can trigger some actions; c) reflective, in that actions activated by conditions on hot spots can change features on these hot spots.
Image Interpretation Management System
The Image Interpretation Management System (IIMS) (Bottoni et al., 1993) is an instance of the Cooperative Visual Environment (CVE) (Bianchi et al., 1993) focused on image interpretation.
A CVE operates with its users in performing some situated activity exploiting the metaphor of their real working environment. It can also be instrumented to a specific task by the virtual tools users foresee as useful, as happens in real working environments. A user interface development environment embedded in the CVE permits the users to evolve its organization, the interaction mode and the tools as soon as they gain deeper insight on their activity. A CVE is proactive, in that environmental changes caused by program actions may automatically trigger more actions: for example the loading of an image can cause the computation of its histogram and the derivation of a segmented image. It is also reactive in that environmental changes caused by users’ interaction with images can trigger some actions: for example zooming an image can cause to zoom another image logically related to the first one. It also exhibits liveness at all four levels: a CVE is continually active and its users can, at a certain state of a program execution, modify it and resume its execution from that state.
The IIMS inherits this structure and lets its users directly customize the image interpretation virtual system to their real working environment. For example, customization of the system is obtained by extending traditional notations used by physicians for biopsy interpretation and documentation.
Two different visual languages have been defined, the Documentation Language (DL) and the Image Interpretation Language (IIL). Their visual sentences are shuffled to form the actual IIMS ones, as shown for example in Figure 11.1.
Both DL and IIL are formally defined following Definition 12c: this definition is used in the case of the documentation language to develop an incremental compiler which manages the interaction. In the case of the interpretation language, it is exploited to incrementally interpret the images of a given class. DL sentences are built following the metaphor of the logbook that physicians use in real working environments to log their clinical activity. The result is a computerized logbook (c-logbook) organized, as a traditional one, in pages (c-pages); these pages are in turn displayed on the screen one at a time inside a fixed frame: the c-cover. Note that c-cover, c-page, c-logbook are vss whose image parts are close to the characteristic patterns of medical documentation (Mussio et al., 1992).
The IIL lexicon elements (nuclei and other anatomical structures) are the characteristic patterns by which a physician describes a biopsy interpretation and the IIL composition rules derive from those followed empirically in human interpretation. However, the vss in the two visual languages play different roles in the interaction: c-logbooks are implemented to reason on images. The c-logbook definition is mainly used to generate surface images and to control the user-program interaction. The IIL definition is used to (semi)-automatically interpret an image, create a vs from the original image and the obtained description and drive the vs interaction with the users (Bianchi et al., 1991; Bottoni et al., 1993; Bottoni et al., 1995).
An academic prototype of the IIMS has been implemented and customized for several medical applications (Bianchi et al., 1991; Bottoni et al., 1993).
11.6 CONCLUSIONS
A unified language for the definition of image processing, interpretation, reasoning and synthesis, based on the novel concept of visual sentence is offered as a proposal for discussion. The significance of this unified language is twofold. First, it helps to avoid ambiguity in discussing on activities involving images as often happens in the literature. Second, it allows a uniform formal specification of all the activities occurring when interacting through the screen and hence it may become a tool for the comprehensive description of all visual computing activities.
A visual sentence relates an image and its characteristic patterns to their descriptions by making explicit the relations which map characteristic patterns into procedures and vice versa. The set of characteristic patterns, as well as the set of descriptions, are defined as formal languages.
This formal approach allows the capture of the dynamical aspects of reasoning with/on images. An image describes a program: the evolution of the computation is reflected along the image transformation. At a given instant, the image can completely and unambiguously describe the state of the computation. It also allows the exploitation of ambiguities, arising in image interpretation, to better grasp all the possible image meanings – which seems to be a common procedure within scientific activities. In the latter cases, a single image may be concurrently described from different sets of characteristic patterns. The different descriptions can thereafter be managed to reason – possibly automatically – on the image significance.
These advantages for reasoning on and with images have been illustrated examining different examples.
Brancheau, J.C., Brown, C.V. The management of end-user computing: status and direction. ACM Comp. Surveys. 1993;25:437–482.
Bianchi, N., Bottoni, P., Cigada, M., De Giuli, A., Mussio, P., Sessa, F. Interpretation strategies in a cardiologist-controllable automatic assistant for ECG description. Proc. IEEE Comp. in Card. 1991:673–676.
Bianchi, N., Bottoni, P., Mussio, P., Protti, M. Cooperative visual environments for the design of effective visual systems. Journal of Visual Languages and Computing. 1993;4:357–382.
Bottoni, P., Cugini, U., Mussio, P., Papetti, C., Protti, M. A system for form feature based interpretation of technical drawings. Machine Vision and Applications. 1995;8:326–335.
Bottoni, P., Mussio, P., Protti, M. Metareasoning in the determination of image interpretation strategies. Pattern Recognition Letters. 1993;15:177–190.
Cugini, U., Falcidieno, B., Mussio, P., Protti, M., Towards automatic indexing of product models in CIM environments. Proc. 6th Int. Workshop on Languages for Automation. 1988:106–114.
Chang, S.-K. Introduction: visual languages and iconic languages. In: Chang S-K., Ichikawa T., Ligomenides T., eds. Visual languages. New York: Plenum Press; 1986:1–7.
Chang, S.K. Toward a theory of active index. J. of Visual Languages and Computing. 1995;6:101–118.
Chang, S-K., Hou, T.Y., Hsu, A. Smart image design for large data-bases. J. of Visual Languages and Computing. 1992;3:323–342.
Chang, S-I., Tortora, G., Yu, B., Guercio, A. Icon purity—towards a formal decision of icon. Int. Jour. of Pattern Recognition and Artificial Intelligence. 1987;1:377–392.
Fu, K.S., Tsai, W.H. Attributed grammars: a tool for combining syntactic and statistical approaches to pattern recognition. IEEE Trans. on Syst., Man and Cybernetics. 1980;SMC-10:873–885.
Golin, E.J. Parsing visual languages with picture layout grammars. J. of Visual Languages and Computing. 1991;2:371–394.
Haralick, R.M., Shapiro, L.G. Glossary of computer vision terms. Pattern Recognition. 1991;24:69–93.
Knuth, D. Semantics of context-free languages. J. Math Syst. Theory. 1968;2:127–145.
Kobsa A., Walster W., eds. User models in dialog systems. Berlin, Germany: Springer-Verlag, 1989.
Mussio, P., Finadri, M., Gentini, P., Colombo, F. A bootstrap approach to visual user interface design and development. The Visual Computer. 1992;8:75–93.
Mussio, P., Pietrogrande, M., Bottoni, P., Dell’Oca, M., Arosio, E., Sartirana, E., Finanzon, M.R., Dioguardi, N., Automatic cell count in digital images of liver tissue sections. Proc. 4th IEEE Symp. on Computer-Based Medical Systems. 1991:153–160.
Mussio, P., Pietrogrande, M., Protti, M. Simulation of hepatological models: a study in visual interactive exploration of scientific problems. J. of Visual Languages and Computing. 1991;2:75–95.
Narashiman, R. On the description, generation and recognition of classes of pictures. In: Grasselli A., ed. Automatic interpretation and classification of images. London, UK: Academic Press; 1969:1–42.
National Instruments Corporate Headquarters. LabVIEW for Windows, demonstration guide. 1992.
Reiter, R., Mackworth, A. A logical framework for depiction and image interpretation. Artificial Intelligence. 1989/90;41:125–156.
Rosenfeld, A., Siromoney, R. Picture languages—a survey. Languages of Design. 1993;1:229–245.
Rasure, J.R., Williams, C.S. An integrated data flow visual language and software development environment. J. of Visual Languages and Computing. 1991;2:217–246.
Salomaa, A. Formal languages. New York: Academic Press; 1973.
Shaw, A.C. The formal picture description scheme as a basis for picture processing systems. Information and Control. 1969;14:9–52.
Siegel, J. Non-parametric statistics in social sciences. New York: McGraw-Hill; 1956.
Tanimoto, S.L. VIVA: a visual language for image processing. J. of Visual Languages and Computing. 1990;1:127–140.
Tondl, L. Problems of semantics. Dordrecht, The Netherlands: Reidel; 1981.
Wang, D., Lee, J.R. Visual reasoning: its formal semantics and applications. J. of Visual Languages and Computing. 1993;4:327–356.
Wittenburg, K., Weitzman, L., Talley, J. Unification-based grammars and tabular parsing for graphical languages. J. of Visual Languages and Computing. 1990;2:347–370.