Chapter 9. Measuring Web Content Effectiveness
If you publish a book such as this, you know that you can’t make changes until the next printing, which might not be for six months to a year. So you have to try to write content with a long shelf life. Our goal is to write content that will remain relevant and current until the next printing. Small fluctuations in the field, such as which social media sites are hot right now, must be left to other content efforts, preferably on the Web, where daily changes can be made. Also, we have made every effort to write for our target audience—writers, editors, and content strategists—in this book. We expect to get reader feedback that tells us how well we did in that task and where we have room for improvement. But we can’t make those improvements until the next printing. Again, our Web site—www.writingfordigital.com—will have to serve as a proxy for those adjustments until the next printing.
Indeed, one of the great advantages of Web publishing over print is the ability to improve content experiences as often as you want. This is not just about whether something is accurate, clean, or clear. It’s about what is relevant. If you find that your audience is behaving unexpectedly on your site, you can change the content or design to better adapt to audience behavior. In this way, you make your site more effective for the audience that finds your content relevant. That is a practice we have been preaching throughout this book.
But how do you measure user behavior? There are many tools to help you do this. Every team needs a tool box of Web analytics tools—such as Unica NetInsight. Which set of tools you choose depends on your environment. Tool recommendations are beyond the scope of this chapter. What we want to do is explain the data you can gather with the various analytics tools and how to interpret it and use it to improve your content.
How do you interpret users’ behavior in ways that help you improve your Web experiences for them? That is the subject of this chapter. In the typical environment, content strategists, writers, and editors don’t need to conduct Web analytics. That’s left to specialists. Rather than delving into how to gather the data (something best left to a book just about Web analytics), we want to help our target audience understand the range of possibilities, so that they can work with Web analytics specialists to pull, analyze, and interpret the data. In your roles as content strategists, writers, and editors, you will need to work with Web analytics people to request reports and optimize dashboards. Knowing what data to request and how to use it to improve your content is the focus of this chapter.
Tools like Unica NetInsight can help you gather a wide array of data; listing all of it here is counterproductive. Instead, we’ll start with the information that is most helpful for understanding Web content effectiveness. This will act as a filter that you can use to determine the right mix of analysis to request. Armed with the right analysis, you can better understand how users are interacting with your content and make improvements accordingly. Because this book defines Web content effectiveness in terms of the degree to which your content is relevant to the target audience, we will focus on measurements that can help you create more relevant content for your audience.
Note
Web analytics is a mixture of objective and subjective judgments. Tools can help you understand raw data, but how you interpret that data is often up to you. In particular, you must define for yourself the criteria that you use for relevance. For example, you might say that your goal for relevance for your audience is fifty percent engagement, meaning that half of the users who come to your page will engage with it. Depending on the purpose of your page, that goal can be quite reasonable. But for some contexts, it is not.
Suppose that you define engagement for your blog as having users make lots of comments on your posts. It is highly unusual to get fifty percent of your blog readers to comment—two percent is a good goal there. If you still want to demonstrate that half your visitors find your blog relevant (a very attainable goal) you will have to measure relevance more broadly, say by measuring time on a page, repeat visits, or RSS subscriptions. But this data doesn’t mean anything unless you put an interpretive framework around it. How you do that is up to you. We will merely suggest helpful interpretive frameworks to use in your work with Web analytics professionals.
Measuring Engagement, Inferring Relevance
We will start by discussing how to measure user behavior in ways that give us insights into content relevance. Aside from asking your users if they find your content relevant (as we do in some pages in ibm.com), assessing relevance is a matter of measuring user engagement with your content and inferring relevance from those measurements.
A quick refresher on relevance is in order (see Chapter 3 for a more thorough discussion). Again, there is no direct measurement of relevance. It must be measured by inference, in both online and offline contexts, such as print.
For example, we infer the relevance of single-word utterances such as “pizza?” based on facts about the context external to the actual language—such as time, place, and who is speaking. Suppose this is said by a colleague with whom you eat lunch every day at different restaurants. And suppose he says it at 11:45 a.m. while standing in your office door. The context is so thoroughly determined that you can clearly infer its relevance: He wants you to join him for lunch at the pizza place. But the same utterance, coming at random from a stranger on a crowded street, is gibberish. In other words, lacking contextual cues from which to infer relevance, you deem the stranger’s utterance to be totally irrelevant. Of course, there is a range of cases between these two that display some degree of relevance. (We leave it to the reader to think of examples.)
Assessing relevance in everyday life is part and parcel of learning language. But on the Web, it is not second nature. On the Web, we learn to focus on certain cues to determine the relevance of content. According to Nielsen (2008) and others, most Web users are savvy enough to do this within a few seconds. If they determine that a page is irrelevant, they will leave it within a few seconds. If they determine that it’s at least marginally relevant, they will spend more time on it and perhaps engage more deeply with it by clicking calls to action.
The more a user engages with a page, the more relevant he or she finds it. That is the primary assumption with which we infer relevance by measuring user engagement. A user engages with a page if she clicks a link on it.
Here are some ways you can measure your users’ engagement and infer relevance from it.
• Traffic. Most discussions about Web analytics start with traffic data, typically defined in one of three ways:
1. Page views—the number of times a page was viewed in a given time period.
2. Visits, also known as sessions—the number of times your site was visited in a given period. This count includes multiple visits from the same user, who perhaps viewed multiple pages on your site.
3. Unique visits—the number of individual users who came to your site in that time period.
Page views are valuable because they can help you understand which pages in your site are hit more often. The other two main statistics are about visits to your site. Some combination of knowledge about visits and page views is necessary if you want to get a sense of the relative relevance of your pages to your overall site.
Of the three, the unique visits stat is often considered the most valuable because it excludes users who keep coming back. However, some people like to measure repeat visitors, because that stat shows that your site has very high value for those users. If you get a lot of repeat visitors, you know the site’s content is relevant for them. The number of repeat visitors also demonstrates visitor loyalty.
The other stat some people use is new visitors—the number of visitors who have never visited your site before. This is not particularly helpful in measuring relevance. You can get a lot of new visitors who leave and never come back, which is an indication that those users find your content irrelevant.
Raw traffic data is not a good measure of relevance, in general, because it is possible that lots of people will land on your page and find it irrelevant and go away. Every time you force a user to use the Back button, you leave a negative impression on that user. The goal of Web content is not just to get a high volume of traffic, but to get targeted traffic. In short, you want to attract your target audience with relevant content.
• Bounce rate. The percentage of users who leave your site in a few seconds without clicking anything. This is defined in different ways, but the typical added assumption is that a “bounce” is not defined by failing to click a desired link right away. It’s typically defined as clicking the Back button within a few seconds.
Bounce rate is important because it measures the percentage of users who find your content irrelevant almost immediately. A high bounce rate indicates that you are getting traffic to your page that is not part of your target audience. Knowing a page’s bounce rate can’t help you diagnose the problem. But a high bounce rate is the first warning sign that the users coming to your page are not in your target audience.
Most tools that measure traffic can measure clicks: Where are people clicking when they get to your page? They can also measure the time users spend on a page. Nearly all of the tools we will mention in this chapter allow you to infer bounce rate, based on those two variables: You tell the tool what constitutes clicks off the page, and it will give you the statistics you need, such as the number of times that a user clicked off within the page without doing anything within three to six seconds (again, you set that threshold).
What constitutes a high bounce rate is a matter of some debate. On advertising landing pages, the industry standard is to expect an 80 percent bounce rate. With paid search, we’ve all heard the 80/20 rule touted. That is, some partners have often said that we should be happy if only 80 percent of our external paid search referrals end in a bounce. But we want to change those expectations somewhat. If your paid and organic keywords for a page are all in the same cloud, you should expect much better results than the 80/20 rule. On your organic efforts, we encourage you to see anything more than a 50 percent bounce rate as unacceptable.
Bounce rate by itself cannot help you understand how to make your pages more effective. When you encounter a high bounce rate, you will need to look at other data to analyze why you are attracting traffic outside of your target audience.
• Referral data. If users don’t just type your URL into their browsers, you can assume that they clicked a link to get to your page. These links are divided into internal and external referrals. We will cover internal referrals in a later section.
External referrals are very valuable because they indicate which owners of other sites find your content relevant. Most tools can gather the referring URL and other data about where visitors came from to get to your pages.
For our purposes, the most important external referrals are search referrals, when users land on your page by clicking on a search engine result. Not only are search referrals typically your highest volume of external referrals, but they can give you other information about what keywords are driving traffic to your pages.
The first place to look for analysis of why your bounce rate is high is search referral data. If you are getting a lot of traffic from Google and other search engines, but users then bounce off your page, you know that your keyword choice is problematic. Knowing how to fix it might require more referral data, along with doing additional keyword research (as described in Chapter 5).
Other external referral data is valuable because it shows which sites link to yours. If you analyze the content on these sites—such as audience, purpose, keyword data, and links—you can get a good sense of the make-up of other sites and know what your users also find relevant to them. Non-search external referrals are also an excellent source of potential link partners. If a site links to your pages and has a lot of other links on it, you can look into the other pages that it links to as being potentially relevant to your site.
• Keyword data. The most valuable data that tells you how to fix keyword problems comes from your keyword reports. Most analytics tools allow you to see not only the number of search referrals to a page, but which keywords users queried to get there. If a lot of users are coming to your page from queries containing variants of your keyword, and these same users have high bounce rates, you can use that information to zero in on the semantics of your keywords. Perhaps a particular keyword has a popular synonym. For example, if your keyword is SOA and you get a high bounce rate, it might mean that a lot of people from the Society of Actuaries clicked through to your page. So changing your keyword phrase to Service Oriented Architecture would lower your bounce rate.
Sometimes finding out what keywords result in engagement is valuable. Not all your referrals will be from users who type a keyword that is in your page’s title tag. If you find that you’re getting a high bounce rate from users referred by your primary keyword, but that users referred from secondary keywords are engaging with your page, that tells you something: The content on your page does not match the keywords for which it was optimized very well.
• Page audits. Another reason users outside of your target audience might click your page when it appears in search listings is the short description. Google and other search engines show a two-line description of what users can expect to see when they click the link. If this description doesn’t sufficiently cue readers as to the page’s relevance to their search query, consider changing the two-line description (also known as the description meta tag). To use the same example as above, if your keyword is SOA and your description clearly states that the page is about Service Oriented Architecture rather than the Society of Actuaries, actuaries will be far less likely to click through to your page. Making sure that Google and other search engines display the correct short description is a good way to lower bounce rate (See Figure 9.1).
Figure 9.1. A snippet of a Google Search Engine Results page (SERP) for the keyword “SOA.” The short descriptions are the one and a half lines of black text below the link. Note that the text limit is 150 characters—slightly more than a Twitter post.

However, Google and other search engines can ignore the short description and continue to use an older one in their indexes. For this reason, it’s also a good practice to write an eloquent content summary as the first two lines of your body copy. And make sure that your summary has your targeted keywords in it, preferably more than once.
Tip: Use the description meta tag to indicate what you want search engines to display to users in the SERP. See Chapter 4 for other on-page factors that affect search ranking and the SERP display.
• Engagement rate. The opposite of bounce rate is engagement rate: the percentage of visitors (unique or otherwise) who click the links you want them to click on a page. If a visitor clicks on the links you want them to click on, it indicates that she finds the content relevant. You define what constitutes engagement, and your engagement parameters need not be black and white. Engagement can be defined as a continuum rather than an either/or proposition. Perhaps some links are especially high value: Users who click on those links will be engaging more deeply than those who click a navigation element to another page. The best engagement measurements delineate between types of engagement actions to help you better understand the degree of content relevance for the audience.
Case Study: Relating Engagement to Relevance
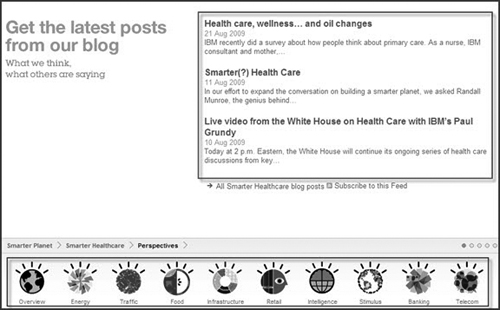
There are many ways of analyzing engagement data. Here is one way we are attempting to do it at IBM. We group the links on our Smarter Planet pages into two categories: calls to action on the topic-related page, and links to related Smarter Planet topics. Our operating assumption is that visitors who click the calls to action that we want them to click (such as to download a white paper, read the latest blog post, or watch a video) find the content on that page highly relevant. Visitors who click the persistent navigation links at the top or bottom of the page find the content on other pages within Smarter Planet relevant, but they won’t necessarily find the content on that page relevant. They may click to go to other topics because they are looking for something other than what’s on that page.
Figure 9.2 shows the types of links that we put on the Smart Planet pages.
Figure 9.2. Two kinds of links on the Smarter Planet topic pages. The links in the red box constitute engagement with the topic on the page (Smarter Healthcare). Links in the blue box constitute engagement with the Smarter Planet site, though they are to other Smarter Planet topic pages.
• Time on the page. Not all pages are link-rich. In some cases, engagement can be defined in terms of how much time users spend on a site, typically measured in the average number of seconds or minutes per visit. However, the “time on a site” statistic is not universally respected, for two reasons.
First, some users will come to your site and get distracted by other applications. Or they may get up and do something else away from the computer for awhile. In a typical scenario in the age of modern browsers such as Firefox, a user might open a folder full of bookmarks in tabs and only engage with a few of them. From a metrics perspective, the user was spending all her time on all of the tabs, when in reality she was only viewing one of the tabs at a time. And it’s not uncommon for a user to spend all day on a page and never really engage with it. Because time on a site is measured in terms of the average time spent on a site for all users over a given time frame, this typical user behavior skews the averages for all visits. Most modern analytics programs throw out the outliers when they compile these averages. But not all do.
Second, the other problem with time on a page is that it really only works for text-heavy pages without links. The goal of good page design is to get users to click desired links. If you rely on time on a page to measure effectiveness, you might be masking deeper issues with page design and site architecture. If all a user can do on a page is read, perhaps the best use for the page is to turn it into a PDF and link to it from another page.
• Site overlays. A site overlay is a screen capture that shows the percentage of visitors who clicked links on a given page (see Figure 9.3). Otherwise known as heat maps, these graphical representations of engagement give you at-a-glance views of what links are working and what links are not working on your pages. The assumption is that if a link is not working, users don’t think it is relevant to them. So heat maps might not measure relevance for a page, but they will help you understand relevance for your links.
Figure 9.3. A snippet of an overlay or heat map of a page in ibm.com. Click-through rates are measured on each link on the page and displayed graphically to content owners.

Heat maps can tell you a lot about what needs to be fixed: Link anchor text, link positions, and many other factors influence whether users click links or not. As in the listing in a SERP, the link title and description should give users contextual cues as to what to expect if they click the link. If a link is not getting many clicks, change its anchor text, and take another heat map. If it still isn’t getting clicks, modify the short description and take another heat map. If it still isn’t working, modify the design to make the element more prominent on the page and take another heat map. This trial-and-error process helps you optimize the effectiveness of your links, one by one.
Figure 9.3 shows an example of a heat map.
• Pathing data. Heat maps can tell you what links are popular on a page. Internal referrals can tell you which links visitors have clicked on other pages within your site to get to a specific page. So the two measures give you a sense of link relevance at the page level. But many visitors will click multiple links on a site. These link paths can tell you about link relevance at the site level. The more links a visitor follows, the better your understanding of how users view the relevance of your pages to one another, and the greater the relevance of your site.
Not all metrics packages can capture pathing data. Examples of companies that sell packages that capture pathing data include Unica and Omniture. But it can be some of the most important data to capture, especially if you have a complex site with a lot of interwoven content. Internal linking is key to site effectiveness, and an often-untapped source of link juice for your pages. Pathing data gives you a site-level view of how your links relate to one another from a user’s perspective.
A lot of paths are only followed once. This doesn’t tell you much, because users might follow a given path rather aimlessly. But if a path is followed multiple times, you can infer the relevance of link paths. You might need to look at link path data over a long period of time to get a large enough statistical sample, allowing you to make these inferences.
When you learn what paths are working and what paths are not, you can do all kinds of semantic analysis on the anchor text and the descriptions under the links to help understand why some paths are often followed and others are not. The aim is to induce your visitors to follow the relevant links so that they take your paths through the content. Pathing can also help you analyze how well your site does in guiding visitors to the content you want them to consume.
One caveat: Unlike in print publishing, on the Web, the visitor is in control. So no matter how much you try to funnel visitors through Web experiences, they will take paths of their choosing. You have to let go of control and let them take those paths. If user behavior shows that some paths are unexpectedly popular, that is not necessarily a bad thing. You can learn a lot about how your audience definitions differ from the audience that actually finds your content. And you can adjust to your audience by highlighting the popular paths.
Measuring Audience Semantics and Sentiment
Analyzing your audience is the first and most important step in creating relevant Web experiences. But if it’s so important, why didn’t we start with it in this chapter? Well, because Web audience analysis tools are typically more advanced and less commonplace than tools that can help you understand how relevant your content is to your visitors (whether they are in your target audience or not). We discussed at length how to analyze your audience through keyword research in Chapter 5. But keyword research is limited to short words and phrases. As we showed in Chapter 8, you also need to analyze social media settings to understand your audience’s language preferences. This also requires social media listening tools, also known as sentiment analysis tools. Finally, the Web is not the only medium that your audience interacts with. You can gain insights about these offline media using traditional market intelligence techniques, such as surveys and focus groups.
Latent semantic indexing (LSI) is a statistical technique that identifies patterns in unstructured text (such as blog or Twitter text) and draws semantic conclusions from the patterns. LSI is based on the principle that meaning is contextual. If you can uncover the context by measuring the frequency of word groupings, you can determine the meaning. Unlike conventional keyword searches, LSI tends to do a better job of matching content to search queries, because it takes probable contexts into account.
LSI can be used to study your audience by helping you filter the unstructured text in social media settings by categories. You can use it to develop clouds of related posts or pages, all tagged with the assigned categories. If you look at these tag clouds, you will start to see relationships between the tags and can then base your keyword choices and terminology on the most relevant tags. This can also help you understand the topography of tag synonyms and other semantic relationships between tags.
LSI Insights (http://focustraffic.com/lsi-products/lsi-insights-latent-semantic-indexing-research-226) is a WordPress plug-in that can help you optimize your terminology for your audience. It is also a tool for keyword usage questions, because it is said to mimic the way Google analyses pages semantically.
Sentiment analysis, as it applies to social media, attempts to quantify the attitudes of writers in such social media settings as blogs, forums, Twitter, Facebook, and LinkedIn. It uses deep computational linguistics to determine the polarity of a blog or forum thread—whether it is positive, negative or neutral. You can scope the analysis to a particular blog or a whole network of blogs, forums, and discussion groups.
Sentiment analysis can help augment your semantic analysis of social media settings. Not only can you learn what words and phrases bloggers and others use to describe things, but you can know what the prevailing opinion is on a particular topic. Because your blog or Web site needs to persuade as well as inform, knowing your audience’s disposition relative to key topics can help you craft persuasive arguments for them. Part of your job as a blogger is filling in the white space in the conversation. The easiest way to do this is by disagreeing with a popular opinion. But another way is to acknowledge that several top bloggers in your area have missed an angle that supports the prevailing opinion. Knowing what that prevailing opinion is, and where the gaps are, is crucial to your blogging success.
As we showed in Chapter 3, relevance is often defined in terms of two statements supporting each other in an argument. So, in general, the more persuasive your statements are, the more relevant they will seem to your audience.
We mentioned traditional market intelligence techniques, such as surveys, in Chapter 5, but this information bears repeating here. It is important to have site surveys to get a better sense of your audience. But that will only help you understand the audience that finds your site. The goal is to grow your audience by reaching out to audience members with whom you have not yet connected. Social media is not the only way to do this. It’s also helpful to conduct surveys that help you develop a sense of what other media your audience finds relevant. Perhaps a certain percentage of your audience members list a certain print journal among their regular offline reading. Learning these alternative venues is another way to understand your audience’s expectations and preferences.
Note
It is not likely that regular radio listeners will correlate their activities with Web use. Because users type in things that they see much more often than they type in things that they hear, TV and other visual offline activities are much more likely to correlate with Web use than radio or other oral media. We have found this to be the case at IBM. When we run TV ads, we get strong correlating Web search data on the terms mentioned in the ads. When we run radio ads, we don’t get nearly so much. This is just an extension of the media determinism theory we described in Chapter 2. This is an example of how offline activities can help you understand your online audiences.
The subjects of LSI, sentiment analysis, PostRank, and other social media market intelligence tools could fill entire books by themselves. We just want to give you some food for thought to enable you to work with your Web analytics and market intelligence colleagues and consultants to compile the best tool box for your environment. The more robust your metrics environment, the easier it will be to identify and target your audiences on the Web with rich, relevant content.
Summary
• One of the advantages of Web publishing is being able to make adjustments to content as circumstances change or you learn how well you are engaging with your audience.
• You don’t measure relevance; you can infer it from a combination of measurements, including bounce rate and engagement rate. The assumption is, the more your customers engage with your site, the more relevant your content is to your target audience, and vice versa.
• No one Web analytics tool or suite is adequate to measuring everything you need. You will need Web analytics, content quality, and SEO effectiveness tools.
• A good way to learn more about your audience is to listen to social media conversations. The primary ways of doing this are LSI and sentiment analysis, which both use sophisticated linguistics to mine the unstructured text found in blogs and other social venues.
• LSI can be used to mine these sites for your audience’s semantic preferences. Sentiment analysis can be used to mine these sites for audience attitudes.
• In addition to your online research, it is a good idea to conduct offline research to learn how your audience consumes media outside of the Web, and how that affects their attitudes and semantic preferences on the Web.