Appendix B. Tools That Support the Automated Testing Life Cycle
B.1 Introduction
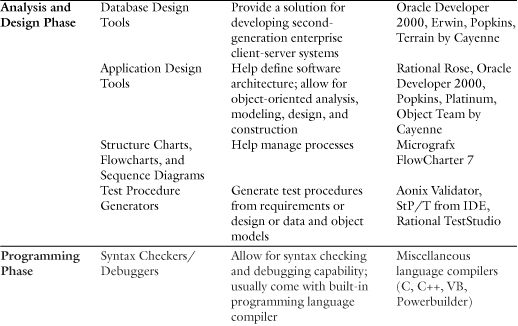
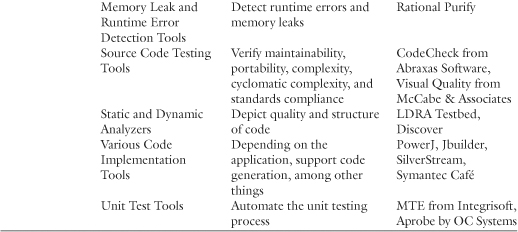
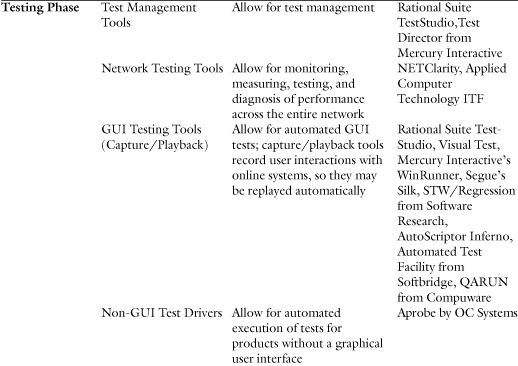
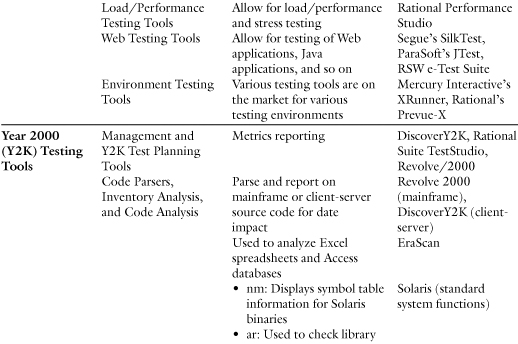
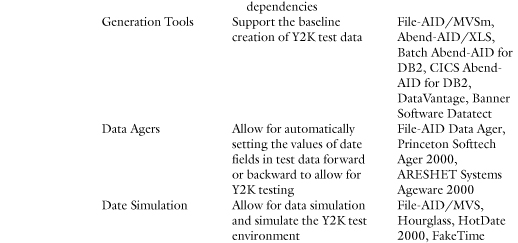
Table B.1 indicates the various types of test tools available for use throughout the various life-cycle phases, supporting the automated testing process. This table provides the names of selected products associated with the various categories listed and is not to be construed as an exhaustive list of available products. Table B.1 lists tools that support the testing life cycle; it does not address development tools and tools supporting the other life-cycle phases, such as database tools, middleware connectivity and gateway tools, GUI builders, RAD development tools, and many others.
Table B.1. Tools for the Testing Life-Cycle Phases
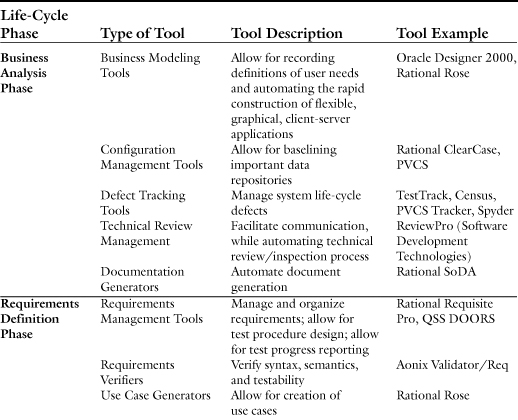
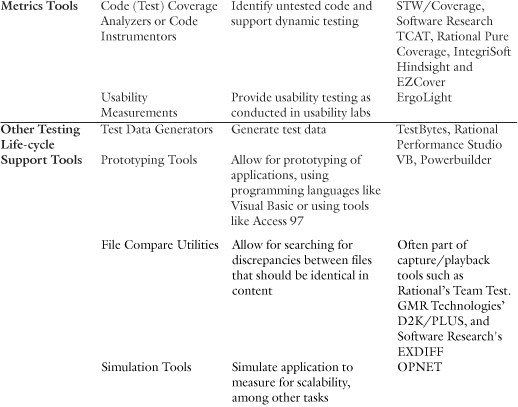
To avoid repetition, each tool is listed only once, even though some tools (such as defect tracking tools, configuration management tools, and test procedure generation tools) may be used throughout the entire development life cycle.
The in-depth descriptions of the tools that follow the table list many Web site URLs. The authors are aware that these URLs change often. If you find an outdated URL, please refer to the authors’ Web site, http://www.autotestco.com, for an up-to-date list of these specific URLs.
B.2 Business Analysis Phase
B.2.1 Business Modeling Tools
B.2.1.1 Oracle Designer/2000
Oracle Designer/2000 is a toolset for recording definitions of user needs and automating the rapid construction of flexible, graphical, client-server applications. When integrated with Oracle’s Developer/2000, Designer/2000 provides a solution for developing second-generation enterprise client-server systems. For more information on Oracle Designer/2000, visit http://www.oracle.com.
Version 2.0 of Designer/2000 provides a fully integrated modeling and generation environment known as the Design Editor. The Design Editor provides a single-user interface for the design of both client and server applications, and a framework in which the cooperative generators share and synchronously maintain design information. During the design process, the test engineer records information in the Designer/2000 Repository. This design information is stored as design-level object definitions and is used by the generator products to generate databases and client applications.
The Design Editor provides test personnel with many different ways of performing tasks, allowing you to make your own choices as to how you want to work: design guides, which guide you through the entire process of creating client and server applications; design components, which are tailored to specific tasks, such as creating modules for application generation or setting preferences; or design wizards, which step you through specific tasks, such as defining module components. The Design Editor presents information in different views. The purpose of the views is to present you with only the information that you need to perform certain main processes, such as designing client applications or recording distribution details for a database design.
Design Components
Using the different components in the Design Editor, you can create, edit, and delete the design-level objects that you require. Each component type, with the exception of navigator windows, has a specific purpose and can be used for manipulating object definitions that are related to that purpose only. For example, module diagrams can be used for defining client applications only; they cannot be used for tasks such as setting generator preferences or creating table definitions.
The types of components within the Design Editor include the Object Navigator, data diagrams, and module diagrams. The Object Navigator is used for managing and viewing all design-level object definitions that exist in the Repository. This component represents the relationships between objects, hierarchically. Data diagrams are used for designing databases; they graphically represent the relationships between the objects that make up the database design. Module diagrams are used for designing modules for application generation; they graphically represent the relationships between the objects that make up generated applications. The generator preferences palette is used for setting preferences to refine the behavior and appearance of generated applications. This component cannot be used to create object definitions. The Logic Editor is used for developing procedural logic code for client applications; the logic can be either server-side or client-side.
The action of selecting an object, such as a module, and dragging it onto the main Design Editor window opens the module diagram for the selected module. This same drag-and-drop technique can be used to open a data diagram and the Logic Editor if the appropriate design object is selected. The Object Navigator and the other diagrams are designed to work together, allowing objects to be selected in one component and dropped in another. For example, a table and some columns can be selected in the Object Navigator and dropped on an open module diagram to automatically create usage of those tables and columns by that module.
Design Editor Views
Each view in the Design Editor is presented on a different tab in the navigator window. Each view relates to one of the following main design processes, and therefore displays Repository information that is relevant to that process only:
Designing a first-cut database
Designing client applications
Recording database administration details
Recording database distribution details
One Hundred Percent Generation
Designer/2000 Release 2.0 enables the 100% generation of client-server applications by the use of application logic and reusable module components. Application logic is custom code that may be recorded as part of the system design in the Designer/2000 Repository. Generators then incorporate this logic into the generated system, removing the need to modify generated programs other than through Designer/2000. Module components (parts of program specifications) can be reused and shared between modules; generators then create reusable objects as appropriate to the target environment.
Application Logic
Designer/2000 Release 2.0 provides the facility to record application logic or “custom code” within the Repository and to have the generators embed that code within the generated applications. This approach reduces the need for regeneration options or post-generation alterations to generated code, thereby improving the manageability and maintainability of systems developed using Designer/2000.
The reverse-engineering and design-capture capabilities of Designer/2000 also enable 100% reverse engineering of application logic as well as 100% generation. The Repository allows the storage and definition of application logic by holding the event model for each target language. For the Form Generator, logic can be defined at the form, block, and item levels for event points such as WHEN-VALIDATE-ITEM and PRE-INSERT. Each event point may have several pieces of code associated with it, including some user-defined (application logic) and some generated from declarative definitions (generated logic).
Designers can see the code that is to be generated from Repository definitions and sequence their own application logic within the generated code “chunks” as required. If necessary, users can also replace the generated application logic with their own. This concept is extended to the Server Generator for the definition of application logic in database triggers and commit time server-side procedures.
Application logic can be recorded against modules of all types and is fully supported by the generators for Developer/2000 Forms, Reports, and Graphics; WebServer applications; and Visual Basic. To permit this functionality, the Logic Editor supports the syntax of PL/SQL v2, Oracle Basic, Visual Basic, and Java.
Reusable Module Components
Designer/2000 enables increased productivity through reusable module components. A module component maps to a block in Forms, a group in Reports, or a zone in Visual Basic. In Designer/2000 terms, a module component typically consists of a base table and its lookup tables; it provides a logical “view” to the end user. All data input by any Designer/2000 tool at any stage of development are stored in a central Repository, enabling teamwork and project management. Designer/2000 supports a choice of development approaches.
Supported Environments
On the server side, Designer/2000 supports the definition, generation, and design recovery of the following database types, via a native Oracle connection and ODBC connectivity: Oracle 8, 7.3, 7.2, 7.1, and 7.0; Personal Oracle Lite; Rdb; ANSI 92; DB2/2 and MVS; Microsoft SQL Server; and Sybase.
On the client side, Designer/2000 supports the following: generation of Form, Report, and Graphics components; generation of Visual Basic applications; generation of WebServer applications; generation of MS Help; and integration with other generated applications.
B.2.1.2 Rational Rose
Rational Rose is a business modeling tool, but also has many other uses during the testing life cycle. At a higher level, Rational Rose maps the business problems to requirements, and then maps requirements, logic, and code at the subsequent levels. For more details on Rational Rose, see Section B.4.1.1.
B.2.2 Configuration Management Tools
It is important that the final outputs of each life-cycle development phase be baselined in a configuration management tool (for the reasons described in Chapter 8). Many tools used throughout the development and testing life cycle come with built-in configuration management. For tools that lack this feature, it is important that all outputs are baselined. A configuration management tool such as Rational’s ClearCase allows for version control, workspace management, build management, and process control.
B.2.2.1 ClearCase
Features of ClearCase include parallel development for teams:
• Automatic merging of as many as 32 contributors
• Additive and subtractive merging
• Graphical merge tools with editable, synchronized windows
Version control features include the following:
• Checkin/checkout development model
• Graphical display of version evolution
• Version directories, subdirectories, and file system objects
• Unlimited branching
• Interleaved delta compression and automatic caching
• RCS, SCCS, PVCS, DSEE, SourceSafe, and UNIX file conversion
Workspace management features are provided as well:
• Transparent access to all version objects
• Rule-based version selection
• Multiple, active views
• Dynamic workspace configuration and update
• Support for disconnected use (Windows only)
• Instant reconstruction of past configurations
Build management features include the following:
• Generation of a detailed bill of materials
• Compatibility with popular UNIX and Windows makefiles
• Automatic detection of makefile dependencies
• Network-wide binary sharing without copies
• Parallel builds on multiprocessor hosts
• Distributed builds and network load balancing
Process control features are as follows:
• Supports SEI Capability Maturity Model and ISO 9000
• Sets event triggers via user-defined programs or scripts
• Graphically manages logical process relationships
Specifications for ClearCase are as follows:
Hardware
• IBM or 100% compatible PC with a 486 or higher processor
Client Requirements
• 32MB RAM
• 35MB hard disk space
Server Requirements
• 64MB or more RAM
• 70 MB hard disk space (dependent on code base size)
Supported Environments
• Windows 95 and 98 (client only)
• Windows NT
• UNIX
B.2.3 Defect Tracking Tools
Defect tracking tools are used to manage the defects generated throughout the various life-cycle phases. Depending on your needs, you can select from a variety of defect tracking tools on the market (see Chapter 8 for a defect tracking evaluation checklist).
B.2.3.1 PVCS Tracker
PVCS Tracker is an enterprise-wide solution that captures, manages, and communicates the crush of feature requests, defect reports, and changes for a software development project. Using the I-NET interface, project team members anywhere in the world can directly capture all issues. They can easily establish priorities, assign ownership, manage hand-offs, and track issues from emergence to resolution. Tracker’s automatic notification allows all team members to stay on top of changes that affect them. For more information concerning the PVCS product, see http://www.microfocus.com.
PVCS Tracker highlights include the following:
• I-NET (Internet and intranet), when enabled, allows you to choose your interface.
• Two interfaces are available for Tracker: traditional Windows and the Tracker I-NET Web interface. The Tracker I-NET interface allows access to Tracker via the Web, enabling you to use the Internet and intranets. Key capabilities are included in I-NET interface, including login, submit, in tray, query, and anonymous submit.
• Tracker associates revisions with problem descriptions.
• It automatically reports who, what, when, and why information for all module changes.
• It supports version labels for fixed modules to close a problem report.
• The in tray shows new or changed problem reports and change requests.
• Tracker automatically notifies users of ownership and status changes.
• PVCS Notify is integrated for automatic notification of Tracker and non-Tracker users through enterprise e-mail systems.
• Predefined reports and queries are available.
• You can generate custom graphical and text reports with fill-in-the-blank dialog boxes.
• You can customize report appearance by using the reporting toolbar.
• You can filter records with a conditional query.
• You can build custom queries with a point-and-click interface.
• Tracker provides an open architecture with an application program interface (API) and ODBC.
• It can link to other applications such as call tracking, help desk, automated testing, and Web systems.
• The open database support with ODBC technology works with dBASE, Oracle, SQL Server, and Sybase databases.
The Tracker I-NET Interface requires the following:
• Windows NT 3.51 or later
• Netscape Enterprise or FastTrack Server 2.0 or later
• Microsoft Internet Information Server 2.0 or later
• One of the following Web browsers: Netscape Navigator 3.0 or Microsoft Internet Explorer 3.0
Compatible databases are as follows:
• Oracle 7
• Microsoft SQL Server 4.21, 4.21a, 6.0, and 6.5
• Sybase System 10
Hardware and software requirements include the following:
• Personal computer with 386, 486, or Pentium-based processor
• Windows NT 3.51 or later: minimum of 16MB RAM, 32MB recommended; or Windows 95 or Windows 3.1: minimum of 8MB RAM, 16MB recommended
• Installation disk space: local—20MB, network—20MB on network file server, 3MB on workstations
• Compatible mail systems: Lotus cc:Mail, Lotus Notes mail, Microsoft Mail, or SMTP
B.2.3.2 TestTrack
TestTrack is a bug tracking software with many features, such as receiving bug reports via e-mail, sending e-mail notifications, handling duplicate bugs as single bug reports, automatically generating product release notes, attaching files to bug reports, and full cross-platform support. In addition to tracking bugs and enhancement requests, TestTrack tracks test configurations and team members. By tracking test configurations, you can match problem patterns related to specific computer software and hardware setups. By tracking team members, you can monitor workloads at a glance, determine which team members are overloaded, and reassign some of their work to other members. For more information concerning the TestTrack product, see http://www.seapine.com/.
Track Development Data
• Track bugs, feature requests, customers, users, user groups, and test configurations
• Identify your bugs and other development assignments in TestTrack’s workbook
• Attach files to bug reports
• View attached pictures and text without leaving TestTrack
• Track estimates
Help Desk Support
• Access customer bug histories
• Search for and work with bug reports by customer
TestTrack Web
• Access TestTrack functionality from a standard Web browser
• Share existing databases with native TestTrack users
• Allow customers to check the status of previously reported support issues
• Automatically e-mail acknowledgments to customers who report support issues
Multiuser Support and Security
• Single- and multiple-user support in one package
• Security features that control data available to each user
• Password protection for single-user files
• Simultaneous access with automatic record locking
Customization
• Customize fields to meet individual product needs
• Customize the bug list to filter the fields displayed on the screen
• Specify required fields and field defaults
• Customize Solo Bug’s field names to fit the project
Notification
• Automatically notify the development team of bug assignments, new bugs, changes, and so on using TestTrack’s internal notification system and SMPT and MAPI e-mail
• Quickly identify new bugs, changed bugs, and assigned bugs by using TestTrack’s indicators
• Provide a notification list with each defect
Queries and Sorting
• Search for bugs by word or phrase
• USL date- and user-sensitive filters to query the database
• View user statistics such as how many bugs a user found or fixed
• Create and save custom filters/queries
Reporting
• Print or preview reports
• Customize detail, list, distribution, and trend reports
• Automatically generate release notes
• Save reports to text files
• Import data from tab- and comma-delimited files
• Export data to tab- and comma-delimited files
Simplified Bug Reporting
• Comes with Solo Bug, a stand-alone bug reporter for customers and beta sites so they can send bug reports directly to you via e-mail
• Automatically imports customer-reported bugs from an e-mail account
Cross-Platform Support
• Cross-platform support for Windows 95 and NT and Macintosh
• Solo Bug available for Windows 95, NT, and 3.1 and Macintosh
Supported Environments
• Windows 95 and NT 4.0, Macintosh 68K, and PPC
B.2.3.3 Census
Census is a defect tracking system with a graphical interface that offers predefined queries, reports, and more. For more information concerning the Census product, see http://www.metaquest.com/.
Defect Life-Cycle Model
Census provides a defect life-cycle model for tracking defects from initial discovery to final resolution. Defects are either open or closed. Substates (new, to be verified, canceled, fixed, and more) define the different stages in the defect life cycle. You redefine the substates to tailor the life-cycle model software project.
Quick and Easy Access to Your Data
Census’s data display can be customized. It has many predefined queries and reports, or you can build new queries (no SQL needed) and define custom reports (and graphs). You can add new queries and reports to the predefined lists so other users can access them.
Security and Privileges
Census’s security restricts access to the system and to features. Different levels of functionality can be defined. Features not required for specific job functions can be disabled until needed.
Customization
Census provides a Template Editor for tailoring the defect record to your unique requirements. Set the choice values for fields like Product, Version, and Functional Area. Change labels and add new fields (select from nine field types). Set field attributes such as required, visible, and more. Indicate which groups can modify a field.
Powerful Architecture
Census is built around an innovative architecture composed of a core with a configurable template. The core provides the basic functionality required by any information tracking system—database access, queries, reports (and graphs), user/group privileges, print and mail support, automatic mail notification, and more.
Notifications and Electronic Mail
Census can send notifications, via electronic mail, when specific events occur—for example, when a defect is assigned to a new owner, when the status of a defect changes, or when the number of open defects exceeds a given threshold. Select from lists of predefined notifications or create your own. For each notification, specify the recipient and the contents. Mail defects (reports) from within Census using any MAPI-compliant mail system (Microsoft Mail, cc:Mail, and more).
Features
• Security—restrict user access to Census, define group privileges, restrict access to projects, and define who can modify fields
• Query Editor—edit existing queries (filters) and define new queries
• Sort Editor—edit existing sort criteria and define new sort criteria
• Organizer—share common styles between team members
• Report Editor—edit existing reports or create new reports
• Viewing of reports as text and graph (line, bar, and pie)
• More than 60 predefined query, sort, layout, and report styles
• Mail defect records or summary list contents as text or RTF
• Defects profile (set default values for new defects)
• Multiuser support (central database)
• Tracking of every change made to a defect using the revision history
• Construction of automatic e-mail notifications
System Requirements
• Windows 95 or NT
• 486 processor or higher
• Minimum of 25MB of hard disk space
• Minimum of 32MB RAM (additional memory will significantly improve performance)
• Disk space requirements for a Census server—dependent on database size (minimum of 50MB).
• Workgroup users—networking software, such as Microsoft Windows for Workgroups, Novell Netware, or Artisoft Lantastic
• Notifications—MAPI-compliant electronic mail system
• Power Customizations (replacement of Census template)—Microsoft Access license
B.2.4 Technical Review Management
B.2.4.1 ReviewPro
ReviewPro is a Web-based, software technical reviews and inspections tool. Technical reviews and inspections have proved to be an effective form of defect detection and removal. This tool automates this valuable process and prevents the migration of defects to later phases of software development. For more information on ReviewPro, visit http://www.sdtcorp.com.
Benefits of ReviewPro include the following:
• Automates defect detection and removal method
• Takes advantage of latest collaboration and Web technology for optimal productivity
• Provides everywhere access to the review process analysis and results
• Can be implemented with the existing IT infrastructure
• Offers quality and productivity improvements that make this tool an easy management sale.
ReviewPro supports the Windows NT and UNIX platforms.
B.2.5 Documentation Generators
Automated documentation generators such as Rational’s SoDA can also aid in the testing life cycle.
B.2.5.1 SoDA
SoDA—Software Documentation Automation—is designed to reduce your efforts to create and regenerate development life-cycle documentation and reports. SoDA provides a common interface for extracting information from multiple tool sources, easing your ability to produce comprehensive project documentation. For more information, visit www.rational.com.
Highlights
• Provides WYSIWYG template creation for customization of documents
• Preserves data entered directly into the document from generation to generation
• Performs incremental document regeneration to reduce turnaround time
• Enables extraction of data from multiple information sources to create a single document
• Accommodates your choice of tools from which to extract information
• Maintains consistency between documents and information sources
• Can be integrated with a powerful publishing tool
• Provides a single documentation-automation solution across the software life cycle
Hardware and Software Requirements
• Microsoft Windows 95 or NT
• Microsoft Word 95 or Word 97
• 24MB RAM (48MB recommended)
• 25MB hard disk space
• PC with Pentium 90 processor (Pentium 150 recommended)
B.3 Requirements Definition Phase
B.3.1 Requirements Management Tools
Requirements management tools allow you to manage and organize your requirements. A requirement is a condition or capability to which the system must conform [1]. Requirements management is a systematic approach to eliciting, organizing, and documenting the requirements of the system; this process establishes and maintains agreement between the customer and the project team on the changing requirements of the system [2]. There are many requirements management systems, such as Requiste Pro by Rational and DOORS by QSS.
B.3.1.1 RequisitePro
RequisitePro is a Windows-based tool that organizes any requirements (high-level business, functional, design, test) by linking Microsoft Word to a requirements repository and providing traceability and change management throughout the project life cycle. RequisitePro combines both document-centric and database-centric approaches and can be integrated with the development processes and tools. Key users for RequisitePro are all software or systems development team members—business analysts, project managers, product marketing managers, development managers, QA managers, developers, and so on.
One of the challenges in any project is managing the inevitable change in user requirements, software specifications, and test requirements and, more importantly, communicating those changes to everyone on the team. RequisitePro’s automated traceability feature displays requirements relationships through a top-down, graphical hierarchy, so all team members can identify which requirements are affected by a change. Traceability relationships can be established within a single project or across multiple projects. Requirements and their changes are tracked all the way through implementation and testing to ensure that you deliver what you originally intended.
System Specifications
• Microsoft Windows 95 or NT 4.0
• 64MB
• 55MB hard disk space (minimum)
• Pentium 133 or better for optimal performance
• Any Windows-supported LAN
• Microsoft Word 95 or Word 97
B.3.1.2 DOORS
DOORS (Dynamic Object-Oriented Requirements System) is software for information management and traceability (IMT) needs. DOORS is used for managing requirements throughout the development life cycle. DOORS 4.0 is a project repository, adding a range of features that help individual users and corporations to capture, link, analyze, manage, and distribute key requirement data. Most requirements management tools allow for automatic tracing—for example, tracing of test procedures to requirements, design to requirements, and so on. For more information concerning DOORS, see http://www.qssinc.com/.
DOORS Wizards
• Project Creation Wizard
• Report Manager Wizard
• Page Layout Wizard
• View Wizard
• Impact/Trace Wizard
• Graph Column Wizard
• Iconizer Wizard
Capabilities
• Identifying requirements
• Structuring requirements within documents
• Accepting requirements from many sources
• Retaining a requirements change history
• Tracing between requirements in many documents
• Managing large numbers of changes
• Providing early risk analysis
• Providing life-cycle traceability and compliance
• Supporting the formal analysis process
• Generating documentation and traceability reports
Major Features
• Many import and export formats
• User-definable attributes
• User-definable views
• Sharable data and network compatibility
• Integrated, controlled change process
• Version history and baselines
• Traceability through link creation
• Customization through dxl (DOORS proprietary language)
• Full life-cycle and project support
DOORS is an X-Windows application with a Motif or OpenLook interface, depending on the host platform. It is also available for PC. The recommended UNIX configuration is 32MB RAM, 10MB disk space, and implementation on Sun SPARC, HP 9000, or IBM RS/6000 units.
B.3.2 Requirements Verifiers
Requirements verifiers are now available to support requirements management. For example, the Software through Pictures modeling tool from Aonix includes three checking functions: Check Syntax, Check Semantics, and Check Testability. Requirements that pass these functions are deemed unambiguous, consistent, and complete enough for testing [3]. Another example is Validator/Req, a powerful new requirements-driven validation and test generation tool. For more information, see http://www.aonix.com.
B.3.3 Use Case Generators
One method of modeling requirements is via use cases. The use case construct defines the behavior of a system or other semantic entity without revealing the entity’s internal structure. Each use case specifies a sequence of actions, including variants, that the entity can perform, by interacting with actors of the entity.
One popular use case generator is Rational Rose (see Section B.4.1.1). Its Use Cases package is a subpackage of the Behavioral Elements package. It specifies the concepts used for definition of the functionality of an entity like a system. The package uses constructs defined in the Foundation package of UML as well as in the Common Behavior package.
The elements in the Use Cases package are primarily used to define the behavior of an entity, such as a system or a subsystem, without specifying its internal structure. The key elements in this package are UseCase and Actor. Instances of use cases and instances of actors interact when you work with the services of the entity. How a use case is realized in terms of cooperating objects, defined by classes inside the entity, can be specified with a Collaboration. A use case of an entity may be refined to a set of use cases of the elements contained in the entity. The interaction of these subordinate use cases can also be expressed in a Collaboration. The specification of the functionality of the system itself is usually expressed in a separate use case model (that is, a Model stereotyped “useCaseModel”). The use cases and actors in the use case model are equivalent to those of the system package.
UseCase
In the meta-model, UseCase is a subclass of Classifier, containing a set of Operations and Attributes specifying the sequences of actions performed by an instance of the UseCase. The actions include changes of the state and communications with the environment of the UseCase.
There may be Associations between UseCases and the Actors of the UseCases. Such an Association states that instances of the UseCase and a user playing one of the roles of the Actor communicate with each other. UseCases may be related to other UseCases only by Extends and Uses relationships—that is, Generalizations stereotyped “extends” or “uses.” An Extends relationship denotes the extension of the sequence of one UseCase with the sequence of another one, while Uses relationships denote that UseCases share common behavior.
The realization of a UseCase may be specified by a set of Collaborations. That is, the Collaborations may define how instances in the system interact to perform the sequence of the UseCase.
Actor
An actor defines a coherent set of roles that users of an entity can play when interacting with the entity. An actor has one role for each use case with which it communicates.
In the meta-model, Actor is a subclass of Classifier. An Actor has a Name and may communicate with a set of UseCases and, at realization level, with Classifiers taking part in the realization of these UseCases. An Actor may also have a set of Interfaces, each describing how other elements may communicate with the Actor.
An Actor may inherit other Actors. The inheriting Actor will be able to play the same roles as the inherited Actor—that is, communicate with the same set of UseCases as the inherited Actor.
B.4 Analysis and Design Phase
B.4.1 Visual Modeling Tools
An example of a visual modeling tool, Rational Rose, is described in this section. For more information concerning the Rational Rose product, see http://www.rational.com/.
B.4.1.1 Rational Rose
Rational Rose is an object-oriented analysis, modeling, design, and construction tool. It supports the Unified Modeling Language (UML), the standard notation for software architecture. The UML is the industry-standard language for specifying, visualizing, constructing, and documenting the artifacts of software systems. It simplifies the complex process of software design, making a “blueprint” for construction. The UML definition was spearheaded by Rational Software’s industry-leading methodologists: Grady Booch, Ivar Jacobson, and Jim Rumbaugh [4].
Rational Rose, as a visual modeling tool, allows developers to define and communicate a software architecture, resulting in accelerated development, by improved communication among various team members. The tool also improves quality, by mapping business processes to software architecture. It increases visibility and predictability, by making critical design decisions explicit visually.
Component-Based Development
• Rational Rose users can model their components and interfaces through component modeling.
• Required components of a design can be reverse-engineered to explore the interfaces and interrelationships of other components in the model.
Multilanguage Development
• Rose 98 Enterprise Edition has multilanguage support—for C++, Java, Smalltalk, and Ada, as well as 4GLs such as Visual Basic, PowerBuilder, and Forté.
• Rose 98 generates Interface Definition Language (IDL) for CORBA applications and Data Description Language (DDL) for database applications.
Roundtrip Engineering
• Rose 98 allows you to move easily from analysis to design to implementation and back to analysis again, and thus supports all phases of a project’s life cycle.
• Rational Rose 98 supports a change management process with forward engineering, reverse engineering, and model updating features that allow users to alter their implementation, assess their changes, and automatically incorporate them in their design.
Full Team Support
• Rational Rose 98 supports teams of analysts, architects, and engineers by enabling each to operate in a private workspace that contains an individual view of the entire model.
• Multiple engineers can work on complex problems concurrently; changes are made available to others by checking them into a configuration management and version control (CMVC) system. Having a protected workspace means that one person’s changes won’t affect the whole model until the time comes to share these alterations with the rest of the project.
• Rose 98 can be integrated with major CMVC tools, including Rational ClearCase and Microsoft SourceSafe, and is open to other CMVC systems.
Visual Differencing
• The Visual Differencing tool is a graphical comparison and merge utility that shows the differences between two models or controlled units.
Platforms Supported
• Windows 95 and NT
• Solaris 2.5 and 2.6
• HP-UX 10.2 and 11.00
• SGI IRIX 6.2 and 6.4
• AIX 4.1.4 and 4.2
• Digital UNIX 4.0B and D
System Requirements
Windows
• Microsoft Windows 95 or NT 4.0
• 486-based or Pentium-based PC-compatible computer system
• 24MB RAM (recommended)
• 25 MB hard disk space
• SVGA-compatible display (256 or more colors recommended)
• Any pointing device with at least two buttons
• 32 + (16 * N) MB of RAM (where N is the number of users running Rose simultaneously on a given workstation)
• Midrange UNIX server or client UNIX workstation
• Any UNIX workstation or PC capable of displaying X Windows
• 200MB hard disk space for loading release + 1–3MB for each Rose model
• CD ROM reader
• Color display
B.4.2 Structure Charts, Flowcharts, and Sequence Diagrams
One tool that supports diagramming, Micrografx FlowCharter 7, is described in this section. For more information on the Micrografx FlowCharter 7 product, see http://www.micrografx.com/.
B.4.2.1 Micrografx FlowCharter 7
Micrografx FlowCharter 7 is a diagramming solution to manage business processes. It creates interactive diagrams of business processes, workflow, computer networks, Web sites, databases, and much more. It can create the following types of charts:
• Flowcharts
• Process Maps
• Organization Charts
• Network Diagrams
• Data Flow Diagrams
• Web Site Diagrams
• Project Timelines
• Decision Trees
• Deployment Charts
• SPC Charts
• “Swim Lane” Process Diagrams
• Total Quality Diagrams
• Auditing Diagrams
• Block Diagrams
• Cascade Diagrams
• Comparison Charts
• Deployment Charts
• DrawBar Diagrams
• Pyramid Charts
• Circle-Spoke Diagrams
• Target Charts
Hardware and Software Requirements
• Microsoft Windows 95, 98, or NT 4.0
• Pentium or faster processor
• 24MB RAM (32MB recommended)
• 50–250MB hard disk space
• VGA or better video
• CD-ROM and mouse
B.4.3 Test Procedure Generators
Validator/Req from Aonix is an example of a test procedure (case) generator packaged with a requirements recorder. Validator applies heuristic and algorithmic means to requirements information to create test procedures. Aonix’s Validator/Req tool includes a tracer as well as a requirements recorder, verifier, and test procedure generator. It can be used in Sun Solaris, HP-UX, UNIX, and Windows NT environments.
With the Validator/Req, you can
• Capture your specification in English
• Model your specification in test-ready use cases
• Prevent the most probable errors in specifications
• Generate industry-standard specifications
• Automatically generate test cases and scripts
• Automatically trace requirements to and from test cases
Designers who use Aonix’s Software through Pictures modeling tools can record their requirements graphically in use cases. In addition, designers may record their designs as either object or structured models, depending on which methodology they follow. Then they can use Aonix’s Validator/Req tool to generate test procedures from requirements and Interactive Development Environment’s StP/T tool to generate test procedures from software design.
B.5 Programming Phase
B.5.1 Syntax Checkers/Debuggers
Syntax checkers and debuggers usually are built into any third- or fourth-generation programming language compiler, such as C, C++, Visual Basic, or Powerbuilder. Even though this option is often taken for granted, syntax checkers and debuggers are important tools that improve the testing life cycle.
B.5.2 Memory Leak and Runtime Error Detection Tools
One runtime error and memory leak detector, Purify, is described here.
B.5.2.1 Rational Purify
Using Rational’s patented Object Code Insertion (OCI) technology, Rational Purify runs after compilation and post-processes the object modules from which an executable is generated, producing an executable with runtime error checking inserted into the object code. As the code is executed, all memory accesses are validated to detect and report errors at the time of occurrence. Purify also reports memory leaks, showing where memory has been allocated but to which no pointers exist, so that the memory can never be used or freed [5].
Purify detects runtime errors with or without source code. It detects errors everywhere (third-party libraries, shared libraries, C code, + code, FORTRAN code, assembly code, C library, and system calls, for example). Errors identified include the following:
• Uninitialized local variables
• Uninitialized malloc’d memory
• Use of freed memory
• Freeing of mismatched memory
• Overwriting array bounds
• Overreading array bounds
• Memory leaks
• File descriptor leaks
• Stack overflow errors
• Static memory access errors
The intuitive graphical user interface offers the following features:
• Outline view for efficient error message browsing
• Color support for identifying critical errors quickly
• Point-and-click access to source code for editing
• Menu access to runtime options and suppressions
• Advanced debugging capabilities: pinpoints bug origin by stack trace and source line number, just-in-time debugging quickly isolates errors with the debugger, and New Leaks button instantly generates memory leak reports at any point in the program
Purify identifies and reports errors in multithreaded applications and memory allocated with custom memory managers. It can be used to create an integrated development solution with most common debugging tools and PureCoverage (for identifying untested code). It is easy to install and runs on multiple platforms.
Capabilities
• Identifies execution errors and memory leaks within your application everywhere they occur.
• Helps developers eliminate runtime problems before they reach the end user.
• Improves productivity and reduces development time by presenting accurate information in an easy-to-use and understandable interface. For today’s complex software development projects, runtime or memory access errors are some of the most difficult problems to solve. Reading or writing past the boundary of an array, leaking memory unpredictably, or using uninitialized memory with random contents is a potentially disastrous error that can take weeks to find and fix. Purify solves these problems by combining runtime error checking and a graphical user interface.
• Uses OCI technology to intercept memory accesses by inserting additional instructions into the object code before every load and store operation. The major advantage to OCI is completeness: all code, including third-party and shared libraries, is checked in this manner. Even hand-optimized assembly code can be checked. OCI helps Purify precisely locate more types of errors in more areas of your application than any other similar tool. Thus bugs in application code that manifest themselves in vendor or third-party libraries are detected.
• Provides automatic checking by adding one word, purify, to the application’s makefile. The resulting program is a standard executable that can be executed or run under a debugger.
• Offers both interactive and batch reporting of error messages to make analysis easier. A graphical user interface allows the user to browse error messages. The hierarchical or outline display provides detailed information for specific error messages, focusing the user on the most critical errors first. Access to application source code or development processes such as run, make, and debug are only a mouse click away. This instant access makes correcting application errors simple and easy.
Supported Environments
• Sun SPARC workstations running SunOS 4.x
• Sun SPARC workstations running Solaris 2.3 through 2.5.1
• HP 9000 Series 700 workstations running HP-UX 8.07, 9.0.x, or 10.x
• HP 9000 Series 800 workstations running HP-UX 8.07, 9.0.x, or 10.x
• SGI workstations running IRIX 5.2, 5.3, or 6.2
• Windows NT (may be operating within Microsoft Visual Studio 6 development environment)
B.5.3 Code Checkers
One code checker tool, CodeCheck, is described in this section. For more information concerning the CodeCheck product, see http://www.abxsoft.com.
B.5.3.1 CodeCheck
CodeCheck (from Abraxas Software) measures maintainability, portability, complexity, and standards compliance of C and C++ source code. CodeCheck Version 8.0 is a programmable tool for managing all C and C++ source code on a file or project basis. CodeCheck is designed to solve many of your portability, maintainability, complexity, reusability, quality assurance, style analysis, library/class management, code review, software metric, standards adherence, and corporate compliance problems.
Features
• Maintainability—identifies and measures complex, sloppy, and hard-to-maintain code
• Portability identifies code that will not port between DOS, OS/2, UNIX, VMS, Microsoft Windows, and Macintosh environments or to 64-bit machines
• Complexity—measures program size (Halstead) object-oriented metrics, program cost, and program complexity (McCabe)
• Compliance—automates your corporate C/C++ coding and project specification standards for compliance validation
CodeCheck is input-compatible with all variants of K&R, ANSI C, and C++ (Microsoft, Metaware, Borland, Intel, Vax/Vms-Ultrix, HP/Apollo, Microtec, Watcom, Symantec, Apple MPW, CodeWarrior, AT&T, and GNU).
B.5.4 Static and Dynamic Analyzers
Examples of static and dynamic code analysis toolsets are LDRA Testbed by LDRA and Discover by Software Emancipation Technology. For more information concerning the LDRA Testbed product, see http://www.ldra.co.uk. More information on Software Emancipation’s tools is available on the Internet at www.setech.com.
B.5.4.1 LDRA Testbed
LDRA Testbed is a unique quality-control tool for high-caliber program testing of computer software that is required to be reliable, rugged, and as error-free as possible. As a complete package of testing modules integrated into one automated software testing toolset, LDRA Testbed enables a greater degree of software testing to be attained.
LDRA Testbed’s two main testing domains are Static and Dynamic Analysis. Static Analyzis analyses the code. Dynamic Analysis involves execution with test data, through an instrumented version of the source code, to detect defects at run-time. Within these two testing fields, LDRA Testbed analyzes the source code, producing report files in textual and graphical form that depict both the quality and structure of the code. This testing process enhances understanding of the source code and highlights areas of concern. These areas can then be either reworked or removed.
Static Analysis searches the source code for any programming standards violations.
LDRA Testbed’s Static and Dynamic Analysis results are recognized by many international regulatory bodies as a clear indication of the quality of code and the extent to which it has been tested.
Windows Platforms Supported
• Windows 95
• Windows 3.1x
UNIX Platforms Supported
• Sun OS
• Solaris
• HP-UX
• IRIX
• SCO
• AIX
• DEC UNIX (OSF/1)
Languages Supported
• Ada
• Algol
• C
• C++
B.5.4.2 Discover
Discover is a software development information system composed of a comprehensive, integrated set of applications and tools. It analyzes source code and creates a database of information (the Information Model) that captures the interrelationships between all entities in the code base, resulting in a detailed view and high-level architectural perspective of the entire application. The Information Model provides critical information for both management and the development team.
Discover captures detailed knowledge about the structure and operation of an organization’s software that might otherwise reside only in the minds of individual programmers, thereby bringing precision, manageability, and predictability to the software development process. This tool enables software professionals to more thoroughly understand their large software systems, to more efficiently and accurately effect changes to a large body of source code, and to more easily reengineer or reorganize a complex software system.
Finding a solution to the year 2000 (Y2K) problem is only one of many applications of the Discover system (see Section B.8.6.1). More than 150 corporations worldwide already benefit from using Discover. A key advantage of using DiscoverY2K today is the benefit of automating the software development process and improving software quality well beyond the millennium date change. Discover will help organizations address the coming expansion of the telephone and social security number formats, as well as the European currency unification.
Discover supports C and C++ source code, Oracle embedded SQL and PL/SQL, and Java. It runs on SunOS, Solaris, HP-UX, SGI IRIX, and Windows NT.
B.5.5 Unit and Integration Test Tools
B.5.5.1 APROBE
Chapter 7 of this book briefly discusses white-box (or structural) testing. While white-box testing can consume up to 60% of the total cost of a testing effort, it is not as ameniable to automation as black-box (or functional) testing, so the major focus of tool vendors has been to support the automation of black-box testing.
It is very difficult to get objective cost and defect figures for software development, but an excellent study on the matter is “Comparing and Combining Software Defect Detection Techniques: A Replicated Empirical Study”, by Murray Wood et al. Proceedings of the 6th European Conference help jointly with the 5th ACM SIGSOFT Symposium on Software Engineering, 1997. What makes this paper even more credible is that the research was repeated twice as two independent experiments and both yielded essentially the same results.
Those results were pretty much as you would expect. The study considers three methods of finding bugs: code reading, white-box testing and black-box testing. White and black-box testing both contribute significantly to quality, code reading not quite so much. What is interesting is that either white or black-box testing will increase quality by about 40 percent. Both together will increase quality by a little over 60%. This implies that (by some measure) white and black-box testing are equivalent in terms of adding quality. Either will yield about a 40 percent increase in quality. Either will add 20 percent to the overall quality when used in combination with the other. To get high quality software, a combination of white and black-box testing techniques are needed.
Aprobe is a white box testing tool. It is designed to support testers and developers in white-box testing. It supports the specific white-box tests as discussed in Chapter 7, but perhaps more importantly, supports the creation and running of white-box tests that are application specific. Aprobe is perhaps the first general-purpose tool to address the general test area of white-box testing.
Summary of Capabilities
Aprobe provides certain white-box testing capabilities as described in Chapter 7 right out of the box. These have intuitive GUIs to guide the user in their operation:
1. Test Coverage. What source lines of the application have been executed during a given test? Certainly code that has never been executed has never been tested and is more likely to contain a bug than code that has been executed at least once.
Aprobe can also modify the program under execution to force conditions to allow execution to reach places that would normally be hard to reach. For example, Aprobe can easily simulate an I/O error so that the application code that handles the I/O error will be executed.
2. Memory Checking. Aprobe checks for memory leaks, double de-allocations of memory, freeing of non-allocated memory and certain memory common memory corruption errors.
3. Performance Tuning. Aprobe identifies the routines that are consuming the most CPU and wall clock time.
What makes white-box testing so expensive, however, is that most white-box tests require a software development activity, not just a test activity. Aprobe supports the development and running of white-box tests by supporting the insertion and deletion of arbitrary code into an application without even changing the executable file. Aprobe is unique in this capability.
Aprobe allows the insertion of ANSI C code into the executable memory image. These small portions of code comprise the white-box tests. These portions of code (called probes), have access to any and all portions of the application, so can reference and modify portions of the application without ever changing the actual executable file. Additionally, Aprobe provides a number of useful white-box support functions. Aprobe also includes a very sophisticated logging mechanism that can easily log and format large amounts of data with little affect on the application execution.
Platforms Supported:
Windows 2000
Windows NT
Solaris 2.5.1 and higher
AIX 4.1 and higher
OS/390
Languages Supported:
Ada
C++
C
White papers, download demos and more information concerning the Aprobe tool from OC Systems can be obtained from www.aprobe.com or via email at [email protected].
B.5.5.2 Integrisoft MTE
Often to test and isolate a function from the main program, an engineer has to write a driver, stub(s), and specific test cases for each function. In some instances, the engineer needs to write multiple drivers and stubs to test a single function. The code for the driver and any stub(s) will typically be larger than the function itself. Therefore, having to write the driver and stub(s) might seem like moving one step backward for every step forward. This manual approach to unit testing is time-consuming, error-prone, tedious, and, in most cases, not repeatable.
The MTE product gives engineers the ability to automate the unit testing process. From its analysis of the source code, MTE has information on issues such as calling relationships and variable usage. Using this information, MTE will automatically build a test harness for automating the unit testing process.
MTE can automatically
• Generate the source code for a driver
• Generate the source code for stubs
• Generate the test case input file
• List global variables to initialize
• Generate a makefile
• Build a module test program
• Compile and execute the module test program
• Capture and display the global variable during the execution of the program
• Collect test coverage information during the execution of the program
• Verify that the expected output was achieved
• Save the results from running the program in a spreadsheet format for easy viewing
• Archive the test input files for future reuse
MTE is available for Windows NT, 95, and 98. For more information on MTE visit http://www.integrisoft.com.
B.6 Metrics Tools
B.6.1 Code (Test) Coverage Analyzers and Code Instrumentors
Examples of code (test) coverage analyzers and code instrumentor tools are provided below.
B.6.1.1 TCAT
TCAT (Software Research) code coverage analyzers are available for C, C++, and Java. TCAT, Version 2.1 for Windows 95 and NT 4.x, features 32-bit native executables, advanced compiler-based, source-language scanning technology, improved runtime support, and full GUI access to a project’s call trees, function and method digraphs, and current and past-test coverage data at both the branch (C1) and call-pair (S1) level. For more information concerning the TCAT product, see http://www.soft.com/.
Benefits
• Measure effectiveness of tests and test suites
• Identify untested code and reveal more defects
• Improve test efficiency
Key Features
• Combined branch and call-pair coverage for C and C++
• Annotatable call-tree displays with access to source
• Annotatable digraph displays with access to source
Applications
• Branch coverage: unit testing, integration testing
• Call-pair coverage: integration testing, system testing, test suite validation
• Graphical annotation: all levels of code test completion browsing, analysis
Supported Environments
• All major UNIX platforms
• SPARC SunOS 4.1.3
• Solaris 2.x
• x86 Solaris 2.x
• x86 SCO ODT 5.0 (3.0)
• SGI Irix 5.3, 6.2
• HP 9000–700 HP-UX 9.05
• DEC Alpha OSF/1
• 386/486 UNIX
• MS-DOS, Windows 95, Windows NT
B.6.1.2 Hindsight
Hindsight (from IntegriSoft) uses source code instrumentation for dynamic testing. HindSight analyzes (reverse-engineers) C, C++, and FORTRAN source code and produces charts, diagrams, and reports that aid in the process of program understanding. These visual representations of the user’s program allow you to see program structure, logic, and variable usage. This product runs in UNIX.
Hindsight uses source code instrumentation for dynamic testing. Multiple levels of test coverage are measured, including segment, branch, and conditional coverage. The appropriate level of test coverage will depend on how critical your application is. To further extend test coverage, Hindsight simulates UNIX system functions so you can reach error-handling routines for functions such as malloc.
The product’s Module Test Environment offers developers an automated environment for the generation of module test programs for software unit testing and verification. The Test Procedure Environment allows you to trace requirements to functions (or classes) and test procedures while making test coverage measurements. This approach supports impact analysis and allows you to determine which test procedures to run when a function changes, allowing you to rerun those test procedures immediately. A minimization algorithm determines a minimum set of test procedures while guaranteeing maximum test coverage.
Hindsight calculates source code measurements and software metrics for use in software quality assurance. The metrics calculated include cyclomatic complexity, data complexity, Halstead metrics, and design complexity. Metric reports such as Kiviat diagrams and metrics exception reports are presented for easy visualization of quality measurements. For more information concerning the Hindsight product, see http://www.IntegriSoft.com/.
B.6.1.3 EZCover
EZCover is a C/C++ test coverage tool from IntegriSoft. It allows engineers to see how effective their testing efforts are by showing which parts of the source code have been executed. Perhaps more importantly, it identifies which parts have not been tested. One of the biggest benefits that this tool provides is to help the customer to identify which test cases should be run again in the event that the source code is modified. No longer is it necessary to run an entire test suite just to test a small portion of the source code. One other helpful capability is the fact that the tool can show the engineer the minimum number of test cases and still achieve the same level of coverage. (Both of these features are the same in the UNIX-based Hindsight tool.)
EZCover calculates software measurements that can be used to identify complex or error-prone code, as well as difficult-to-test and difficult-to-maintain areas of code. It supports the following metrics:
• Cyclomatic complexity with and without case
• Modified complexity
• Data complexity
• Fan in
• Fan out/squared
• Number of blank, comment, declaration, and executable lines
EZCover runs in the Windows NT, 95, and 98 environments.
B.6.1.4 STW/C
STW/C (Software Testworks/Coverage) is a set of tools for coverage analysis to ensure that your test procedures thoroughly exercise your program in as many diverse ways as possible. STW/C analysis tools measure how well your test procedures exercise your program at the unit, system, and integration test levels. STW/C utilizes three measures to ensure your test procedures are as thorough as possible by performing the following operations:
• Measuring logical branch (CI) completeness at the unit test level with TCAT-II
• Measuring call-pair (SI) completeness at the integration or system level with TCAT-II
• Measuring the number of times each path or path class in a module is exercised (Ct) at the unit test level with TCAT-PATH
STW/C measures runtime coverage at the following levels:
• Logical branch: For unit testing, measures the number of times each branch has been exercised for both True and False conditions
• Call-pair: For integration and system tests, measures the number of times each function call has been exercised, as errors in parameters are extremely common
• Path: For critical functions, measures the number of times each path, which is a sequence of branches, was exercised
Features
STW/C can help to find a high percentage of software defects occurring from unexercised and dead code. You can then concentrate on building more efficient test procedures and fixing the errors that are discovered.
Coverage Metrics
• CI metric—TCAT provides logical branch coverage with the CI metric.
• SI metric—S-TCAT provides call-pair coverage with the SI metric.
• Ct metric—TCAT-PATH provides path coverage with the Ct metric.
• Complete coverage—STW/C provides the coverage solution for test procedure validation.
• Critical coverage—STW/C provides coverage for mission-critical applications, such as an application needing FDA certification.
Instrumentation
• Selective instrumentation—allows for instrumentation of isolated modules or exclusion of modules that have already reached a certain level of coverage
• Makefile support—integrates instrumentation steps into the user’s existing makefile
• Control structures—recognizes and processes all control structures
Runtime Support
• Cross-development environments—performs coverage in cross-, remote, and embedded development environments
• Multiple concurrent processes—supports multiprocess programs
• In-memory reduction—optionally accumulates trace records in memory instead of being written to a disk
Coverage Reports
• Reports past, current, and cumulative test results
• Report types—provides hit, not hit, newly hit, newly missed, and linear and logarithmic histogram reports
• Directed graphs (digraphs)—uses call trees with graphic and color overlays to diagram a program’s module dependencies
• Subtrees—isolates a subtree of a call tree relative to a specific module that the user wants to investigate further
• Path viewing—displays the paths individually for a selected module
• Color annotation—uses different color overlays based on lower and upper threshold values to indicate if a function call or logical branch has been unexercised or heavily executed
• Source viewing—allows navigation from a graph to a function call, logical branch, or logical path in the source code
• Statistics—summarizes information about the displayed call tree or directed graph
• Print option—prints directed graphs and call trees to PostScript output
Dynamic Visualization
• Execute program parts—generates logical branch and call-pair coverage data in real time
• Display selection—shows coverage obtained for logical branches through directed graphs, call pairs through call-tree displays, and an overall percentage through slider bars
Supported Environments
• Sun SPARC
• x86 Solaris
• SCO
• SGI
• IBM RS/6000
• HP 9000 and 700/800
• DEC Alpha
• UNIXWare
• MS-DOS
• Windows NT and 95
For more information concerning the STW/C product, see http://www.ppgsoft.com.
B.6.1.5 PureCoverage
To locate untested areas of code, PureCoverage uses Object Code Insertion (OCI) technology to insert usage tracking instructions into the object code for each function, line, and block of code. OCI helps PureCoverage identify all portions of your application’s code that have not been executed in testing, including code in vendor or third-party libraries. Thus all areas of the application can be tracked to identify gaps in testing quickly, saving precious testing time and ensuring that untested code does not reach end users [7].
Features
Detection of Untested Code with or without Source Code
• Detects untested code everywhere: third-party libraries, shared libraries, C code, C++ code, FORTRAN code, assembly code, C library calls, system calls
• Detailed data collection for coverage per function, line, basic block, application, file, library, or directory
Intuitive Graphical User Interface
• Outline view for efficient browsing of summary coverage information
• Customizable views for control of data displayed and sorting criteria
• Point-and-click access to line-by-line data via an annotated source view
Robust Reporting Mechanism
• Merge data over multiple runs and dynamically update coverage statistics
• Merge data from multiple applications sharing common code
• Generate difference reports between multiple runs or executables
• Generate difference and low-threshold reports
• E-mail nightly coverage data to development team
• Export data suitable for spreadsheets
Integrated Development Solution
• Works with most common debugging tools
• Works with Purify for runtime error detection
• Works with ClearDDTS for immediate coverage reporting with PureCoverage output
• Supports both C and C++ development environments
Benefits
• Improves overall application quality
• Helps ensure all code has been executed and therefore tested
• Prevents untested code from reaching the end user
• Helps deliver more reliable code
• Enhances developer productivity and testing efforts
• Reduces development time
• Fits into the existing development environment
• Provides tight integration with developer productivity tools such as debuggers, runtime error checking, and defect tracking systems to improve the efficiency of your software development process
Supported Environments
• Sun SPARC workstations running SunOS 4.x
• Sun SPARC workstations running Solaris 2.3 through 2.6
• HP 9000 Series 700 workstations running HP-UX 9.0.x or 10.30
• HP 9000 Series 800 workstations running HP-UX 9.0.x or 10.30
B.6.2 Usability Measurement Tools
It is important to mention usability measurements as part of the test tool discussion. Automated tools that check for usability need to ensure that usability factors are properly incorporated into development life-cycle documentation, such as requirement specifications, analysis and design results, application prototypes, and on-line application help functionality.
B.6.2.1 ErgoLight
ErgoLight solutions include tools for specifying the user’s tasks, automatically logging the user’s actions, logging observer’s notes, on-line identification of operational difficulties, on-line solicitation of the user’s intentions, backtracking the user’s actions in sync with the user’s problems and with the observer’s notes, analysis decision making, and reporting. ErgoLight solutions integrate these tools in methodologies of software development, addressing the full development cycle, from product specification to development. The procedures that this tool automates support knowledge transfer from usability evaluators to team members who are in charge of functional specification, GUI design, user documentation, on-line assistance, and customer service. For more information on ErgoLight, see http://www.ergolight.co.il.
B.7 Testing Support Tools
B.7.1 Test Data Generators
TestBytes, a test data generator, is described here.
B.7.1.1 TestBytes
TestBytes is a test data generation tool for testing your data management application. It can generate data to populate SQL database servers and PC databases quickly, whether you need data for application functionality testing, data-driven testing, or performance load testing. For more information on the TestBytes product, see http://www.platinum.com/.
Features
• Generates meaningful test data and populates the target database automatically without the need to write scripts or a single line of code
• Creates masked data within a column, making it possible for users to specify profiles for segments of a field (that is, values for titles such as Mr. or Ms.), one or more digits of a ZIP code, or area codes
• Supports referential integrity either directly from the database or from an ERwin model
• Generates data to multiple tables with one click
• Supports key unification and relationship cardinality
• Enables developers and testers to communicate their test data generation needs through standard reports
• Generates optionally to flat files, creating separated and delimited files that can be used to populate databases with large amounts of data quickly and easily
• Allows the definition of flat file formats that are independent of your database table definitions
• Allows less technical QA and testing team members to be productive early in the testing cycle
• Supports 32-bit Windows environments with an ODBC-compliant database
System Requirements
• Windows NT or 95
• Minimum 24MB hard disk space
• 32 MB RAM
B.7.2 File Comparison Tools
B.7.2.1 EXDIFF
EXDIFF is the extended file differencing system that operates as a stand-alone product or as part of the fully integrated TestWorks/Regression multiplatform suite of testing tools. EXDIFF extends commonly available file comparison utilities by comparing files of various logical structures. These structures include not only ASCII and binary files, but also bitmap image files saved with either TestWorks/Regression’s capture/playback system (CAPBAK) or the standard X Window Dump utility (xwd). When used in conjunction with its TestWorks/Regression companion tools CAPBAK and SMARTS, the testing process is completely automated. For more information, see http://www.soft.com.
Supported Environments
• SPARC SunOS 4.1.3
• SPARC Solaris 2.3 through 2.6
• x86 Solaris 2.4 and 2.5
• RS/6000/AIX 3.2.5, 4.1.2, and 4.2
• HP 9000/7xx HP-UX 9.05 and 10.10
• HP 9000/8xx HP-UX 9.04, 10.01, and 10.10
• x86 SCO/ODT 2.0 and 5.0 (3.0)
• SGI Irix 5.3 and 6.2
• DEC-Alpha OSF1 3.2 and 4.0
• NCR 3000
• SCO/UnixWare 2.1.1
• Windows 3.x, NT, and 95
B.7.3 Simulation Tools
Simulation tools can be used to simulate application-under-test models, so as to examine what-if scenarios, which are useful in predicting performance under varying conditions. An example of a simulation tool is OPNET.
B.7.3.1 OPNET
OPNET is a decision support tool to provide insight into the performance and behavior of existing or proposed networks, systems, and processes. (OPNET and MIL 3 are registered trademarks of MIL 3, Inc.) Specific tools are included with each OPNET license that assist users through the following phases of the modeling and simulation cycle.
Model Building and Configuration
• Network Editor—define or change network topology models
• Node Editor—define or change data flow (systems architecture) models
• Process Editor—define or change control flow (behavioral logic) models
Running Simulations
• Simulation Tool—define and run simulation studies using models constructed with the OPNET editors
• Interactive Debugging Tool—interact with running simulations
Analyzing Results
• Analysis Tool—display and compare statistical results
• Animation Viewer—watch dynamic behavior of models during simulation runs
The OPNET Model Library is included with OPNET Modeler and OPNET Planner, and contains a comprehensive set of networking protocols and analysis environments. Sample models included in the library are
• Ethernet
• Fiber Distributed Data Interface (FDDI)
• Client-Server Analysis Environment
• Circuit Switched Network Analysis Environment
• Transmission Control Protocol (TCP)
• Internet Protocol (IP)
• Open Shortest Path First (OSPF)
• Asynchronous Transfer Mode (ATM)
• Frame Relay
• AMPS Cellular Telephone System
• Cellular Digital Packet Data (CDPD)
• LAN Emulation
Supported Hardware
• Hewlett-Packard 9000/7xx HPPA
• Sun Microsystems Sun-4 SPARC
• Various PC-compatible Intel Pentium (or compatible)
Supported Operating Systems
• HP-UX 10.20
• Solaris 2.5.1
• Windows NT 4.0, 95, and 98
B.8 Testing Phase
B.8.1 Test Management Tools
An example of a test management tool, TestStudio, is provided in Section B.8.3.1.
B.8.2 Network Testing Tools
NETClarity, a network testing tool, is described here.
B.8.2.1 NETClarity
The NETClarity suite of network performance management and diagnostic tools allows you, as the network manager, to monitor, measure, test, and diagnose performance across your entire network. The following products are available for network testing under the NETClarity suite. For more information on the NETClarity product suite, see http://www.lanquest.com/.
Network Checker+
This set of network diagnostic tools allows you to check any LAN/WAN segments and the Internet for delays and broken links remotely via its Web browser interface.
Features
• Check Network is a response time and availability test between the NETClarity server and all Sentry Agents installed thoughout the network to verify connects.
• Remote Trace Route finds all hops between NETClarity Sentry Agents or between NETClarity Sentry Agents and a host/IP address on the Internet.
• Path Integrity Test sends a wide range of IP packet types between NETClarity Server and all Sentry Agents to verify path and successful transmission of data.
Remote Analyzer Probe
• Use a remote protocol analyzer probe
• Install remotes on Standard NT PCs
• Capture traces in Sniffer file format
• Use a browser to transfer trace files to the protocol analyzer
Server Requirements
• 200MHz Pentium computer
• 64MB RAM
• 1 GB hard disk space
• CD-ROM drive
• 10 Base-T, 100 Base-T, or Gigabit Ethernet NIC
• Windows NT 4.0 SP3
Sentry Agent Requirements
• Nondedicated 133MHz Pentium computer
• 32MB RAM
• 10MB hard disk space
• 10 Base-T, 100 Base-T, or Gigabit Ethernet NIC
• Windows NT 4.0 SP3
B.8.3 GUI Application Testing Tools
An example of a GUI application test tool is provided below.
B.8.3.1 Rational Suite TestStudio
Rational’s TestStudio is an automated GUI client-server test suite that provides integrated programming and testing tools to simplify the creation of components and to replace expensive, tedious, and error-prone manual testing, resulting in higher-quality applications in less time with lower risk. This product can be used throughout the development process to create components more efficiently and to verify that the components work together properly when part of a complete application, that the resulting systems execute reliably, and that the system offers its users the intended level of performance. This suite includes requirements management; tools for testing Web and client-server application functionality, reliability, and application performance; defect tracking; system-wide reporting; and a knowledge base of software development best practices. The company that makes this product, Rational Software, has integrated solutions supporting a wide range of languages and platforms [8].
TestStudio is a seamlessly integrated product suite that includes Rational Robot, TestFactory, TestManager, RequisitePro, and ClearQuest for the automated testing of cross-Windows client-server applications.
TestManager
This component lets you plan, manage, and analyze all aspects of testing cross-Windows client-server applications. This module accesses defect tracking, requirements tracking, testing progress reports, and other tools need to track test progress.
Rational Robot
Rational Robot lets you create, modify, and run automated tests on Web and cross-Windows client-server applications. This test automation solution offers reusability and portability of test recordings across Windows platforms to provide one recording that plays back on all Windows platforms. The record and playback feature of the scripts gives you much flexibility during the test script development stage. The scripts use a Visual Basic–like language.
Example of Usage
• The user interface could be employed to enter a user name, address, phone number, age, and sex.
• The application has a Visual Basic front end that gets input from users.
• The application has a SQL Server back end.
• Add, edit, and update options are available on each user screen.
Benefits
A well-integrated suite touches on most of the test cycle. As Rational Software has aggressively sought to acquire and integrate different tools that aid in the test cycle, you can concentrate on tasks that require your intervention (such as designing new tests for changing requirements). Tracking the test requirements can begin during the requirements definition phase. Any issues or defects that are identified during this phase can be tracked using the defect tracker. This approach familiarizes the team with the defect tracker, which will be used extensively during the test cycle.
Use Rational Robot during unit testing. It forces the developer to test his or her modules thoroughly and aids in partially developing the scripts that can be used during testing. This action forces the development team to be a part of the test team and not to question the use of automated tools during the testing phase. The built-in reports that are provided with TestStudio aids in tracking the progress of the testing cycle. They also show how each team member is performing and identify the members who are overworked.
Other benefits of TestStudio include the following:
• Flexibility of the scripting language. The TestStudio scripting language is very close to Microsoft Visual Basic. There is also an option when you install the software to create test scripts in Visual Basic. It enhances your flexibility because of the popularity of Visual Basic.
• Complexity of the scripting language. The record and playback feature generates the script automatically. The user can also add programming logic to make intelligent scripts. The script language is as robust as any programming language. This feature helps in creating custom solutions for testing software that should conform to standards.
• Compatibility with your current software and future integration. This tool is compatible with a wide variety of software, including Java, PowerBuilder, Visual Basic, Oracle Developer/2000, SAP, and PeopleTools.
• Tool performance over a network and sharing of the tool across networks among team members. TestStudio is designed to work over a network. The choice of database for repository (where all of the test information is stored) is limited to either Microsoft Access or SQL Server. Microsoft Access is best suited for small teams on a LAN, whereas SQL Server is a perfect option for larger teams that need to share testing information on a server.
• Clear and concise reporting and tracking of errors. A defect tracking system is built into the TestStudio. It is easy to use and offers different levels of security to control the access of information. This feature will help in managing the errors and monitoring the progress of your testing effort. There are also many canned reports that help you communicate your testing efforts to management, as well as graphs and charts for visual reporting.
Hardware and Software Requirements
• PC-compatible with 486 processor (Pentium recommended)
• 130MB hard disk space (minimum)
• 139MB + 20MB free space (including all sample applications)
• Microsoft Windows NT 4.0 (service pack 3), 95, or 98
B.8.3.2 AutoScriptor Inferno
AutoScriptor Inferno is a nonintrusive, hardware-assisted, automated software test system for PC-based stand-alone and client-server applications. This comprehensive test system is designed to automate the unattended testing of multiple operating systems and environments with a single, unique solution. AutoScriptor Inferno tests both GUI and character applications running under any PC, network computer, or Macintosh operating system. For more information on AutoScriptor Inferno, visit, http://www.asitest.com.
By separating the testing software from the system under test (SUT), AutoScriptor Inferno is able to support the testing of any application running under any operating system without loading any special drivers or code on the SUT. This task is accomplished by connecting the SUT to the Inferno test system box. The AutoScriptor Inferno system is connected to each client (SUT) machine via the keyboard, mouse, and monitor. The AutoScriptor Inferno hardware consists of an external box that resides near each target machine. This external box intercepts the keyboard, mouse, and video of the target, permitting its simulation by a human test engineer.
In the capture (recording) phase, the test engineer exercises the AUT based on the system test plan. The Inferno test system captures keystrokes and mouse movements; the answers from the system, such as screen contents, are captured as well. This information is stored in an ANSI C++-based test script. In the subsequent playback (execution) phase, the test script is executed on one or many clients directed over a network by the multiuser AutoScriptor Inferno Dashboard application. During playback execution, all application responses are captured and the true performance of the SUT is accurately measured. This phase runs unattended and automatically synchronizes to the AUT.
The power of AutoScriptor Inferno lies in its ability to capture reusable graphical objects (icons, push buttons, menu items, list boxes, hypertext links, and so on) and share them throughout all test cases. Either while recording or when the system is off-line, patterns can be captured, updated, or replaced. These patterns are stored in user-definable directory structures and can then be reused when recording future scripts. This technology drastically reduces the time spent on test script maintenance and allows for cross-platform script portability.
AutoScriptor Inferno communicates via a standard network connection enabling multiuser test playback across numerous client machines. It can support an unlimited number of simultaneous clients. One test scenario can control the same test or different tests on each client machine that is connected to the AutoScriptor Inferno test system. Multiuser testing is critical for network-based applications where stress, load, and performance testing are critical to success.
Changes in computer hardware, network versions, and operating systems can cause unexpected compatibility problems with existing hardware and software. Prior to a production rollout of a new application to a large numbers of users, AutoScriptor Inferno provides a clean method of ensuring that these changes will not adversely affect current applications and operating environments.
Nonstandard PC-based, network computer, and Macintosh operating systems such as NextStep, PC Solaris, GEOS, QNX, VENIX, Linux, PSOS, and MacOS are not supported by most software test tool vendors. In contrast, all of these operating systems and more are fully supported by AutoScriptor Inferno. This product works with Windows 3.x, 95, 98, and NT 3.x through 5.0, as well as QNX, DOS, Geoworks, OS/2, UNIX, NextStep, JavaOS, NCOS, MacOS, and other proprietary operating systems. Any Internet/intranet-based application is fully supported, including hyperlink verification and Java applet testing. Any application that resides on a PC, Mac, or network computer can be automated with AutoScriptor Inferno.
B.8.4 Load/Performance Testing Tools
Examples of load and performance testing tools are provided in this section.
B.8.4.1 PerformanceStudio
Rational Software’s PerformanceStudio offers a method for load, stress, and multiuser testing of e-commerce, ERP, and Windows client-server applications. This automated network test tool for Windows allows complete multiple-machine test synchronization without programming. PerformanceStudio lets you test 32-bit and 16-bit Windows NT and Windows 95 client-server applications and 16-bit Windows 3.x client-server applications.
PerformanceStudio is fully integrated with TestStudio (see Section B.8.3.1). It also includes Web server testing. With powerful new features such as virtual user testing, DataSmart Recording, ClientSmart Pacing, LoadSmart Scheduling, ServerSmart Playback, and HTTP class error collection and analysis, PerformanceStudio provides the easiest and fastest method of ensuring the quality of your HTTP Web servers. PerformanceStudio also continues to provide the industry’s only solution for complete cross-Windows testing by enabling you to test 32-bit Windows NT and Windows 95 client-server applications. Offering seamless integration with all the products in TestStudio, PerformanceStudio provides the easiest and most powerful method of ensuring that your Windows client-server and HTTP Web server applications are business-ready before deployment [9].
Features
• DataSmart Recording automatically generates parameterized scripta and randomized test data without programming.
• ClientSmart Pacing automatically maintains accurate user emulation timing during playback to provide meaningful, controlled test results.
• LoadSmart Scheduling models complex usage scenarios without programming.
• ServerSmart Playback automatically verifies server-under-test responses to ensure valid load.
• The 100% Visual Interface creates powerful client-server multimachine tests quickly and easily through a point-and-click interface; no programming is required.
• Comprehensive graphing and analysis allows you to graph any performance metric for in-depth analysis of test results.
• The Performance-metrics database accumulates statistical information across multiple test runs.
• User-defined standard graphs allow you to define your own graphs as default templates to create a reusable, standard analysis across projects.
• Multimachine synchronization allows you to use intermachine scheduling options, including delays, iterations, wait-for-machine, and more, to test sophisticated multiuser scenarios in your application.
• Automatic resource monitoring monitors every agent machine’s resources automatically—for example, memory and disk space—for powerful stress and configuration testing.
Load Testing
Load testing is the process of running a number of client machines simultaneously to “load” your client-server system and measure response times. It typically involves creating various scenarios to analyze how your client-server system responds under various loads. You must be able to easily control the starting and stopping of many machines at once, and precisely time the effects of each.
PerformanceStudio provides all the information you need to analyze your load tests. It reports automatically calculate statistics for elapsed times, including minimums, maximums, and averages. PerformanceStudio graphics provide rapid visual analysis of how the response times of different parts of your application vary with the number of users. This information gives you an indication of how your client-server application will perform when loaded end-to-end.
Stress Testing
Stress testing is the process of running your client machines in high-stress scenarios to see whether they “break.” Examples of stress conditions include running a client application for many hours continuously, running a large number of iterations of a test procedure, or running a large number of different test procedures. Stress testing is important for ensuring that your client application will be able to handle production conditions, where the ineffective management of machine resources can result in system crashes.
PerformanceStudio makes stress testing easy, yet powerful, through its automatic machine resource monitoring feature. By simply selecting which resources to test, this tool automatically monitors machine resources such as USER, GDI, global memory, DOS memory, free file handles, and disk space on every agent machine. Combined with Performance Studio’s ability to iterate a test procedure thousands of times, automatic resource monitoring provides a method of measuring the stress that an application places on a client.
You’ll quickly spot any client-side resource management problems with the information generated by PerformanceStudio. For example, reports will indicate which machines fail and when. Graphics highlight trends in resource usage to help you quickly detect common errors such as memory leaks and excess consumption of system resources and disk space.
Multiuser Testing
Multiuser testing is the process of running multiple machines simultaneously to simulate the application workflow of a client-server system. For example, you might synchronize multiple stations so they access the same record in a database to check for problems with locking, deadlock conditions, concurrency controls, and more. Multiuser tests are typically difficult to do manually because they require precise synchronization between users.
PerformanceStudio’s multimachine synchronization lets you easily define test scenarios in which test stations wait for conditions to be satisfied before they continue. For example, you can have one station add a record to a database, and have the next station wait to read the record until the first station has completed its task. With PerformanceStudio, multimachine synchronization is easy and powerful, and can be accomplished through PerformanceStudio’s point-and-click interface without any programming.
You’ll be able to spot any multiuser problems in your client-server application through the results displayed in the PerformanceStudio Test Log Viewer and automatically generated reports. PerformanceStudio’s reports will help you identify machines that experience inordinate delays or “hang” indefinitely due to deadlock conditions. The Test Log Viewer’s color-coded display will highlight any functional problems arising from errors in shared data or database updates. This feature will help you ensure your client-server application operates properly when multiple users are running it.
Configuration Testing
Configuration testing lets you determine how your client-server application works on different machines. For example, you can run the same set of tests simultaneously on many test stations with different hardware and software configurations. You can also measure the response times of each station to determine the minimal and optimal configurations for your client machines. This consideration is important because incompatible software, insufficient memory, or too-slow processor speed may cause your application to crash.
With PerformanceStudio, you can validate the operation of your client-server application on a variety of client machines at the same time. By assigning the same test to a number of different client machines, you can determine how each part of your application performs on each machine. In addition, you can use the automatic resource monitoring capabilities of PerformanceStudio as a powerful method of configuration testing.
For example, you’ll quickly be able to determine how well and how fast your client-server application runs on different client machines. The reports in PerformanceStudio include statistics about the elapsed times of each test procedure on each machine. Graphics help you visually compare the performance of all your test stations. In addition, PerformanceStudio’s graphics will highlight any resource management problems that you may have on specific client configurations. With PerformanceStudio, it is easy to determine which machines are best suited for your client-server application.
With a recording agent, PerformanceStudio captures user activities—including keystrokes, mouse movements, and SQL requests—to automatically generate scripts that represent a realistic multiuser load. Using one driver machine to simulate as many as thousands of users, PerformanceStudio reveals an application’s true behavior, including any performance bottlenecks that emerge during the application development process. Problems induced by multiuser load can then be fixed prior to deployment. PerformanceStudio is available for testing client-server, Web-enabled, and ERP applications.
PerformanceStudio’s recording technology saves time in other ways as well. Because user transactions are captured or freeze-framed, there is no human intervention and, therefore, no margin for error.
Benefits
• Fully automated recording of scripts
• Accurate, clear, and concise script generation
• Efficient reporting tools that quantify response time and throughput within seconds following a test
• Extensive monitoring tools to track and debug scripts during tests
• Complete documentation, including a reference manual with script commands and a user guide
• Options to test client and server separately or simultaneously
• Ability to add looping, branching, and randomization to scripts
• Simulated think time, typing time, and mouse delays
• Dynamic adjustment of throughput during test execution to model all types of user loads
• Multiple scripts that read data from a common set of input files
• Centralization control and synchronization, including launching, stopping, tracking, and synchronizing while collecting performance data and monitoring the application
• Full synchronization of scripts, passing of data among scripts, and queuing of scripts when entering critical regions
• Access to data returned from the AUT
• Ability to drive the client and the server from the same script
• Script execution that utilizes minimal driver resources to allow emulation of many users from small driver machines
• Easy-to-learn, simplified interface
• SQL recording in client-server scripts that is embedded in high-level script statements
B.8.5 Web Testing Tools
An example of a Web test tool is provided in this section.
B.8.5.1 Silk Tools
The Silk family of Web testing tools consists of SilkTest, SilkPerformer, and Surf! This automated software testing tool suite is specifically designed to meet the challenges of testing Web applications [10]. For more information concerning the Silk family of Web testing tools, see http://www.segue.com/.
SilkTest uses Segue’s Universal Testing Architecture to offer functional and regression testing to ensure the reliability of both Internet and intranet applications. SilkPerformer simulates real-world Web traffic to measure the capacity and scalability of a Web server. By gauging server performance, you can predict and tune the overall performance of your Web applications before they deploy. Surf! automatically tests applications developed for both intranets and the World Wide Web. You can use Surf! to automatically generate functional regression tests to validate all links in Web applications—without any recording or coding.
SilkTest Features
• Test the mix of technologies commonly found in Web applications (Java applets, HTML, ActiveX, images, and more). SilkTest is not tied to any vendor API, so the SilkTest scripts can be reused as more technologies are adopted.
• Test applications that run in multiple browsers. Universally accessible Web applications run under multiple and increasingly dissimilar browsers, and must be tested in each environment. A single SilkTest script can be used to test the Web application under multiple browsers (Netscape Navigator, Microsoft Internet Explorer, and so on).
• Test the entire Web application. SilkTest scripts drive clients and servers—Web, database, and application—from a central point of control, even when they are on entirely different platforms. This feature gives you an accurate picture of how your system components perform together.
• Automate the testing process. The need to test as many as possible access methods and scenarios dramatically increases testing complexity and the amount of testing that must be done—making automated testing the only viable alternative for Web applications.
SilkPerformer Features
• Simulate real-world traffic to measure true Web server capacity and avoid performance problems
• Validate performance and scalability requirements in your Web application to minimize software risk
• Predict Web server bottlenecks and problems before your application deploys to ensure the reliability of your software
• Pinpoint errors and report testing results
• Retest performance improvements without the cost and effort of completely rebuilding your Web application
• Ensure end-to-end software performance and reliability of Web application with a fully integrated test tool suite
Hardware and Software Requirements
• Windows NT 4.0 and 95
• Pentium or better
• Any browser or Internet/intranet application using standard Internet protocols
B.8.6 Year 2000 Testing Tools
It is difficult for an organization to test all of its software for year 2000 compliance with a single tool. Many Y2K testing tools are on the market. This section describes two tools that support common platforms and Y2K testing.
B.8.6.1 DiscoverY2K
DiscoverY2K is an end-to-end solution for managing year 2000 compliance projects for client-server applications. Leveraging the Discover system (see Section B.5.4.2), DiscoverY2K enables companies to complete their year 2000 software conversion efforts for a fraction of the cost and time than would otherwise be possible. With its robust audit trail capability and its ability to offer rapid assessment and change, DiscoverY2K also provides a powerful insurance policy and backup plan, post-millennium, to minimize potential year 2000 liability.
DiscoverY2K provides software development organizations with the technology to assess the full scope of the year 2000 problem, understand the effect of this noncompliance, execute the necessary changes, and test the applications. It supports any conversion methodology chosen by the customer and addresses all four phases of the conversion: asset inventory, impact analysis, remediation, and testing.
Software Emancipation’s DiscoverY2K/SET is a development information system that, when used across an entire development organization, allows teams to rapidly evolve, reengineer, and reuse legacy software. It consists of four components: Y2K Base, Y2K TPM Filter, Y2K TaskFlow, and Y2K Trace.
Supported Platforms/Operating Systems
• Solaris
• HP-UX
• SGI IRIX
• Windows NT
Supported Languages
• ANSI C/C++
• K&R C
• Visual C++
• VAX C
• Oracle Embedded SQL
• Java
• PL/SQL
B.9 Other Test Tool Vendors
This appendix lists only a few of the many tools available on the market today. For further detail on the various test tools, see product vendor Web sites or visit http://www.methods-tools.com.
Software Quality Engineering (800-423-8378; [email protected]; http://www.sqe.com) sells an extensive survey of test tools.
Revision Labs publishes A Guide to Automated Testing Tools, which contains information on over 30 different capture/replay tools. (http://www.revlabs.com).
Ovum Ltd. publishes and sells a large number of reports on a wide range of computing and communications technology topics, including testing tools. ([email protected]; http://www.ovum.com; Compuserve: MHS:INFO@OVUM).
Rodney C. Wilson, UNIX Test Tools and Benchmarks (Prentice Hall, 1995, ISBN 0-13-125634-3) is a primer on testing and tools to help with the task.
References
2. Oberg, R., Probasco, L., Ericsson, M. Applying Requirements Management with Use Cases. Rational Software Corporation, 1998.
3. Poston, R. “A Guided Tour of Software Testing Tools.” www.aonix.com.
4. See note 1.
5. See note 1.
6. See note 1.
7. See note 1.
8. See note 1.
9. See note 1.
10. http://www.segue.com.