
CHAPTER 10
Monitoring
We use automation to configure systems and applications in accordance with our wishes. In a perfect world, we would automate all changes to our hosts, and at the end of the workday, we would go home and not have to do any work again until the next morning. SAs will be the first to tell you that the world isn't perfect. Disk drives fill up; power supplies fail; CPUs overheat; software has bugs; and all manner of issues crop up that cause hosts and applications to fail. System and service monitoring is automation's companion tool, used to notify us when systems and applications fail to operate properly.
Right now, we are unaware of any hardware or software problems in our example environment. There are many key failure situations that administrators wish to know about immediately. Some of these are
- When a host is unreachable on the network
- When a network application fails (e.g., the Apache instance for our public web site doesn't serve content properly)
- When an important process is not running on a system
- When resources are overutilized (e.g., high system load, high CPU utilization, and low disk space)
Without an automated mechanism to detect these situations and notify the administrator, problem notification will be performed by users or even customers! The problem (or problems) might have been going on for an extended period of time before the administrator is alerted, which is embarrassing for the administrator and, when reported by a customer, embarrassing for the business as a whole. Clearly, we need a better solution than relying on users or waiting for the administrators to notice anomalies during the normal course of their work.
Aside from immediate errors or failures, we'd like to be aware of general trends in the performance and resource utilization of our systems. We don't want to find out that we lack sufficient CPU capacity for our public web site when the CPU utilization exceeds 95 percent and rarely comes down! Conversely, we don't want to receive an automated notification every time the CPU utilization exceeds a much lower percentage as a sort of early warning system—this will result in excessive alerts and isn't even an accurate indication of insufficient CPU capacity. Instead, we would like a way to visualize resource utilization trends over time, which allows us to make a prediction about utilization levels in the future. Armed with this information, we can deploy additional systems or install hardware upgrades before they are needed.
An entire software industry exists around automated system and network monitoring, and many open source programs exist as well. We are fortunate that some very high-quality open source monitoring software exists. We will focus on open source monitoring software in this chapter, and we believe that our choices will scale with your environment as it grows.
We have chosen Nagios for our system and service monitoring system. Nagios is flexible and mature, and help is widely available on Internet mailing lists and newsgroups. We feel that we are leaving you in good hands with Nagios once you've completed this chapter.
We have chosen Ganglia for system resource visualization. Ganglia was developed for monitoring large-scale clusters, and we have found it to be very easy to work with. It is also very flexible and should be able to support any custom system graphing required at your site.
As with automation systems, work is always being done on a site's monitoring systems. Applications and hosts are added; applications change and need to be monitored differently; hosts fail permanently; and critical thresholds change. You need to know your monitoring systems inside and out, both the monitoring software itself as well as exactly what is being monitored at your site.
Nagios
Nagios is a system and network monitoring application. It is used to monitor network client/server applications such as POP, HTTP, and SMTP, as well as host resource utilization such as disk and CPU usage. Users usually interact with it though an optional web interface included with the source distribution.
Here is the list of features as documented on www.nagios.org:
- Monitoring of network services (SMTP, POP3, HTTP, NNTP, PING, etc.)
- Monitoring of host resources (processor load, disk usage, etc.)
- Simple plug-in design that allows users to easily develop their own service checks
- Parallelized service checks
- Ability to define network host hierarchy using "parent" hosts, allowing detection of and distinction between hosts that are down and those that are unreachable
- Contact notifications when service or host problems occur and get resolved (via e-mail, pager, or user-defined method)
- Ability to define event handlers to be run during service or host events for proactive problem resolution
- Automatic log file rotation
- Support for implementing redundant monitoring hosts
- Optional web interface for viewing current network status, notification and problem history, log file, and so on
Nagios is widely used and has an active user community. Good support is available on Internet mailing lists and on the http://www.nagios.org web site. Also, several books are available on the subject, and one of our favorites is Building a Monitoring Infrastructure with Nagios by David Josephsen (Prentice Hall, 2007). We like it because it focuses not just on the Nagios application itself but also on real-world monitoring scenarios. We also recommend Pro Nagios 2.0 by James Turnbull (Apress, 2006). Both books cover Nagios version 2 but the majority of the content still applies, as does the good advice from each on general monitoring system design.
With many of the applications deployed so far in our example environment, the whirlwind introduction that we provide is enough to give you a good understanding of the software and technologies you're deploying. Nagios is different in that it will definitely require further reading and experimentation on your part. We encourage you to use Nagios, and we provide a working configuration to get it up and running quickly at your site so that you can leverage its feature set. In order to make full use of it, though, you will need to learn more about it on your own.
Nagios Components
Before we go deeply into the configuration of Nagios, we will explain the different parts of the monitoring system that we're going to deploy. The Nagios program itself is only one part of our overall monitoring system. There are four components:
- The Nagios plug-ins are utilities designed to be executed by Nagios to report on the status of hosts or services. A standard set of open source plug-ins is available at the http://www.nagios.org web site, and many additional plug-ins are freely available on the web. Extending Nagios through the use of custom plug-ins is simple, easy, and encouraged.
- The Nagios daemon is a scheduler for plug-ins that perform service and host checks.
- The web interface is a set of Common Gateway Interface (CGI) programs that are included in the Nagios source distribution. The CGI interface is completely optional, but it is extremely useful, and we consider it a mandatory part of a complete monitoring infrastructure.
- Remote plug-in execution via the Nagios Remote Plug-in Executor (NRPE) is also provided. In order to check local system resources on remote hosts, a mechanism for remote checking is needed. Some sites utilize Simple Network Management Protocol (SNMP) agents for this purpose. The NRPE add-on to Nagios is available at the http://www.nagios.org web site and is designed for remote execution of Nagios plug-ins.
We will go into greater depth on the Nagios daemon itself in the next section. First, we want you to be aware that when administrators talk about Nagios, they're usually talking about all the parts that form the complete monitoring system, because every site is required to add plug-ins in order for Nagios to perform service/host checking at all, making for two monitoring system components right away. Most sites also deploy the Nagios web interface, along with a facility to check remote system resources (e.g., NRPE, SNMP, or the Nagios check_by_ssh add-on).
At our example site, we'll use Nagios to schedule plug-ins and handle notifications, plug-ins to perform host and service checks, NRPE to run plug-ins on remote hosts, and the Nagios CGI web interface to display status and to interact with users.
Nagios Overview
At its core, Nagios is simply a plug-in scheduling and execution program. The Nagios source distribution itself does not include monitoring scripts or programs, though an open source set of plug-ins is available for download from the Nagios web site. Through the use of plug-ins, Nagios becomes a true monitoring system, as the plug-ins check and report on the availability of hosts and services. Nagios really only understands that exit codes from plug-ins dictate the actions it takes.
Nagios has four types of configuration files:
- The main configuration file is
nagios.conf. This file contains settings and directives that affect the Nagios daemon itself, as well as the CGI programs. These are settings such as log file locations, whether or not notifications are globally enabled, and so on. This file doesn't directly set up any monitored services. - Resource file(s) are used to define macros (i.e., strings that are replaced at runtime by the Nagios daemon with the values defined in the resource file). These are used to abstract the locations of plug-ins, as well as to store private information such as passwords. The contents of these files won't be exposed to the CGI programs; therefore, the files can be protected with restrictive file permissions.
- You will spend most of your time in the object definition files. These files define hosts, hostgroups, contacts, services to be monitored, commands used for service and host checks, and more. The sample configuration that we put in place when we build Nagios will automatically configure object definitions to monitor the monitoring host itself. We will add further definitions to monitor the hosts and services on our network.
- The CGI configuration file, obviously, configures the CGI (web interface) programs. It contains a reference to the main configuration file, so that the Nagios daemon configuration and object definition file locations made available to the CGI programs.
The example Nagios configuration from the source distribution (as installed by make install-config later in this chapter) uses different files to store different parts of its configuration. We use this same approach in our cfengine configuration files, and it leads to easier comprehension and debugging once the files grow large. We use the cfg_dir directive in the main Nagios configuration file (nagios.conf) to include all files with a .cfg suffix in a specified directory as object definition files. The cfg_dir directive also recursively includes .cfg files in all subdirectories.
Nagios uses templates to implement object inheritance. This allows us to define default settings for objects that can be overridden as needed in host and service definitions. The Nagios example configuration makes use of templates, so we'll already be utilizing them when we get our Nagios installation up and running.
The fundamental building blocks in the Nagios configuration files are host and service definitions. Each is defined as a Nagios object. Host and service definitions are just two examples of the several types of objects.
Here is the complete list of Nagios object types:
- Hosts: Hosts contain definitions of hosts or devices. These are usually physical machines, but they might be virtual systems as well. Nagios doesn't know or care about the difference.
- Hostgroups: These define one or more hosts and are primarily used to organize and simplify the service definitions, as well as the Nagios web interface.
- Services: Service objects define a service running on a host (e.g., the HTTP service running on a web server).
- Service groups: These objects define one or more services grouped together and are useful for organizing the Nagios web interface. Service groups are also useful (though still strictly optional) if you later decide to use Nagios notification escalation rules. We won't cover host and service notification escalation in this book, however.
- Contacts: This object defines the recipients of notifications (i.e., people to notify).
- Contact groups: Contact groups define groups of one or more contacts. Nagios objects that send notifications always reference contact groups.
- Time periods: These objects define blocks of time and are used by other definitions to determine when checks are run, notifications are sent, or blackout periods.
- Commands: These objects define command macros, which are used to send notifications and execute plug-ins.
The knowledge of Nagios object types, in tandem with the example configuration that we deploy later in this chapter should be enough to get you started with Nagios. Please pick up a good book on Nagios (we recommended two good books earlier in the chapter), join the nagios-users mailing list ([email protected]), and read the online documentation in order to build on your installation from the point where this book leaves off.
Deploying Nagios with cfengine
In this section, we move step by step through the process of building, configuring, and deploying Nagios using automation. We know how hard following such a process can be, so we're attempting to make it as easy on you as possible.
Steps in Deploying Our Nagios Framework
Many steps will be required to deploy a fully functional Nagios framework in an automated fashion. Here are the steps, in order:
- We add system user accounts to run the Nagios and NRPE programs.
- We build Nagios from source for Debian i686 and copy the programs to the cfengine master for later automated copying.
- We build the Nagios plug-ins for Debian i686, Red Hat i686, and Solaris SPARC and manually copy them to the cfengine master for later automated copying to clients.
- We manually copy the Nagios daemon startup script to the cfengine master for later automated copying to cfengine clients.
- We separate the Nagios program directory and configuration directory on the cfengine master so that our example site can easily support automated updates of only the Nagios binaries.
- We manually generate an SSL certificate for the Nagios web interface and copy it to the cfengine master for later automated copying to cfengine clients.
- We manually create the Apache virtual host configuration on the cfengine master, also for later automated copying to cfengine clients.
- We create the Nagios web interface authorization file and manually copy it to the cfengine master for later automated copying to cfengine clients.
- We create a cfengine task to copy files to our site's monitoring host:
- The core Nagios programs
- The directory containing the Nagios configuration files
- The Apache configuration file
- The Apache authorization file
- The Apache SSL certificate used for the Nagios web interface
- We configure a Nagios monitoring host role in cfengine using a class.
- We create a hostgroup file for the new monitoring host role in cfengine.
- We create a cfengine task to distribute the Nagios plug-ins to all platforms at our example site.
- We create a hostname in the DNS for the monitoring host.
- We modify the default localhost-only monitoring done by Nagios so that the monitoring host itself is properly monitored.
- We build NRPE for Debian i686, Red Hat i686, and Solaris SPARC.
- We create an NRPE configuration file for our site on the cfengine master, for later automated copying by cfengine clients.
- We create an NRPE start-up script on the cfengine master, for later automated copying by cfengine clients.
- We create a cfengine task to copy the NRPE programs, configuration file and start-up script to all hosts.
- We configure the host-based firewall on Red Hat to allow incoming NRPE connections and then copy the firewall configuration file via a cfengine task.
- We finally have a complete framework to work with: we add new host and service definitions to the Nagios configuration files on the cfengine master in order to monitor all the hosts at our site.
There are 20 steps required just to set up Nagios! This is probably the most difficult chapter in this book to follow. When describing the cfengine configurations in this chapter, we will focus on the results in regard to setting up Nagios. The actions taken in cfengine should be quite familiar to you by now; they consist mainly of copy, shellcommands, links, and processes actions.
Step 1: Creating User Accounts
Using dedicated user accounts for daemons on UNIX systems is good practice. First, you want the daemon to run as a nonroot user so that security vulnerabilities don't grant immediate root privileges to attackers. Second, you want the compromise of one daemon to only affect the files writeable by that user and for any investigation to point quickly back to the daemon at fault. If the same user account is used for many daemons, it could be harder to determine the program that was compromised by an attacker.
We'll use our existing internal web server host named etchlamp as our monitoring host. First, create the needed user and groups manually on etchlamp (which is running Debian 4.0 on the i686 platform) as the root user:
# adduser --system --group --no-create-home nagios

# /usr/sbin/groupadd nagcmd

# /usr/sbin/usermod -G nagcmd nagios

# /usr/sbin/usermod -G nagcmd www-data
We added the account file entries for the nagios user to the master Debian, Red Hat, and Solaris shadow, passwd, and group files on the cfengine master (in PROD/repl/root/etc/), and we added the nagcmd group entry to the group files for all three platforms.
Step 2: Building Nagios
The next step was to download the stable version of Nagios from http://www.nagios.org/download/. At the time of this writing, the latest stable Nagios version is 3.03. Once downloaded, we had to untar and ungzip it and then build it as follows:
# wget http://voxel.dl.sourceforge.net/sourceforge/nagios/nagios-3.0.3.tar.gz

# tar zxf nagios-3.0.3.tar.gz

# cd nagios-3.0.3

# ./configure --with-command-group=nagcmd --prefix=/usr/pkg/nagios-3.0.3

# make all

# make install

# make install-init

# make install-config

# make install-commandmode

# make install-webconf

Password:

/usr/bin/install -c -m 644 sample-config/httpd.conf /etc/apache2/conf.d/nagios.conf


*** Nagios/Apache conf file installed ***
Building Nagios is rather easy, and it would be unusual to encounter any errors at build time because of the relative lack of compile-time dependencies. Now that we have built Nagios, we'll need to copy it to our cfengine master for later deployment:
# rsync -avze ssh /usr/pkg/nagios-3.0.3/

goldmaster:/var/lib/cfengine2/masterfiles/PROD/repl/root/usr/pkg/

nagios-3.0.3-debian.i686
Step 3: Building the Nagios Plug-ins
Now, we have Nagios compiled, but it won't be useful without plug-ins. To compile the Nagios plug-ins for Debian (i686), we ran these commands on a Debian 4.0 i686 system with a C development environment installed (the latest Nagios plug-ins version at the time of this writing is 1.4.12):
# wget

http://osdn.dl.sourceforge.net/sourceforge/nagiosplug/nagios-plugins-1.4.12.tar.gz

# tar zxf nagios-plugins-1.4.12.tar.gz

# cd nagios-plugins-1.4.12

# ./configure --with-nagios-user=nagios --with-nagios-group=nagios

--prefix=/usr/pkg/nagios-plugins-1.4.12 && make all &&  make install
Then, we copied the programs over to the cfengine master:
# rsync -avze ssh --progress /usr/pkg/nagios-plugins-1.4.12/

goldmaster:/var/lib/cfengine2/masterfiles/PROD/repl/root/usr/pkg/

nagios-plugins-1.4.12-debian.i686
So far, we only have the Nagios plug-ins for Debian (i686). We're going to need the plug-ins compiled for all platforms at our site for use with NRPE, covered later in this chapter. To compile the Nagios plug-ins for Red Hat (i686), we ran these commands on the rhmaster system, where we have a C development environment:
# wget

http://osdn.dl.sourceforge.net/sourceforge/nagiosplug/nagios-plugins-1.4.12.tar.gz

# tar zxf nagios-plugins-1.4.12.tar.gz

# cd nagios-plugins-1.4.12

# ./configure --with-nagios-user=nagios --with-nagios-group=nagios

--prefix=/usr/pkg/nagios-plugins-1.4.12 && make all && make install
Then, from the cfengine master, we copied the programs:
# hostname

goldmaster

# pwd

/var/lib/cfengine2/masterfiles/PROD/repl/root/usr/pkg

# rsync -avze ssh --progress

rhmaster:/usr/pkg/nagios-plugins-1.4.12/ nagios-plugins-1.4.12-redhat.i686
Now, all we have left is Solaris. To compile the Nagios plug-ins for Solaris 10 (SPARC), the procedure is the same, except that the untar and ungzip commands are different:
# wget

http://osdn.dl.sourceforge.net/sourceforge/nagiosplug/nagios-plugins-1.4.12.tar.gz

# gunzip -c nagios-plugins-1.4.12.tar.gz | tar xf -

# cd nagios-plugins-1.4.12

# ./configure --with-nagios-user=nagios --with-nagios-group=nagios

--prefix=/usr/pkg/nagios-plugins-1.4.12 &&  make all &&  make install
Again, we copied the programs over to the cfengine master:
# hostname

goldmaster

# pwd

/var/lib/cfengine2/masterfiles/PROD/repl/root/usr/pkg

# rsync -avze ssh --progress --rsync-path=/opt/csw/bin/rsync

aurora:/usr/pkg/nagios-plugins-1.4.12/ nagios-plugins-1.4.12-sunos.sun4u
Step 4: Copying the Nagios Start-up Script on the cfengine Master
Next, we created a directory named PROD/repl/root/init.d on the cfengine master and copied the init script from /etc/init.d/nagios on the system where we built Nagios for Debian into it (installed by the earlier make install-init command that we ran when building Nagios). We'll use cfengine to create the proper links in the /etc/rcX.d directories later in this chapter.
Step 5: Separating the Nagios Configuration Directory from the Program Directory
We'll place the Nagios daemon configuration files at PROD/repl/root/usr/pkg/nagios-conf by moving the etc directory up one directory level and into nagios-conf:
# pwd

/var/lib/cfengine2/masterfiles/PROD/repl/root/usr/pkg

# mv nagios-3.0.3/etc nagios-conf

# cd nagios-3.0.3/

# ln -s /usr/pkg/nagios-conf etc
The directory layout inside nagios-conf, as set up by the make install-config command in the Nagios source directory (which we ran earlier in the chapter), looks like this:
# pwd

/var/lib/cfengine2/masterfiles/PROD/repl/root/usr/pkg/nagios-conf

# ls -F

./  ../  cgi.cfg  htpasswd.users  nagios.cfg  objects/  resource.cfg

# ls -F objects/

./  ../  commands.cfg  contacts.cfg  localhost.cfg  printer.cfg switch.cfg

templates.cfg  timeperiods.cfg  windows.cfg
Notice the directory named objects: it is where the example configuration places all the Nagios objects used to configure monitored hosts and services. We'll continue to use this directory for the objects that we define.
While we're here in the Nagios configuration file directory, we'll modify the resource.cfg file. We need to change the $USER1$ line from this:
# Sets $USER1$ to be the path to the plug-ins

$USER1$=/usr/pkg/nagios-3.0.3/libexec
to this:
# Sets $USER1$ to be the path to the plug-ins

$USER1$=/usr/pkg/nagios-plugins/libexec
The $USER1$ macro sets the location of our Nagios plug-ins. We installed them to a directory outside of the main Nagios directory in step three, so we need to have Nagios look for them in the new directory.
Create the Nagios Web Interface Configuration Files
In this section, we'll cover steps six through eight, which are the creation of Apache configuration and authorization files and an SSL certificate.
Step 6: Generating an SSL Certificate for the Nagios Web Interface
We generated the SSL certificate for our Nagios web interface with this command (as the root user on the host etchlamp):
# /usr/sbin/make-ssl-cert /usr/share/ssl-cert/ssleay.cnf /etc/apache2/ssl/nagios.pem

# cd /etc/apache/ssl

# scp 5796a599 nagios.pem

goldmaster:/var/lib/cfengine2/masterfiles/PROD/repl/root/etc/apache2/ssl/
Note that, after generating the certificate, we copied it to the cfengine master. We will automate the distribution of this file using cfengine, as usual.
Step 7: Creating the Apache VirtualHost Configuration for the Nagios Web Interface
We'll need to configure Apache with the required directives to serve our Nagios web interface using the Nagios CGI programs. In addition, we need to make sure that authentication is used, since the Nagios web interface contains information we only want authorized staff to view and modify.
Modification operations are those that stop alerts for some or all systems, send manual alerts, or manually change the status of a host check. We want to protect the integrity of our Nagios framework by controlling access.
Here is our Apache configuration file, which we've placed on the cfengine master at the location PROD/repl/root/etc/apache2/sites-available/nagios.conf:
NameVirtualHost *:443


<VirtualHost *:443>

        ServerName     nagios.campin.net

        ServerAlias       nagios


        DocumentRoot   /var/www/

        ServerAdmin    [email protected]

        ErrorLog       /var/log/apache2/nagios-error.log

        CustomLog      /var/log/apache2/nagios-access.log combined


        SSLEngine on

        SSLCertificateFile /etc/apache2/ssl/nagios.pem


        ScriptAlias /nagios/cgi-bin "/usr/pkg/nagios/sbin"


        <Directory "/usr/pkg/nagios/sbin">

                SSLRequireSSL

                Options ExecCGI

                AllowOverride None

                Order allow,deny

                Allow from all

                AuthName "Nagios Access"

                AuthType Basic

                AuthUserFile /usr/pkg/nagios/etc/htpasswd.users

                Require valid-user

        </Directory>


        Alias /nagios "/usr/pkg/nagios/share"


        <Directory "/usr/pkg/nagios/share">

                SSLRequireSSL

                Options None

                AllowOverride None

                Order allow,deny

                Allow from all

                AuthName "Nagios Access"

                AuthType Basic

                AuthUserFile /usr/pkg/nagios/etc/htpasswd.users

                Require valid-user

        </Directory>

</VirtualHost>
We have been avoiding in-depth explanations of Apache configuration files, and we continue the trend here. Just be aware that you shouldn't remove the authentication requirements if you have trouble making user accounts work. Take the time to do it right. Protecting your monitoring web interface from unauthorized access is important.
Step 8: Create the Nagios Web Interface Authentication File
We created the Apache user authentication file on the same system (etchlamp), and copied it to the PROD/repl/root/usr/pkg/nagios-conf/ directory on the cfengine master:
# htpasswd -c /usr/pkg/nagios/etc/htpasswd.users nagiosadmin

New password:

Re-type new password:

Adding password for user nagiosadmin

# scp /usr/pkg/nagios/etc/htpasswd.users

goldmaster:/var/lib/cfengine2/masterfiles/PROD/repl/root/usr/pkg/nagios-conf/

root@goldmaster's password:

htpasswd.users                              100%   26    0.0KB/s    00:00
The nagiosadmin user is special, in that it will have all the required access to the Nagios web interface that you will require. Always create this user account.
Once you have Nagios up and running properly, read the online Nagios authentication documentation at the URL http://nagios.sourceforge.net/docs/3_0/cgiauth.html to learn to configure additional users.
Step 9: Copying the Nagios Daemon and Configuration Files with cfengine
In steps one through eight, we put together all the building blocks to set up a working Nagios instance. The bare minimum setup is in place:
- The Nagios daemon
- The Nagios plug-ins
- A web interface
We don't yet have everything that we will want in our final framework, but we do have everything that we need to automate the copy and setup of Nagios and the Nagios web interface to our monitoring server. We'll set that up now in cfengine.
First, we created the directory PROD/inputs/tasks/app/nagios on the cfengine master and put a task named cf.nagios_sync into it with these contents (explained section by section):
control:

        nagios_host::

                nagios_ver      = ( "nagios-3.0.3" )

       addinstallable = ( restart_nagios  restart_apache2 setup_nagios_rc_scripts )
First, we define a variable containing our current Nagios version. Using a variable in all the places that the version-specific directory name is needed will make it much easier to upgrade Nagios in the future. We'll only need to build the new version, place it on the cfengine master and update the variable in this task:
classes:  # synonym groups:

        nagios_host.i686::

                have_nagios_dir  = ( "/usr/bin/test -d /usr/pkg/$(nagios_ver)" )
Here, we set up a class based on the existence of the current Nagios directory to be used in the next section.
copy:

        nagios_host.debian.i686.!have_nagios_dir::

                $(master)/repl/root/usr/pkg/$(nagios_ver)-debian.i686

                                dest=/usr/pkg/$(nagios_ver)

                                r=inf

                                mode=755

                                owner=nagios

                                group=nagios

                                ignore=etc

                                exclude=etc

                                ignore=rw

                                exclude=rw

                                type=checksum

                                server=$(fileserver)

                                encrypt=true

                                define=restart_nagios
Here, we copy the Nagios programs when the directory meant to hold the current Nagios version doesn't already exist. This is done with the bang (!) class negation operator (i.e., !have_nagios_dir). The Nagios binaries were built for the Debian i686 platform, so we also make use of the debian and i686 classes to make sure that we only copy the binaries to the correct platform:
nagios_host.debian::

        $(master)/repl/root/usr/pkg/nagios-conf

                        dest=/usr/pkg/nagios-conf

                        mode=644

                        r=inf

                        owner=nagios

                        group=nagios

                        type=checksum

                        server=$(fileserver)

                        encrypt=true

                        define=restart_nagios

                        purge=true
Next, we copy the entire nagios-conf directory from the master to the client. We may end up deploying several versions of Nagios at once, but we'd like the path to the configuration files should always remain constant. This is easy to ensure when the configuration files are maintained separately from the programs themselves:
$(master)/repl/root/etc/init.d/nagios

                dest=/etc/init.d/nagios

                mode=755

                owner=root

                group=root

                type=checksum

                server=$(fileserver)

                encrypt=true

                define=setup_nagios_rc_scripts

                define=restart_nagios
After that, we copy the Nagios startup script into place. Later in this task, we'll create the proper symlinks in the /etc/rc?.d/ directories. Notice that two different classes are defined when the init script is copied into place. Both trigger actions later in the task, one is meant to restart Nagios since new start-up options may be in use (restart_nagios), and the other is meant to ensure that the start-up script symlinks are properly created (setup_nagios_rc_scripts):
$(master_etc)/apache2/sites-available/nagios.conf

                dest=/etc/apache2/sites-available/nagios.conf

                mode=444

                owner=root

                group=root

                type=checksum

                server=$(fileserver)

                encrypt=true

                define=restart_apache2


$(master_etc)/apache2/ssl/nagios.pem

                dest=/etc/apache2/ssl/nagios.pem

                mode=444

                owner=root

                group=root

                type=checksum

                server=$(fileserver)

                encrypt=true

                define=restart_apache2


$(master_etc)/apache2/ssl/5796a599

                dest=/etc/apache2/ssl/5796a599

                mode=444

                owner=root

                group=root

                type=checksum

                server=$(fileserver)

                encrypt=true

                define=restart_apache2
The three copies in the preceding code are used to place web interface files in place: the VirtualHost configuration for our Nagios web site and the SSL certificate we generated for nagios.campin.net:
shellcommands:

        debian.nagios_host.restart_nagios::

                "/etc/init.d/nagios restart" timeout=60 inform=true


        debian.nagios_host.restart_apache2::

                "/etc/init.d/apache2 restart" timeout=60 umask=022
The preceding restarts are triggered when configuration file or program file updates are made in earlier copy sections. We always want to put new configurations or programs into immediate use, and these shellcommands take care of that for us:
debian.nagios_host.setup_nagios_rc_scripts::

        # This is really only needed the first time Nagios is setup,

        # but this is a totally non-destructive command if run when the

        # links are already there. We are safe.

        "/usr/sbin/update-rc.d nagios start 30 2 3 4 5 . stop 70 0 1 6 ."

                timeout=60 umask=022
The preceding section bears a little explanation. We call the Debian update-rc.d utility which is used to create links in the /etc/rc?.d directories. We could add a list of symlinks to create in the cfengine configuration, but frankly, this is easier. The rest of the task follows:
directories:

        debian.i686.nagios_host::

                /usr/pkg/$(nagios_ver)/var/rw m=2775 owner=nagios

                           group=nagcmd inform=false
Here, we create a directory used by Nagios to store state information. It is critical that the ownership of the directory and permissions allow the user running the Nagios daemon to write files in it. We use cfengine to regularly ensure that this is the case.
processes:

        debian.nagios_host::


                "nagios" restart "/etc/init.d/nagios start" inform=true umask=022


                "/usr/sbin/apache2" restart "/etc/init.d/apache2 start"

                                           inform=true umask=022
These are simple process monitors that cause Apache and Nagios to be started up if they're not running on the nagios_host system. We'll define that class in cfengine in step ten.
links:

        debian.nagios_host::

                /usr/pkg/$(nagios_ver)/etc    ->! /usr/pkg/nagios-conf

                /usr/pkg/nagios                     ->! /usr/pkg/$(nagios_ver)

                /etc/apache2/sites-enabled/nagios.conf ->!

                                         /etc/apache2/sites-available/nagios.conf


                # the make-ssl-cert utility created this link when we created

                # nagios.pem, we'll preserve it using cfengine

                /etc/apache2/ssl/5796a599       ->! /etc/apache2/ssl/nagios.pem
This is the end of the cf.nagios_sync cfengine task. Notice that we're careful to copy the i686 binaries only to appropriate hosts by specifying the i686 class in the copy. It obviously wouldn't do any good to copy i686 Linux binaries to a Solaris SPARC system or a Debian x86-64 system (one without compatibility libraries), so we are defensive in our cfengine tasks and allow copies to happen only when conditions exactly match what we are expecting.
In the copy action in the preceding task, we copy the Nagios binaries only when the /usr/pkg/nagios-3.0.3 directory doesn't exist. We don't think there's any reason to regularly sync the files. If you're worried about something outside of cfengine changing those files, you could remove the !have_nagios_dir portion from the copy action and always enforce the proper directory contents.
Step 10: Configuring a Nagios Monitoring Host Role in cfengine
We're making the host etchlamp the nagios_host machine mentioned in the task in step nine, and to set it, we added this line to PROD/inputs/classes/cf.main_classes:
nagios_host = ( etchlamp )
Step 11: Creating a Hostgroup File for the Monitoring Host Role in cfengine
To complete our Nagios role configuration in cfengine, we added this line to PROD/inputs/hostgroups/cf.hostgroup_mappings:
nagios_host:: hostgroups/cf.nagios_host
Then, we created a file on the cfengine master at the location PROD/inputs/hostgroups/cf.nagios_host with these contents:
import:

        any::

                tasks/app/nagios/cf.nagios_sync
Step 12: Copying the Nagios Plug-ins with cfengine
We will handle the distribution of the Nagios plug-ins in a second task, which we will now describe. We created a task on the cfengine master at the location PROD/inputs/tasks/app/nagios/cf.nagios_plugins_sync with these contents (explained section by section):
control:

        any::

                plugins_ver   = ( "nagios-plugins-1.4.12" )
As we did in cf.nagios_sync, we use a variable to contain the version-specific directory name, which makes it extremely easy to deploy updates later on but still keep a copy of the previous build.
The rest of this task simply copies the proper plug-in binaries to each platform at our site and has special single file copies that enforce the setuid bit on binaries that require it (for execution with elevated system privileges).
copy:

        redhat.i686::

                $(master)/repl/root/usr/pkg/$(plugins_ver)-redhat.i686

                                dest=/usr/pkg/$(plugins_ver)

                                r=inf

                                mode=755

                                owner=nagios

                                group=nagios

                                ignore=rw

                                exclude=rw

                                type=checksum

                                purge=false

                                server=$(fileserver)

                                encrypt=true

                                exclude=check_dhcp

                                exclude=check_icmp


           $(master)/repl/root/usr/pkg/$(plugins_ver)-redhat.i686/libexec/check_dhcp

                                dest=/usr/pkg/$(plugins_ver)/libexec/check_dhcp

                                mode=4555

                                type=checksum

                                server=$(fileserver)

                                trustkey=true

                                encrypt=true

                                owner=root

                                group=root


           $(master)/repl/root/usr/pkg/$(plugins_ver)-redhat.i686/libexec/check_icmp

                                dest=/usr/pkg/$(plugins_ver)/libexec/check_icmp

                                mode=4555

                                type=checksum

                                server=$(fileserver)

                                trustkey=true

                                encrypt=true

                                owner=root

                                group=root


        debian.i686::

                $(master)/repl/root/usr/pkg/$(plugins_ver)-debian.i686

                                dest=/usr/pkg/$(plugins_ver)

                                r=inf

                                mode=755

                                owner=nagios

                                group=nagios

                                ignore=rw

                                exclude=rw

                                type=checksum

                                purge=false

                                server=$(fileserver)

                                encrypt=true

                                exclude=check_dhcp

                                exclude=check_icmp


           $(master)/repl/root/usr/pkg/$(plugins_ver)-debian.i686/libexec/check_dhcp

                                dest=/usr/pkg/$(plugins_ver)/libexec/check_dhcp

                                mode=4555

                                type=checksum

                                server=$(fileserver)

                                trustkey=true

                                encrypt=true

                                owner=root

                                group=root


           $(master)/repl/root/usr/pkg/$(plugins_ver)-debian.i686/libexec/check_icmp

                                dest=/usr/pkg/$(plugins_ver)/libexec/check_icmp

                                mode=4555

                                type=checksum

                                server=$(fileserver)

                                trustkey=true

                                encrypt=true

                                owner=root

                                group=root


        sunos_sun4u::

                $(master)/repl/root/usr/pkg/$(plugins_ver)-sunos.sun4u

                                dest=/usr/pkg/$(plugins_ver)

                                r=inf

                                mode=755

                                owner=nagios

                                group=nagios

                                ignore=rw

                                exclude=rw

                                type=checksum

                                purge=false

                                server=$(fileserver)

                                encrypt=true

                                exclude=check_dhcp

                                exclude=check_icmp

                                exclude=pst3


           $(master)/repl/root/usr/pkg/$(plugins_ver)-sunos.sun4u/libexec/check_dhcp

                                dest=/usr/pkg/$(plugins_ver)/libexec/check_dhcp

                                mode=4555

                                type=checksum

                                server=$(fileserver)

                                trustkey=true

                                encrypt=true

                                owner=root

                                group=root


           $(master)/repl/root/usr/pkg/$(plugins_ver)-sunos.sun4u/libexec/check_icmp

                                dest=/usr/pkg/$(plugins_ver)/libexec/check_icmp

                                mode=4555

                                type=checksum

                                server=$(fileserver)

                                trustkey=true

                                encrypt=true

                                owner=root

                                group=root


                $(master)/repl/root/usr/pkg/$(plugins_ver)-sunos.sun4u/libexec/pst3

                                dest=/usr/pkg/$(plugins_ver)/libexec/pst3

                                mode=4555

                                type=checksum

                                server=$(fileserver)

                                trustkey=true

                                encrypt=true

                                owner=root

                                group=root


links:

        any::

                /usr/pkg/nagios-plugins ->! /usr/pkg/$(plugins_ver)
We use the plugins_ver variable in this task to create version-specific directories on our hosts and have cfengine create a symlink so that we always have a single filesystem path to our current installation (so that the path /usr/pkg/nagios-plugins will always work).
We want the plug-ins installed on all of our hosts, so we added this task to PROD/inputs/hostgroups/cf.any with this line:
tasks/app/nagios/cf.nagios_plugins_sync
Step 13: Creating a DNS Entry for the Monitoring Host
We then added an alias to our DNS so that we can use the hostname nagios.campin.net when accessing the Nagios server. Using the alias will allow us to easily migrate Nagios to another server in the future without any users noticing or needing to access a new URL. In order for this to be effective, we need to be sure to only give out the URL https://nagios.campin.net and never refer to the system's real hostname.
To create the DNS alias, we added this line to PROD/repl/root/etc/bind/debian-ext/db.campin.net (and of course, we incremented the zone's serial number and ran named-checkzone):
nagios 300 IN CNAME etchlamp
Once cfengine ran again (according to the schedule defined for cfexecd), we visited the URL https://nagios.campin.net in a web browser. We were pleased to be prompted to log into Nagios with a username/password prompt. We used the nagiosadmin account we created, and we were presented with the Nagios web interface.
If you click Service Detail in the left-hand frame, you'll see details for the system "localhost" in the right-hand frame. It should look like this screenshot:
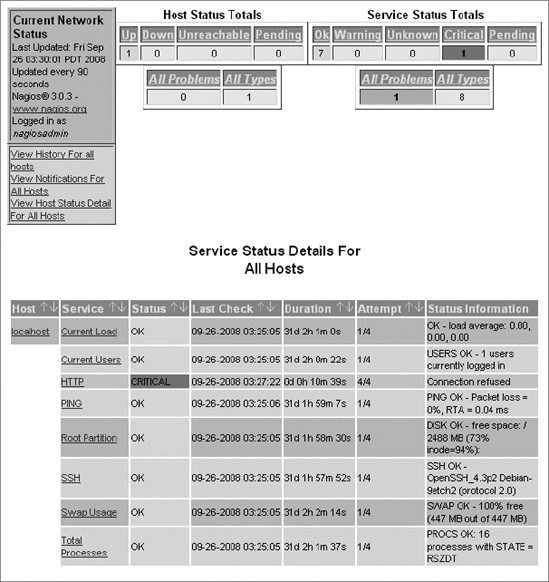
Figure 10-1. Nagios service detail screen for the system localhost
By default, Nagios assumes that the standard plug-ins are installed (which is true in our case), and it has an object configuration file called localhost.cfg that sets up the checks you see on that page.
Note that there is a failed check (CRITICAL state) for the HTTP service, because we only run an SSL-enabled Apache server at our site for Nagios, and we have no HTTP service at all. We'll take steps to make Nagios monitor the correct service in step 14.
Step 14: Modifying the Nagios Localhost-Only Monitoring to Check HTTPS
The only system monitored at this point is the actual host running Nagios (etchlamp), since only the host localhost has checks defined in the default Nagios configuration files.
We had to change these lines in PROD/repl/root/usr/pkg/nagios-conf/objects/localhost.cfg in order to properly monitor HTTPS on this host:
define service{

        use                        local-service    ; service template to use

        host_name                  localhost

        service_description        HTTP

        check_command             check_http

        notifications_enabled      0

        }
We changed them to this:
define service{

        use                        local-service ; service template to use

        host_name                  localhost

        service_description        HTTPS

        check_command              check_https!443!/

        notifications_enabled      0

        }
If you're following along with the book in an environment of your own, you'll notice a problem—there isn't a check_https command definition. We had to create it with this addition to PROD/repl/root/usr/pkg/nagios-conf/objects/commands.cfg:
define command{

        command_name    check_https

        command_line    $USER1$/check_http -S -L -H $HOSTNAME$ -p $ARG1$ -u $ARG2$

        }
This new command object definition calls the check_http plug-in with the appropriate arguments to test an HTTPS-enabled web site. Once this was copied to our Nagios server and Nagios automatically restarted (by cfengine), the proper command was executed and the check cleared in Nagios.
Nagios is now in a fully functional state in our environment, but we don't find it very useful to only monitor a single machine. Next, we'll take steps to monitor the rest of the hosts at our site. The first step will be to deploy a local monitoring agent called NRPE to all our systems.
NRPE
NRPE is the Nagios Remote Plug-in Executor. It is used in place of agents and protocols such as SNMP for remotely monitoring hosts. It grants access to remote hosts to execute plug-ins such as those in the Nagios plug-ins distribution. NRPE has two components: a daemon called nrpe and a plug-in to the Nagios daemon called check_nrpe.
The NRPE documentation points out that there are other ways to accomplish remote plug-in execution, such as the Nagios check_by_ssh plug-in. While SSH access to a remote host seems attractive for security reasons, it imposes more overhead on remote hosts than the NRPE program does. In addition, a site's security policy may expressly forbid remote login access by accounts not owned by a real person. We like NRPE because it is lightweight, flexible, and fast.
Step 15: Building NRPE
The NRPE source distribution does not include an installation facility. Once it is built, it is up to us to install it properly, which we'll handle with cfengine. We will build the NRPE binaries and place them on the cfengine master for distribution to all our hosts. We created a single new directory under PROD/repl/root/usr/pkg to house the NRPE binaries for each of our platforms: PROD/repl/root/usr/pkg/nrpe-2.12-bin.
Now we need to build NRPE so that we have something to place in this new directory. We used these commands to download and compile the program on Debian (i686):
# wget http://internap.dl.sourceforge.net/sourceforge/nagios/nrpe-2.12.tar.gz

# gunzip -c nrpe-2.12.tar.gz | tar xf -

# cd nrpe-2.12

# ./configure --enable-ssl && make all

# cd src

# scp nrpe goldmaster:/var/lib/cfengine2/masterfiles/PROD/repl/root/usr/pkg/

nrpe-2.12-bin/nrpe-debian.i686

# scp check_nrpe goldmaster:/var/lib/cfengine2/masterfiles/PROD/repl/root/usr/

pkg/nagios-plugins-1.4.12-debian.i686/libexec/
We copied check_nrpe to the preexisting nagios-plugins directory for the debian.i686 architecture and copied the nrpe program itself into the single shared PROD/repl/root/usr/pkg/nrpe-2.12-bin directory.
To build on our Red Hat i686 systems, the commands were the same as for Debian, except that we copied the plug-ins to the nrpe-bin/nrpe-redhat.i686 directory and the nrpe binary to nrpe-2.12-bin/nrpe-redhat.i686.
To build NRPE on Solaris, we had to comment out lines 616 though 619 in nrpe.c, because the code assumes that all UNIX-like systems have the same syslog facilities as Linux (and Solaris doesn't).
616  /*       else if(!strcmp(varvalue,"authpriv"))

617                   log_facility=LOG_AUTHPRIV;

618           else if(!strcmp(varvalue,"ftp"))

619                   log_facility=LOG_FTP; */
After that we were able to build on Solaris 10 and copy the programs to the cfengine master with these commands:
# ./configure --enable-ssl --with-ssl=/usr/sfw --with-ssl-lib=/usr/sfw/lib &&

make all

# cd src

# scp nrpe goldmaster:/var/lib/cfengine2/masterfiles/PROD/repl/root/usr/pkg/

nrpe-2.12-bin/nrpe-sunos_sun4u

# scp check_nrpe goldmaster:/var/lib/cfengine2/masterfiles/PROD/repl/root/

usr/pkg/nagios-plugins-1.4.12-sunos.sun4u/libexec/
The preceding configure line makes NRPE compile against the Solaris 10 OpenSSL libraries. We then placed the two resulting binaries into directories on the cfengine master as shown.
Step 16: Creating an NRPE Configuration File
We copied the sample NRPE configuration from the source distribution (in sample-config/nrpe.cfg) to the cfengine master at PROD/repl/root/usr/pkg/nrpe-conf/nrpe.cfg. We then edited the nrpe.cfg file to use the /usr/pkg/nagios-plugins/libexec directory for all the paths and allow access from our etchlamp system as shown:
# substitute your monitoring host's IP for 192.168.1.239

allowed_hosts=127.0.0.1,192.168.1.239


# The following examples use hardcoded command arguments...

command[check_users]=/usr/pkg/nagios-plugins/libexec/check_users -w 5 -c 10

command[check_load]=/usr/pkg/nagios-plugins/libexec/check_load -w 15,10,5

-c 30,25,20

command[check_hda1]=/usr/pkg/nagios-plugins/libexec/check_disk -w 20%

-c 10% -p /dev/hda1

command[check_zombie_procs]=/usr/pkg/nagios-plugins/libexec/check_procs -w 5

-c 10 -s Z

command[check_total_procs]=/usr/pkg/nagios-plugins/libexec/check_procs -w 150 -c 200
At this point, we have the NRPE programs built and ready for distribution from the cfengine master, along with a configuration file. The last thing we need to prepare for NRPE is a start-up script.
Step 17: Creating an NRPE Start-up Script
We created a simple init script for NRPE at PROD/repl/root/etc/init.d/nrpe on the cfengine master with these contents:
#!/bin/sh

PATH=/bin:/usr/bin


case "$1" in

start)

        /usr/pkg/nrpe/sbin/nrpe -c /usr/pkg/nrpe/etc/nrpe.cfg -d

        ;;

restart)

        kill 'cat /var/run/nrpe.pid'

        pkill −9 -f "nrpe -c /usr/pkg/nrpe/etc/nrpe.cfg -d"

        /usr/pkg/nrpe/sbin/nrpe -c /usr/pkg/nrpe/etc/nrpe.cfg -d

        ;;

stop)

        kill 'cat /var/run/nrpe.pid'

        pkill −9 -f "nrpe -c /usr/pkg/nrpe/etc/nrpe.cfg -d"

        ;;

*)

        echo "Usage: $0 {start|stop|restart}"

        exit 1

        ;;

esac


exit 0
This is a very simple init script, but it suffices because NRPE is a very simple daemon. We added the pkill command, because in writing this chapter, we found that occasionally the PID of the nrpe process wasn't properly stored in the nrpe.pid file. Occasionally, daemons have bugs such as this, so we simply work around it with some extra measures to kill the daemon with the pkill command.
Step 18: Copying NRPE Using cfengine
We now have everything we need to deploy NRPE at our site. To distribute NRPE with cfengine, we created a task to distribute the configuration file, init script, and binaries in a file named PROD/inputs/tasks/app/nagios/cf.nrpe_sync. Here's the file, which we will describe only briefly after showing the complete contents, because we're not introducing any new cfengine functionality in this task:
control:

        any::

                addinstallable  = ( restart_nrpe  )

                nrpe_ver        = ( "nrpe-2.12" )


copy:

        debian.i686::

                $(master)/repl/root/usr/pkg/$(nrpe_ver)-bin/nrpe-debian.i686

                                dest=/usr/pkg/$(nrpe_ver)/sbin/nrpe

                                mode=755

                                owner=nagios

                                group=nagios

                                ignore=rw

                                exclude=rw

                                type=checksum

                                server=$(fileserver)

                                encrypt=true

                                define=restart_nrpe


        redhat.i686::

                $(master)/repl/root/usr/pkg/$(nrpe_ver)-bin/nrpe-redhat.i686

                                dest=/usr/pkg/$(nrpe_ver)/sbin/nrpe

                                mode=755

                                owner=nagios

                                group=nagios

                                ignore=rw

                                exclude=rw

                                type=checksum

                                server=$(fileserver)

                                encrypt=true

                                define=restart_nrpe


        sunos_sun4u::

                $(master)/repl/root/usr/pkg/$(nrpe_ver)-bin/nrpe-sunos.sun4u

                                dest=/usr/pkg/$(nrpe_ver)/sbin/nrpe

                                mode=755

                                owner=nagios

                                group=nagios

                                type=checksum

                                server=$(fileserver)

                                encrypt=true

                                define=restart_nrpe


any::

                $(master)/repl/root/etc/init.d/nrpe

                                dest=/etc/init.d/nrpe

                                mode=755

                                owner=root

                                group=root

                                type=checksum

                                server=$(fileserver)

                                encrypt=true

                                define=restart_nrpe


                $(master)/repl/root/usr/pkg/nrpe-conf/nrpe.cfg

                                dest=/usr/pkg/nrpe/etc/nrpe.cfg

                                mode=755

                                owner=nagios

                                group=nagios

                                ignore=rw

                                exclude=rw

                                type=checksum

                                server=$(fileserver)

                                encrypt=true

                                define=restart_nrpe


shellcommands:

        restart_nrpe::

                "/etc/init.d/nrpe restart" timeout=60 inform=true


directories:

        any::

                /usr/pkg/$(nrpe_ver)/sbin m=775 owner=nagios

                                               group=nagcmd inform=false


                /usr/pkg/$(nrpe_ver)/etc m=775 owner=nagios

                                             group=nagcmd inform=false


processes:

        any::

                "nrpe" restart "/etc/init.d/nrpe start" inform=true umask=022


links:

        any::

                /usr/pkg/nrpe        ;               ->! /usr/pkg/$(nrpe_ver)


                # rc scripts

                /etc/rc0.d/K02nrpe           ->! /etc/init.d/nrpe

                /etc/rc1.d/K02nrpe           ->! /etc/init.d/nrpe

                /etc/rc2.d/S98nrpe           ->! /etc/init.d/nrpe


        any.!(solaris|solarisx86)::

                /etc/rc3.d/S98nrpe           ->! /etc/init.d/nrpe

                /etc/rc4.d/S98nrpe           ->! /etc/init.d/nrpe

                /etc/rc5.d/S98nrpe           ->! /etc/init.d/nrpe

                /etc/rc6.d/K02nrpe           ->! /etc/init.d/nrpe
When we link the /etc/init.d/nrpe start-up script into the runlevel-specific directories in the preceding links section, we avoid creating a link in /etc/rc3.d on Solaris hosts. This is because Solaris executes the scripts starting with a capital "S" in the directories /etc/rc2.d/ and /etc/rc3.d/ when booting into runlevel 3. We don't want the script to execute twice. No damage would result, but we don't want to be sloppy. Furthermore, the directories rc4.d, rc5.d, and rc6.d don't exist on Solaris, so we won't attempt to create symlinks in them.
Note that we make it easy to move to a newer version of NRPE later on, using version numbers and a symlink at /usr/pkg/nrpe to point to the current version. The use of a variable means only the single entry in this task will need to change once a new NRPE version is built and placed in the appropriate directories on the cfengine master.
To activate this new task, we placed the following line in PROD/inputs/hostgroups/cf.any:
tasks/app/nagios/cf.nrpe_sync
Step 19: Configuring the Red Hat Local Firewall to Allow NRPE
The next-to-last step we had to take was to allow NRPE connections through the Red Hat firewall. To do so, we added rules directly to the /etc/sysconfig/iptables file on the system rhlamp and restarted iptables with service iptables restart. Here are the complete contents of the iptables file, with the newly added line in bold:
*filter

:INPUT ACCEPT [0:0]

:FORWARD ACCEPT [0:0]

:OUTPUT ACCEPT [0:0]

:RH-Firewall-1-INPUT - [0:0]

-A INPUT -j RH-Firewall-1-INPUT

-A FORWARD -j RH-Firewall-1-INPUT

-A RH-Firewall-1-INPUT -i lo -j ACCEPT

-A RH-Firewall-1-INPUT -p icmp --icmp-type any -j ACCEPT

-A RH-Firewall-1-INPUT -p 50 -j ACCEPT

-A RH-Firewall-1-INPUT -p 51 -j ACCEPT

-A RH-Firewall-1-INPUT -p udp --dport 5353 -d 224.0.0.251 -j ACCEPT

-A RH-Firewall-1-INPUT -p udp -m udp --dport 631 -j ACCEPT

-A RH-Firewall-1-INPUT -p tcp -m tcp --dport 631 -j ACCEPT

-A RH-Firewall-1-INPUT -m state --state ESTABLISHED,RELATED -j ACCEPT

-A RH-Firewall-1-INPUT -m state --state NEW -m tcp -p tcp --dport 22 -j ACCEPT

-A RH-Firewall-1-INPUT -m state --state NEW -m tcp -p tcp --dport 80 -j ACCEPT

-A RH-Firewall-1-INPUT -m state --state NEW -m tcp -p tcp --dport 443 -j ACCEPT

-A RH-Firewall-1-INPUT -m state --state NEW -m tcp -p tcp --dport 5666 -j ACCEPT

-A RH-Firewall-1-INPUT -j REJECT --reject-with icmp-host-prohibited

COMMIT
When this change started allowing connections to our local NRPE daemon, we decided to enforce the contents of this file using cfengine. This decision will disallow the future use of utilities such as system-config-securitylevel to manage the host's firewall rules, but that's good. Stringent enforcement of the iptables file contents will force the firewall rules to be configured according to our wishes every time cfengine runs. We can always use the Red Hat command system-config-securitylevel to make changes and then feed the resulting /etc/sysconfig/iptables changes back into the copy that we distribute with cfengine. This is just another example of how manual changes are often needed to determine how to automate something. It's always OK as long as we feed the resulting changes and steps back into cfengine for long-term enforcement.
We placed the iptables file on our cfengine master at PROD/repl/root/etc/sysconfig/iptables and placed a task with these contents at the location PROD/inputs/tasks/os/cf.iptables_sync:
control:

        any::

                  addinstallable    = (   restartiptables )


copy:

        redhat::

                $(master_etc)/sysconfig/iptables

                        dest=/etc/sysconfig/iptables

                        mode=444

                        owner=root

                        group=root

                        server=$(fileserver)

                        trustkey=true

                        type=checksum

                        encrypt=true

                        define=restartiptables


shellcommands:

        redhat.restartiptables::

                # when config is updated, restart iptables

                "/sbin/service iptables restart"

                        timeout=60 inform=true
We activated a new hostgoup for Red Hat systems by adding this line to PROD/inputs/hostgroups/cf.hostgroup_mappings:
redhat:: hostgroups/cf.redhat
Then, we created a hostgroup file at PROD/inputs/hostgroups/cf.redhat with these contents:
import:

         any::

                 tasks/os/cf.iptables_sync
It might seem strange to use the any class in the cf.redhat hostgroup file, but if you think about it, the task doesn't apply to all hosts on our network, only to the hosts that import this hostgroup file. That means that this any:: class will actually apply to only Red Hat systems.
Now, sit back and let NRPE go out to your network. If you encounter any issues while building NRPE, refer to the NRPE.pdf file included in the docs directory of the NRPE source distribution.
Monitoring Remote Systems
So far, we're simply using the example configuration included with Nagios to monitor only the system that is actually running Nagios. To make Nagios generally useful, we need to monitor remote systems.
As we progress through Nagios configuration in step 20, the information will come at you very quickly. We recommend that you immediately refer to the documentation on the Nagios web site or one of the recommended Nagios books if anything is unclear. We wish to remind you that Nagios is very flexible, and perhaps because of that, it is rather complicated. There is no substitute for experience, so dig in with us and start becoming familiar with it right away!
Step 20: Configuring Nagios to Monitor All Hosts at Our Example Site
First, we need to create a directory for server host and service objects on the cfengine master and have Nagios look for configuration files in this new directory:
# mkdir PROD/repl/root/usr/pkg/nagios-conf/objects/servers/
Edit PROD/repl/root/usr/pkg/nagios-conf/nagios.cfg, and uncomment this line:
#cfg_dir=/usr/pkg/nagios/etc/servers
Then, change it so that it looks like this:
cfg_dir=/usr/pkg/nagios/etc/objects/servers
You should also change the default admin_email and admin_pager addresses in nagios.conf to something appropriate for your site:
[email protected]

[email protected]
We then turned on regular expression matching in nagios.conf with this line (needed for the regular expressions that we use later in service object definitions):
use_regexp_matching=1
We copied the linux-server template in PROD/repl/root/usr/pkg/nagios-conf/objects/templates.cfg to a second similar section to create a new unix-server template that is set to issue alarms on a 24 × 7 schedule. Here is the new unix-server template definition:
define host{

        name           unix-server     ; The name of this host template

        use     generic-host            ; inherits from generic-host template

        check_period   24×7    ;  Unix hosts are checked round the clock

        check_interval              5   ; Actively check the host every 5 minutes

        retry_interval                1   ; Schedule host check retries every minute

        max_check_attempts   10 ; Check each Linux host 10 times (max)

        check_command          check-host-alive ; Default command to check Unix hosts

        notification_period        24×7   ; Always alarm

        notification_interval      120     ; Resend notifications every 2 hours

        notification_options      d,u,r    ; notify for specific host states

        contact_groups            admins   ; Notify admins by default

        register                  0     ; DONT REGISTER- ITS JUST A TEMPLATE!

        }
Templates are used in Nagios to avoid repeating the same values for every service and host object. These objects have many required entries, but Nagios allows the use of templates that contain all the required values. We can use the template instead of listing every required value in the objects that we define. Template definitions are very similar to the host or service definitions that they are meant for, but templates contain the line register 0 to keep Nagios from loading it as a real object. Any or all values can be over-ridden in an object definition that utilizes a template.
Note Be aware that escalation settings override the contact_groups setting in service definitions. We have no escalation settings and won't configure it in this chapter, but keep them in mind for your own configurations.
Now that we have a template that suits our needs, we can inherit from it in our service definitions and specify only important values or those that we wish to override from the template's values.
In the directory PROD/repl/root/usr/pkg/nagios-conf/objects/servers, we have four files to define the objects to monitor on our network:
hosts.cfghostgroups.cfgsystem_checks.cfgweb_checks.cfg
First, we define the hosts at our site in the file hosts.cfg:
define host{

        use                   unix-server

        host_name       hemingway.campin.net

        }

define host{

        use                   unix-server

         host_name      goldmaster.campin.net

        }

define host{

         use                  unix-server

        host_name       aurora.campin.net

        }

define host{

         use                  unix-server

        host_name       rhlamp.campin.net

        }

define host{

       use                  unix-server

        host_name     rhmaster.campin.net

        }

define host{

        use                 unix-server

        host_name     loghost1.campin.net

        }

define host{

       use                  unix-server

        host_name     etchlamp.campin.net

        }
Nagios host definitions allow the specification of the host's IP address. We purposely leave out that IP address because we want Nagios to use the DNS to find it, for two reasons:
- If we change the host's IP address, we want to only have to change it in the DNS, not in Nagios as well. We might forget and cause confusing alarms.
- We normally rely on the DNS for normal function at our site, so if there are DNS problems, we will allow it to cause failed checks in monitoring as well. We don't want to mask broken DNS in Nagios by avoiding it, we want to always use the DNS and see the problems.
Now that we have host definitions for all the hosts that we want to monitor at our site, we will set up groups in the file hostgroups.cfg:
define hostgroup{

        hostgroup_name  campin-web-servers   ; The name of the hostgroup

        members              rhlamp.campin.net      ; Comma separated list of hosts

        }

define hostgroup{

        hostgroup_name  infrastructure-web        ; The name of the hostgroup

        members              etchlamp.campin.net    ; Comma separated list of hosts

        }

define hostgroup{

       hostgroup_name  all-servers     ; The name of the hostgroup

       members              .*                   ; Comma separated list of hosts

       }
Using hostgroups this way allows us to easily add additional systems to Nagios that perform the same functions as existing hosts. We will have to add only the new host to an existing hostgroup and immediately have the proper checks performed against it.
Next, we set up some system level monitoring using NRPE, configured in the file system.cfg:
define service{

        use                       generic-service

        hostgroup_name            all-servers

        service_description       PING

        check_command             check_ping!100.0,20%!500.0,60%

        service_description       Ping check

        }


define service{

        use                                 generic-service

        hostgroup_name            all-servers

        service_description        SSH

        check_command             check_ssh

        service_description         Remote SSH check

        }


define service{

        use                                 generic-service

        hostgroup_name            all-servers

        check_command            check_nrpe!check_zombie_procs

        service_description        Zombie process check over NRPE

        }


define service{

        use                                 generic-service

        hostgroup_name            all-servers

        check_command            check_nrpe!check_load

        service_description        Load check over NRPE

        }
In the check_command field of the preceding service definition, the bang character (!) is used to pass arguments to a command. We defined the check_nrpe command definition in the PROD/repl/root/usr/pkg/nagios-conf/commands.cfg file with this entry:
define command{

        command_name    check_nrpe

        command_line       $USER1$/check_nrpe -H $HOSTADDRESS$ -c $ARG1$

        }
This entry means that the check_nrpe command is passed the argument check_load for the Load check over NRPE service. When you look at the command definition for check_nrpe, you can now see that what is run on the monitoring host is:
# /usr/pkg/nagios-plugins/libexec/check_nrpe -H rhlamp -c check_load
Being able to understand and test what Nagios is actually running, as we worked out previously, will be useful in the future when a remote NRPE check malfunctions. Monitoring systems are complicated, and a failure might happen in the monitoring system itself. Being able to manually test the commands that Nagios runs will prove useful.
Next, we set up some web server checks in the file web_checks.cfg:
define service{

        use                               generic-service

        hostgroup_name          infrastructure-web

        service_description      HTTPS

        check_command         check_https!443!/

        }


define service{

        use                             generic-service

        hostgroup_name        campin-web-servers

        service_description    HTTP check

        check_command        check_http

        }
We defined the check_https check earlier to test the web server on localhost, so here we simply set it up for a remote host and it works properly.
Each time we update the Nagios configuration files, cfengine gets the files to the correct location on our monitoring host (etchlamp) and restarts the Nagios daemon.
We can rest easy knowing that if the etchlamp system fails due to hardware issues, we will simply need to reimage the host, and without any manual intervention cfengine will set the host up for us again. What a great feeling!
Step 21: Party!
That was a lot of work, but now that it's complete, we think that some celebration is appropriate. Let's look at what we've accomplished.
We've deployed a very complex software framework across an environment with three different platforms in an automated manner. We are enjoying the full benefits of automation:
- Easy updates to any monitoring component's configuration files
- Easy program file updates for Nagios, NRPE, or the Nagios plug-ins
- Easy restoration to full functionality if any hosts suffer full system failure, even the central monitoring host
At this point, we have the four components of Nagios deployed, as planned: Nagios itself, the Nagios plug-ins, the Nagios web interface, and NRPE. We can extend the system to run plug-ins that we define, either locally on systems via NRPE or across the network to test client/server applications.
We shouldn't need to change anything about the framework in the near future, only add checks and perhaps new plug-ins. Our monitoring infrastructure choice really shines in the easy addition of new plug-ins; it should be able to support us for quite a while without any core modifications.
What Nagios Alerts Really Mean
When notifications (i.e., alerts) are sent from Nagios, or for that matter from any monitoring system, what does it really mean?
The immediate answer from most SAs is similar to "it means a host or service failed." This isn't really true. The truth of the matter is that a monitoring program or script signaled failure. When Nagios sends a notification, it means that a plug-in script exited with an exit code that was something other than exit code zero (exit code zero means "okay" to Nagios).
If the plug-in is check_http, you might assume that it means that a remote web server is down, but what if a static file at the URL that check_http is requesting was moved? Will a 404 HTTP status (which means "document not found") cause check_http to fail? Do you even know the answer to that? If not, you should find out. What if the monitoring host has a bad route entry that causes traffic to the web server to timeout but doesn't stop notifications from reaching you? The web server itself is probably fine and is probably reachable by all systems except the monitoring host.
Don't jump to the conclusion that a notification means that a service or host has failed. You need to understand exactly what each service definition is checking and validate that the service is really failing with some checks of your own before undertaking any remediation steps.
Ganglia
Ganglia is a distributed monitoring system that uses graphs to display the data it collects. Nagios will let us know if an application or host is failing a check, but Ganglia is there to show us long-term trends in host resource utilization and performance. You can also feed site-specific metrics into Ganglia, though we don't demonstrate doing so in this book.
If a host intermittently triggers a load alarm in Nagios, with no clear cause immediately visible, looking at graphs of the system's load over time can be useful in helping you see when the load increase began. Armed with this information, we can check if the alarm correlates to a system change or application update. Ganglia is extremely useful in such situations, as it generates graphs showing important host metrics such as CPU utilization, system load, and disk and network utilization.
Ganglia is also useful to visualize trends in resource usage with an eye toward capacity planning. If you observe a steady rise in CPU or memory utilization on your web server, you can use this information to justify hardware upgrades or the purchase of more systems to share the load.
We could use many other open source software packages for host resource graphing (and we have in the past). Some of them are more general purpose than Ganglia and some even plug directly into Nagios. We like Ganglia because it is fast and efficient, scales incredibly well, and adding new custom metrics to the Ganglia graphs is extremely easy.
The core functionality of Ganglia is provided by two main daemons, along with a web front end:
gmond: This multithreaded daemon runs on each host you want to monitor.gmondkeeps track of state on the system, relays the state changes on to other systems via TCP or multicast UDP, listens for and gathers the state of othergmonddaemons in the local cluster, and answers request for all the collected information. Thegmondconfiguration will cause hosts to join a cluster group. A site might contain many different clusters, depending on how the administrator wants to group systems for display in the Ganglia web interface.gmetad: This daemon is used to aggregate Ganglia data and can even be used to aggregate information from multiple Ganglia clusters.gmetadpolls one or manygmonddaemons or othergmetaddaemons, parses the collected XML, stores the information in RRD files (round-robin databases), and exports the XML over TCP sockets to clients.- Web interface: Written in PHP, it connects to a local
gmetaddaemon to receive the XML tree needed to display the Ganglia data. Information can be viewed sitewide, clusterwide, or for a single host over periods of time such as the last hour, day, week, or month. The web interface uses graphs generated bygmetadto display historical information.
Ganglia's gmond daemon can communicate using TCP with explicit connections to other hosts that aggregate a cluster's state, or it can use multicast UDP to broadcast the cluster state to all listening hosts. We go with TCP and explicitly name aggregator hosts and then poll those hosts explicitly with gmetad. The gmond configuration file still has UDP port configuration settings, but they won't be used at our example site.
Building and Distributing the Ganglia Programs
Ganglia needs to be compiled for each platform at our site. We built Ganglia on Solaris, Red Hat, and Debian Linux by downloading and installing with the following sequence of commands. Note that a C++ compiler will need to be present on the system, as well as development libraries for RRDtool (and the package libpng12-0 on Debian). Without the RRDtool libraries the build will seem successful, but the gmetad program will fail to be built.
# wget http://internap.dl.sourceforge.net/sourceforge/ganglia/ganglia-3.0.7.tar.gz

# gunzip -dc ganglia-3.0.7.tar.gz | tar xf -

# cd ganglia-3.0.7

# ./configure --prefix=/usr/pkg/ganglia-3.0.7 && make

# sudo make install

# rsync –avze ssh /usr/pkg/ganglia-3.0.7/

goldmaster:/var/lib/cfengine2/masterfiles/PROD/repl/root/usr/pkg/

ganglia-3.0.7-i686.debian
As shown in the preceding set of commands, we copied the resulting /usr/pkg/ganglia-3.0.7 binaries from each platform to the appropriate directory in the master files tree on the cfengine master (though the preceding command only demonstrates the Debian i686 build). Here are the three directories:
PROD/repl/root/usr/pkg/ganglia-3.0.7-i686.debian/

PROD/repl/root/usr/pkg/ganglia-3.0.7-i686.redhat/

PROD/repl/root/usr/pkg/ganglia-3.0.7.sunos_sun4u/
The gmond binary will use a built-in configuration if it can't find its default configuration file at /etc/gmond.conf (or it isn't started with the command line option -c to manually specify a configuration file). To see the default configuration run gmond with this argument:
# gmond --default_config > gmond.conf
You can then redirect the output to a file (named gmond.conf), edit as appropriate for your site, and then place the gmond.conf file on the cfengine master. The beautiful thing about this option is that it even emits comments describing each configuration section! Ganglia was clearly written by system administrators.
We did precisely this to get started on our configuration and then changed the file to suit our needs. Here are the portions of gmond.conf that we changed:
globals {

 setuid = no

 user = daemon

 user = nobody

 host_dmax = 3600

 cleanup_threshold = 300 /*secs */

}


cluster {

  name = "Campin.net"

}


udp_send_channel {

  host = goldmaster

  port = 8649

}


udp_send_channel {

  host = etchlamp

  port = 8649

}


udp_recv_channel {

  mcast_join = 239.2.11.71

  port = 8649

}


udp_recv_channel {

  port = 8649

}


tcp_accept_channel {

    acl {

            default = "deny"

            access {

                    ip=127.0.0.1

                    mask=32

                    action = "allow"

        }

        access {

                ip=192.168.1.239

                mask=32

                action = "allow"

        }

    }

  port = 8649

}
We kept the default Ganglia port of 8649 (which spells "UNIX" on a T9 phone keypad). We set the hosts goldmaster and etchlamp to be the cluster data aggregators via the udp_send_channel sections. We'll use gmetad to poll the cluster state from these two hosts. The tcp_accept_channel section allows our host running gmetad (192.168.1.239 for etchlamp) to poll state over TCP from any host running gmond. The rest of the configuration file is unchanged.
We got started with the example gmetad.conf file from the Ganglia source distribution at the location gmetad/gmetad.conf. We placed the Ganglia configuration files (gmond.conf and gmetad.conf) into the directory PROD/repl/root/usr/pkg/ganglia-conf on the cfengine master. We'll modify the contents of the example gmetad.conf later in the chapter.
We added a UNIX/Linux user account called ganglia to the PROD/repl/root/etc/[passwd|shadow|group] files with these entries:
/etc/passwd: ganglia:x:106:109:Ganglia Monitor:/usr/pkg/ganglia:/bin/false/etc/group: ganglia:x:109:/etc/shadow: ganglia:!:14103:0:99999:7:::
Next, we created a cfengine task for copying out the binaries at the location PROD/inputs/tasks/app/ganglia/cf.sync_ganglia_binaries on the cfengine master:
classes:  # synonym groups:

        have_usr_pkg_ganglia_3_0_7     = ( IsDir(ganglia-3.0.7-i686.debian) )


control:

        any::

           AddInstallable     = ( ganglia_binaries_updated ganglia_conf_updated )

           AllowRedefinitionOf   = ( ganglia_master_dir )

           dest_dir                      = ( "ganglia-3.0.7" )


        debian_4_0.i686::

                ganglia_master_dir    = ( "ganglia-3.0.7-i686.debian" )


        redhat.i686::

                ganglia_master_dir    = ( "ganglia-3.0.7-i686.redhat" )


        solaris|solarisx86::

                ganglia_master_dir    = ( "ganglia-3.0.7.sunos_sun4u" )


copy:

        any::

                $(master)/repl/root/usr/pkg/$(ganglia_master_dir)

                                dest=/usr/pkg/$(dest_dir)

                                mode=755

                                r=inf

                                owner=root

                                group=root

                                type=checksum


                                server=$(fileserver)

                                encrypt=true

                                define=ganglia_binaries_updated


                $(master)/repl/root/usr/pkg/ganglia-conf

                                dest=/usr/pkg/ganglia-conf

                                mode=755

                                r=inf

                                owner=root

                                group=root

                                type=checksum

                                server=$(fileserver)

                                encrypt=true

                                define=ganglia_conf_updated


shellcommands:

        ganglia_binaries_updated::

                # All hosts run gmond. Restart it completely when binaries update

                "/usr/bin/pkill gmond ; sleep 1 ; /usr/bin/pkill −9 gmond ;

/usr/pkg/ganglia/sbin/gmond -c /usr/pkg/ganglia-conf/gmond.conf "

                        timeout=60 inform=true owner=daemon


        ganglia_web.ganglia_binaries_updated::

                # the box running the ganglia web interface runs gmetad, restart it

                #  when the binaries update

                "/usr/bin/pkill gmetad ; sleep 1 ; /usr/bin/pkill −9 gmetad ;

/usr/pkg/ganglia/sbin/gmetad -c /usr/pkg/ganglia-conf/gmetad.conf "

                        timeout=60 inform=true owner=daemon


processes:

        any::

                "gmond" restart

                  "/usr/pkg/ganglia/sbin/gmond -c /usr/pkg/ganglia-conf/gmond.conf"

                  inform=true umask=022 owner=daemon


        ganglia_conf_updated::

                "gmond" signal=hup inform=true

                "gmetad" signal=hup inform=true


links:

        any::

                /usr/pkg/ganglia ->! /usr/pkg/$(dest_dir)
Next, add this line to PROD/inputs/hostgroups/cf.any so that all of our hosts get the Ganglia programs copied over:
tasks/app/ganglia/cf.sync_ganglia_binaries
Note that we don't place a start-up script onto the systems for Ganglia. We simply have cfengine start the appropriate daemons if they aren't found in the system's process list. This places an obvious dependency on having cfexecd running, calling cfagent regularly. We always start up cfengine at boot on all systems at our site, so this shouldn't be a problem.
Configuring the Ganglia Web Interface
Our central Ganglia machine will run the web interface for displaying graphs, as well as the gmetad program that collects the information from the gmond daemons on our network.
Ganglia's web interface is written in PHP and distributed in the source package. Copy the PHP files from the Ganglia source package's web directory to this location on the cfengine master:
# tar zxf ganglia-3.0.7.tar.gz

# cd ganglia-3.0.7

# mkdir -p /var/lib/cfengine2/masterfiles/PROD/repl/root/var/www/apache2-default

# cp -r web

/var/lib/cfengine2/masterfiles/PROD/repl/root/var/www/apache2-default/ganglia
We will use cfengine to copy this directory to our host named etchlamp, which already has a web server will serve as our network's Ganglia console. Again, we used the directory PROD/inputs/tasks/app/ganglia on the cfengine master and put the task cf.setup_ganglia_web in it with these contents:
control:

        ganglia_web.debian::

                addinstallable        = (     restart_apache2 )


copy:

       ganglia_web.debian::

               $(master)/repl/root/var/www/apache2-default/ganglia

                               dest=/var/www/apache2-default/ganglia

                               mode=555

                               r=inf

                               purge=false

                               owner=root


                               group=root

                               type=checksum

                               server=$(fileserver)

                               encrypt=true

                               define=restart_apache2


               $(master_etc)/apache2/sites-available/ganglia

                               dest=/etc/apache2/sites-available/ganglia

                               mode=444

                               owner=root

                               group=root

                               type=checksum

                               server=$(fileserver)

                               encrypt=true

                               define=restart_apache2


               $(master_etc)/apache2/ssl/ganglia.pem

                               dest=/etc/apache2/ssl/ganglia.pem

                               mode=444

                               owner=root

                               group=root

                               type=checksum

                               server=$(fileserver)

                               encrypt=true

                               define=restart_apache2


directories:

        ganglia_web.debian::

                /var/www/apache2-default/ganglia  mode=755 owner=root

                                               group=root inform=true

                /usr/pkg/ganglia-data/rrds      mode=755 owner=daemon

                                             group=daemon inform=true


processes:

        ganglia_web.debian::

                "/usr/sbin/apache2" restart "/etc/init.d/apache2 start"

                                        inform=true umask=022


                "gmetad" restart

                "/usr/pkg/ganglia/sbin/gmetad -c /usr/pkg/ganglia-conf/gmetad.conf "

                   inform=true umask=022 owner=daemon


shellcommands:

        ganglia_web.debian.restart_apache2::

                "/etc/init.d/apache2 restart"

                        timeout=60

                        umask=022


links:

        ganglia_web.debian::

                /etc/apache2/sites-enabled/ganglia ->!

                        /etc/apache2/sites-available/ganglia


                # the make-ssl-cert utility created this link when we created

                # ganglia.pem, we'll preserve it using cfengine

                /etc/apache2/ssl/4c1b6a93          ->! /etc/apache2/ssl/ganglia.pem
This task causes the gmetad daemon to be started on the ganglia_web host if it isn't running (we define ganglia_web in the next section). Our configuration for the gmetad daemon (PROD/repl/root/usr/pkg/ganglia-conf/gmetad.conf) follows:
data_source "Campin.net" 60 goldmaster etchlamp 8649

gridname "Campin"

all_trusted on

setuid off

rrd_rootdir "/usr/pkg/ganglia-data/rrds"
We removed all comments to make the file easy to read. The comments in the example configuration in the Ganglia source directory (gmetad/gmetad.conf) are extensive and serve as sufficient documentation to get most users going with a working configuration.
Next, we needed to generate the ganglia SSL certificate for our Ganglia web site and put it on the cfengine master:
# /usr/sbin/make-ssl-cert /usr/share/ssl-cert/ssleay.cnf

/etc/apache2/ssl/ganglia.pem

# scp /etc/apache2/ssl/ganglia.pem

goldmaster:/var/lib/cfengine2/masterfiles/PROD/repl/root/etc/apache2/ssl/
To configure the ganglia_web role in cfengine, we added this line to PROD/inputs/classes/cf.main_classes:
ganglia_web = ( etchlamp )
Our Debian-based Ganglia web system needs some additional packages. To install them at initial system installation time, we added the packages rrdtool and libpng12-0 into the FAI package list for the WEB class. We installed them manually using apt-get on etchlamp in this case, so that we didn't have to reimage the host just to add two packages.
Next, we created a new hostgroup file for our new ganglia_web role on the cfengine master at the location PROD/inputs/hostgroups/cf.ganglia_web, with these contents:
import:

        any::

                 tasks/app/apache/cf.setup_ganglia_web
Then, we added this to PROD/inputs/hostgroups/cf.hostgroup_mappings:
ganglia_web:: hostgroups/cf.ganglia_web
Once cfengine on etchlamp copies the PHP content and Apache configuration files, we can visit https://ganglia.campin.net/ in our web browser and view graphs for all the hosts at our site, individually or as a whole. If you haven't previously used a similar host resource graphing system as part of your monitoring suite, you'll be amazed at how often you refer to the graphs during troubleshooting or for capacity planning.
Now You Can Rest Easy
At this point, we have a full monitoring suite at our site with Ganglia and Nagios. We can utilize Nagios for 24 × 7 alerting on host and service availability, and we can utilize Ganglia to view short and long-term system resource usage. Both are extremely flexible and will grow and scale along with our new infrastructure.
As your site requires more and more monitoring, you might benefit from the distributed monitoring capabilities of Nagios. Nagios version 3.0 and above has a much improved ability to operate in such a fashion. Utilizing cfengine, you can easily deploy a test instance of distributed Nagios in order to determine if the additional load sharing and redundancy is a good fit for your site. Many sites simply purchase more powerful hardware in order to utilize Nagios against many hosts and services, but at some point, this may no longer be feasible.
Ganglia will scale extremely well to large numbers of systems, and most of the follow-on configuration will be around breaking up hosts into separate groups, and possibly utilizing multicast. If you don't use multicast, you'll want to utilize many gmond instances to aggregate the cluster's state and simply configure gmetad to poll the cluster state from a list of several hosts running gmond. This allows one or more gmond aggregators to fail and still have Ganglia function properly. We only use two at our example site, you may choose to run with many more as the total number of systems at your site increases.