
CHAPTER 2
Financial Statement Analysis
Banks don't make bad loans in bad times; they make bad loans in good times.
– William J. McDonough, President and CEO of the NY Fed 1993–2003
Analyzing the financial statements of a bank requires a somewhat specialized framework. Unlike, say, a consumer, technology, or industrial company, banks are fundamentally balance sheet driven, with the income statement mostly a consequent output of interest earned on loans held on the balance sheet funded by interest paying deposits.
Despite requiring the development of some specialized knowledge, the endeavor is well worth it, as the fragmented and homogenized nature of banking means the skills you develop will be leveragable to a large universe of investable securities.
Though banks are predominantly balance sheet driven, banks still generate a decent chunk of revenues from fees (about 20% of net revenues for banks less than $10B in assets), while noninterest expenses can meaningfully impact profitability.
Cash flow statements are largely ignored for these cash flush financial intermediaries, doubly so as banks have unique access to the federal funds market and FHLB (Federal Home Loan Bank) advances among other pools of liquidity. Additionally, liquidity at these depositories is already tightly monitored by banking regulators. Further, as financial intermediaries, the application of US GAAP leads to some unintuitive results, such as deposit inflows being categorized as financing activities, underwriting loans being categorized as investing outflows.
Banks use a special set of financial ratios to describe the profitability, credit quality, capital, and liquidity of an institution. Understanding and interpreting these ratios will give us a better ability in making informed investing decisions, and we will go over the most important ones in this and the following chapters on capital and credit.
We must also pay particular attention to asset quality, or the overall credit risk of the loan and securities portfolio. This is one of the most critical areas in assessing the health of a bank, as bank failures often are triggered by credit problems. We touch upon this topic both here in this chapter, and in Chapter 4, which is devoted to credit.
Finally, decomposing the loan portfolio and deposit base provides insights to the drivers of value for a bank, as well as gives clues to a bank's sensitivities to interest rates and other macroeconomic variables.
In the following section, we will be referencing real-world financial statements of a previously publicly traded depository, FNB Bancorp (FNBG), a $1.3B asset community bank based in San Francisco, which was acquired for a healthy 15% premium back in December of 2017.
THE BALANCE SHEET
The balance sheet is a terrific place to start. As mentioned in the introduction, a bank's balance sheet is a collection of financial assets, specifically interest earning assets, funded by a collection of interest-bearing liabilities, cushioned with a sliver of equity to protect depositors. Thus, the balance sheet is the primary driver for earnings, and projecting items on the balance sheet are the starting point when modeling forward expectations. We will be focused on the more idiosyncratic aspects of a typical bank's balance sheet (Exhibit 2.1).
The Accounting Equation
Starting with the fundamental accounting equation, that assets are equal to liabilities plus equities, we see that in our example bank, FNB Bancorp, assets are mostly funded by liabilities. This is normal. Banks unilaterally have significantly higher leverage ratios than in other industries. Case in point, the debt-to-equity ratio of the S&P 500 is close to 1.5× while our example, FNBG, has a 10× debt-to-equity ratio. This is simply due to the classification of deposits, the main funding source of banks, as liabilities. Fittingly, due to the low spreads and subsequent ROAs of banks, leverage is the only way for a bank to generate ROEs that are comparable with other industries.
An important aside: In bank land, leverage ratios (in the traditional sense where equity or EBITDA is in the denominator) are rarely referenced. As we shall see in Chapter 3 on capital, we like to follow the lead set by regulators, and use capital ratios, which are defined as some measure of equity in the numerator divided by some measure of assets in the denominator.
Assets
Total Assets are an important metric given the highly regulated nature of banks. Total assets at the top-tier Bank Holding Company (BHC) level will be one of the inputs used by bank regulators (Fed, FDIC, and OCC) to determine what set of regulations an institution will be beholden to. The most important asset thresholds are shown in Exhibit 2.2.
EXHIBIT 2.1 Consolidated Balance Sheet
Source: FNBG 2017 10-K
| FNB BANCORP AND SUBSIDIARY | ||
|---|---|---|
| Consolidated Balance Sheets | ||
| December 31, 2017 and 2016 | ||
| Assets | ||
| (Dollar amounts in thousands) | 2017 | 2016 |
| Cash and due from banks | $ 18,353 | $ 15,758 |
| Interest-bearing time deposits with financial Institutions | 130 | 205 |
| Securities available-for-sale, at fair value | 355,857 | 360,105 |
| Other equity securities | 7,567 | 7,206 |
| Loans, net of deferred loan fees and allowance for loan losses of $10,171 and $10,167 on December 31, 2017 and December 31, 2016 | 829,766 | 782,485 |
| Bank premises, equipment, and leasehold improvements, net | 9,322 | 9,837 |
| Bank-owned life insurance | 16,637 | 16,247 |
| Accrued interest receivable | 5,317 | 4,942 |
| Other real estate owned, net | 3,300 | 1,427 |
| Goodwill | 4,580 | 4,580 |
| Prepaid expenses | 825 | 856 |
| Other assets | 13,584 | 15,746 |
| Total assets | $ 1,265,238 | $ 1,219,394 |
| Liabilities and Stockholders' Equity | ||
| Deposits | ||
|
$ 313,435 | $ 296,273 |
|
130,988 | 121,086 |
|
467,788 | 487,763 |
|
138,084 | 114,384 |
|
1,050,295 | 1,019,506 |
| Federal Home Loan Bank advances | 75,000 | 71,000 |
| Note payable | 3,750 | 4,350 |
| Accrued expenses and other liabilities | 16,913 | 14,224 |
|
1,145,958 | 1,109,080 |
| Commitments and Contingencies (Note 12) | ||
| Stockholders' equity | ||
|
85,565 | 84,283 |
|
34,654 | 27,577 |
|
(939) | (1,546) |
|
119,280 | 110,314 |
|
$ 1,265,238 | $ 1,219,394 |
EXHIBIT 2.2 Major Asset Thresholds
| Asset Threshold | Impact |
|---|---|
| >$3 Billion |
|
| >$5 Billion |
|
| >$10 Billion |
|
| >$100 Billion |
|
| >$250 Billion |
|
| >$700 Billion |
|
As a result, you will rarely see banks cross those thresholds organically. Crossing these thresholds by just a whisker will just saddle you with higher costs. Banks will thus choose to stall organic growth, jump over said thresholds via acquisitions, or sell.
Asset size and valuation multiples have also shown historical correlation, allowing us to anticipate multiple expansion or contraction by forecasting asset growth (Exhibit 2.3).
Loans make up the largest chunk of assets on the balance sheet, usually over 50% of total assets, and are the most important revenue driver on a bank's balance sheet. This item represents outstanding loans and leases held on the balance sheet that the bank expects to receive interest and principal payments from. These loans can be either originated or purchased. Loans are generally reported by the principal amount outstanding if they are held for investment (Exhibit 2.4).
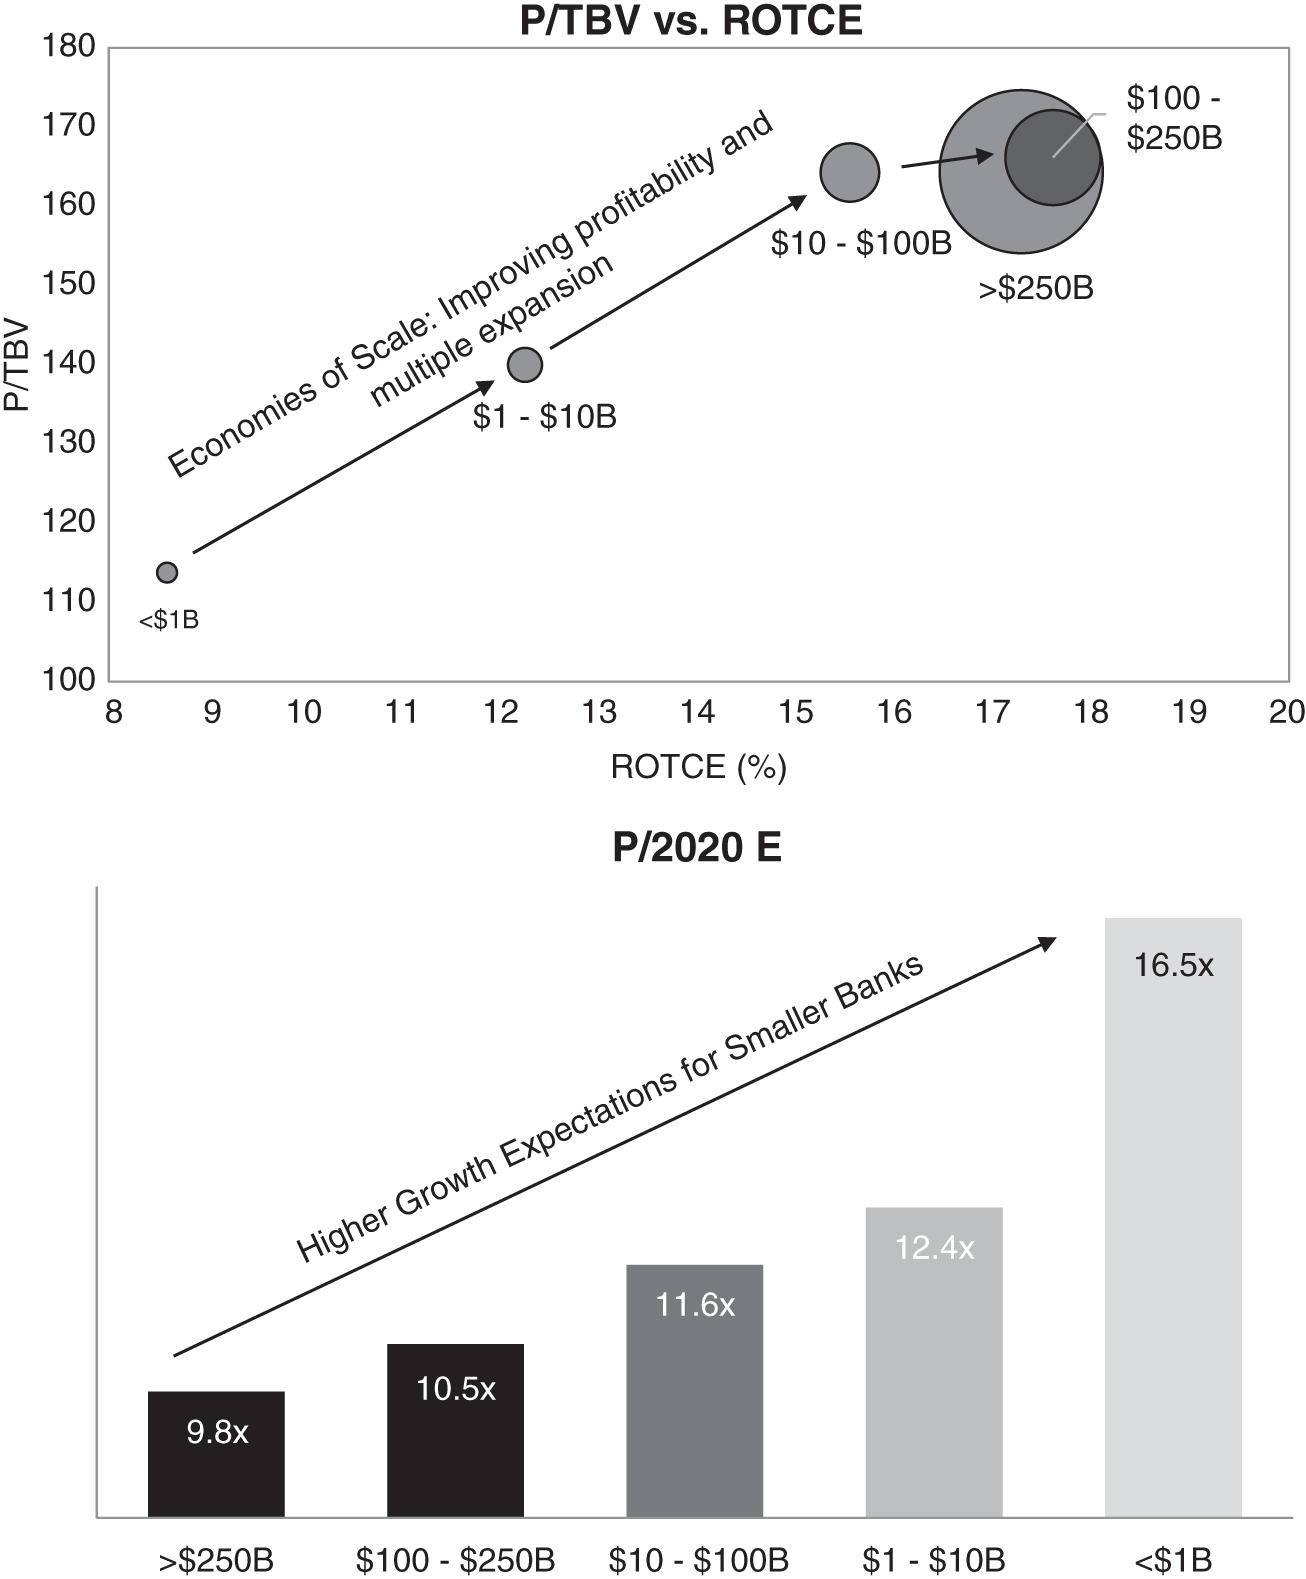
EXHIBIT 2.3 US Publicly Traded Banks by Asset Size
Source: S&P Global Market Intelligence
For FNB Bancorp, loan balances are condensed into one line item on the balance sheet: Loans, net of deferred loan fees, and allowance for loan losses (Exhibit 2.5).
Source: FDIC
Net Loan Growth
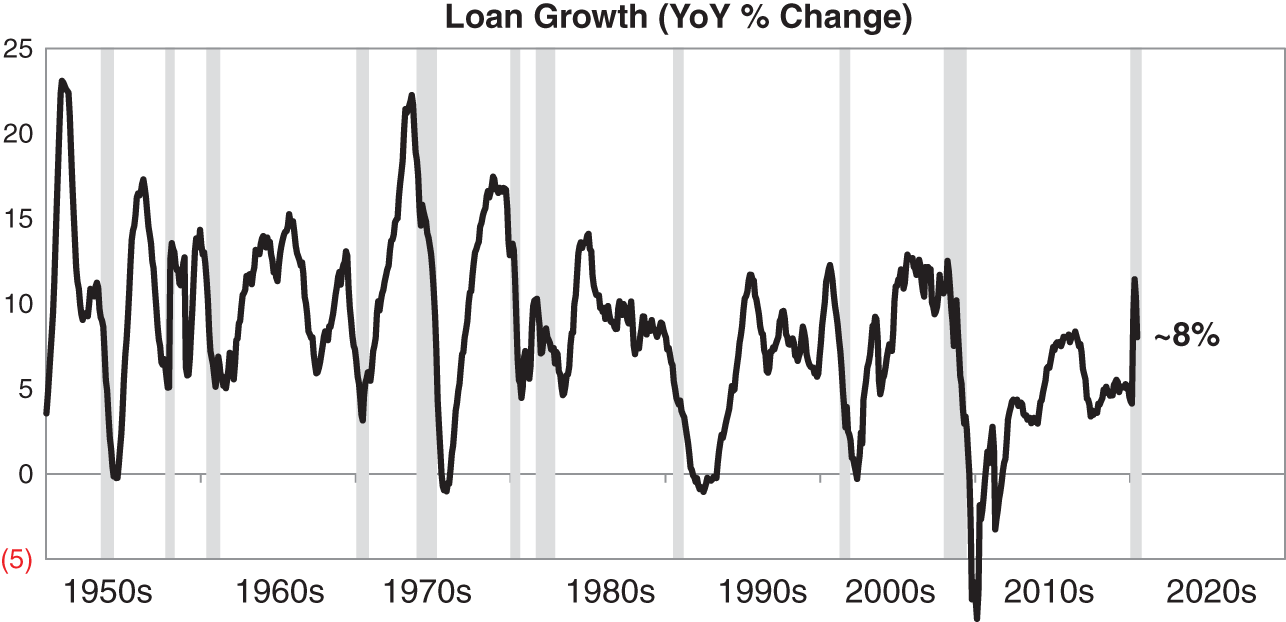
EXHIBIT 2.4 Net Loans to Total Assets
Source: Federal Reserve, St. Louis Fed
EXHIBIT 2.5 FNBG Loan Balances
Source: FNBG 2017 10-K
| 2017 | 2016 | |
| Loans, net of deferred loan fees and allowance for loan losses of $10,171 and $10,167 on December 31,2017 and December 31, 2016 | 829,766 | 782,485 |
As you can see from FNBG's balance sheet, the balance sheet itself does not provide a lot of granularity on the loan book, with net loans distilled down to a single item. We must dive deeper into the footnotes to learn about the loan composition, structure, maturity schedule, and yields. Additionally, the classification of assets by their credit status (whether it is special mention, nonaccrual, nonperforming, etc.) is found in the footnotes. We expand on this later in this chapter in sections covering loan composition and asset quality.
Loan growth is one of the primary growth metrics investors will use to assess the growth of a bank. Bank investors are lucky in this respect, as it is a more stable metric than revenue growth, which can exhibit significant seasonality. Loan growth is usually cited on a linked-quarter annualized basis, though year-over-year is often used as well. Depositories that are growing loans at a faster clip will tend to trade at a higher premium, all things being equal. However, growth that is too fast versus the industry might be suspect. As to what constitutes “fast” or “slow” growth, apart from comparing growth at peer banks, we also like to look at the Federal Reserve's weekly H.8 data, which shows aggregate loan growth for the entire US banking industry (Exhibit 2.4, 2nd panel).
Loan Loss Reserves or Allowance for Loan and Lease Losses (ALLL) are a contra-asset account to cover estimated losses on loans due to defaults and non-payments. Think of it as the bank equivalent of an allowance for doubtful accounts. Some banks will report them as their own line item on the consolidated balance sheet, while others do not. Reserves are usually quoted as a percentage of loans.
Banks will maintain specific reserves against certain credits as well as a general reserve for the entire loan portfolio. Loan loss reserves are increased through provision expenses that run through the income statement, and are decreased by net charge-offs (which are actual gross write-downs of the book value of loans when collectability of principal is deemed unlikely, less any recoveries).
Whether or not a bank has adequate reserves is the million-dollar question. Reserves are cyclical, and thus getting a historical perspective is helpful and will allow us to assess if the bank's reserves line up with our expectations for the broader economy. Reserves usually do not dip below 1% of total loans. Once we determine where we are in the credit cycle, we can then go on to assess whether a particular bank's reserves are adequate for the risk profile of their loan book. Riskier loans (with generally higher yields) will require higher reserves. If a bank has too little reserves, there is risk they will have an outsized provision in the future. Conversely, an over-reserved bank could potentially boost earnings by releasing reserves in future periods. Finally, reserves between banks can sometimes be incomparable due to M&A (Exhibit 2.6).

EXHIBIT 2.6 Reserves
Source: FDIC
Current Expected Credit Losses (CECL) is a new accounting standard (FASB ASU 2016-13) that will meaningfully change how loan loss reserving is implemented. Under CECL, banks will need to establish a reserve equal to the expected losses over the entire life of a loan. This has the potential to meaningfully change the amount of reserves a bank must maintain, especially for certain long-dated loans such as mortgages. We cover this in greater detail in Chapter 4.
Deferred Loan Fees are fees that are collected by the bank when underwriting a loan. These fees are considered unearned and are capitalized on the balance sheet to be later amortized over the life of the loan.
Securities are the other major category of interest earning assets on a bank balance sheet. In most community banks, securities average around 25% of the asset base. Buying and selling marketable securities is not the primary business model for banks. As a result, securities held by banks tend to be high quality with minimal credit risk and good liquidity, allowing banks to quickly convert securities into cash and redeploy into more lucrative loan opportunities and service other liquidity needs. This premium placed on liquidity and credit quality means that the securities portfolio will have a lower average yield than the loan portfolio. The securities portfolio is also adjusted to manage interest rate risk and match the duration of certain liabilities. Popular security types include agency backed MBS, treasury securities, and nontaxable municipal securities.
Exhibit 2.7 shows us details on FNBG's $356MM securities portfolio, including the average yield (2.54%) and maturity (6.76 years) of the total securities portfolio. The largest exposures are to municipal debt ($151MM) and mortgage-backed securities ($120MM).
EXHIBIT 2.7 Securities Book
Source: FNBG 2017 10-K
| TABLE 10 | |||||||||||
|---|---|---|---|---|---|---|---|---|---|---|---|
| (Dollar amounts in thousands) | Due In 1 Year | After 1 Year Through 5 Years | Yield | After 5 Years Through 10 Years | Yield | Due After 10 Years | Yield | Fair Value | Maturity In Years | Average Yield | |
| Or Less | Yield | ||||||||||
| US Treasury securities | $ — | —% | $ 1,975 | 1.88% | $ — | —% | $ — | —% | $ 1,975 | 2.92 | 1.83% |
| Obligations of US Government Agencies | 6,000 | 1.10% | 35,822 | 1.74% | — | 1.77% | — | — | 41,823 | 3.12 | 1.59% |
| Mortgage-backed securities | — | — | 44,580 | 2.48% | 31,732 | 2.61% | 43,481 | 2.78% | 119,792 | 11.03 | 2.35% |
| Asset-backed securities | — | — | — | — | 1,628 | 2.43% | 2,058 | 3.95% | 3,686 | 9.71 | 3.32% |
| Obligations of states and political subdivisions | 4,636 | 2.54% | 81,470 | 2.33% | 54,503 | 2.62% | 10,493 | 3.73% | 151,103 | 5.11 | 2.45% |
| Corporate debt | 2,011 | 1.70% | 26,272 | 2.64% | 8,136 | 5.14% | 1,060 | 5.84% | 37,478 | 4.32 | 3.95% |
|
$ 12,647 | 1.72% | $ 190,119 | 2.29% | $ 95,999 | 2.83% | $ 57,092 | 3.06% | $ 355,857 | 6.76 | 2.54% |
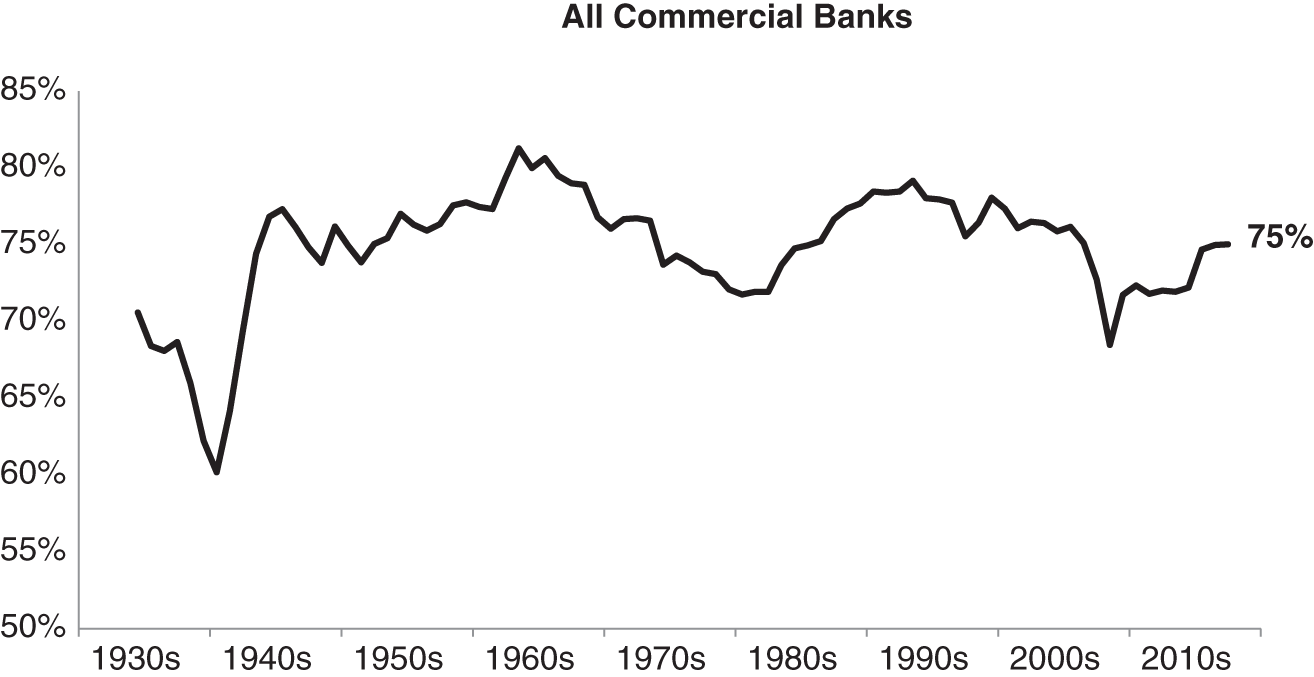
EXHIBIT 2.8 Loans and Securities to Assets
Source: FDIC
An important nuance is to recognize whether the securities are held to maturity (HTM), available for sale (AFS), or held for trading (HFT), as it has implications as to if and where unrealized and realized gains will be recorded. Most community banks hold the majority of securities in AFS, a smaller amount in HTM, and practically zero in HFT.
Finally, Interest Earning Assets are simply a subtotal of securities and loans. They are the revenue generating financial assets that are held on the balance sheet and collectively make up north of 70% of a typical bank's balance sheet (Exhibit 2.8).
The notes to the financial statements will provide an insightful table similar to Exhibit 2.9, which shows average balances for interest earning assets, interest income generated from said assets, and their calculated yields.
Our example bank, FNBG, compares favorably to the industry, with ∼90% of assets comprised of interest earning assets. Looking deeper at our mix of interest earning assets, we see that higher yielding loans make up about 69% of the interest earning asset base, which is about in-line with the industry aggregate.
Other real estate owned (OREO) represents physical real estate and other assets that are owned by the bank due to repossession of collateral on a defaulted loan secured by an underlying asset. Generally, the value is initially recorded at the lesser of the carrying amount of the loan or fair value of the property. Valuations are periodically performed, and any subsequent revisions in the estimate of fair value are reported as an adjustment to the carrying value of the real estate. The ultimate goal is to dispose of OREO, which can prove to be a costly and lengthy process.
EXHIBIT 2.9 Average Yields and Rates Paid
Source: FNBG 2017 10-K
| TABLE 1 | Net Interest Income and Average Balances | |||||
|---|---|---|---|---|---|---|
| 2017 | 2016 | |||||
| (Dollar amounts in thousands) | Average Balance | Interest Income Expense | Average Yield Cost | Average Balance | Interest Income Expense | Average Yield Cost |
| INTEREST EARNING ASSETS | ||||||
| Loans, gross(1)(2) | $ 823,333 | $ 41,956 | 5.10% | $ 746,829 | $ 38,313 | 5.13% |
| Taxable securities | 224,600 | 5,209 | 2.32% | 209,257 | 4,213 | 2.01% |
| Nontaxable securities(3) | 133,467 | 3,653 | 2.74% | 135,412 | 3,916 | 2.89% |
| Interest on deposits—other financial institutions | 10,681 | 126 | 1.18% | 7,694 | 44 | 0.57% |
| Total interest earning assets | 1,192,081 | 50,944 | 4.27% | 1,099,192 | 46,486 | 4.23% |
| Cash and due from banks | 15,168 | 92,889 | 15,041 | |||
| Premises and equipment | 9,500 | 10,086 | ||||
| Other assets | 41,087 | 39,135 | ||||
| Total noninterest earning assets | 65,755 | 64,262 | ||||
| TOTAL ASSETS | $ 1,257,836 | $ 1,163,454 | ||||
Cash and Due from Banks are fairly self-explanatory. A bank will require a certain amount of cash to deal with regular business expenses and deposit withdrawals. The nuance for depositories is that banks are required by regulators to maintain minimum balances of cash “in the vault” or deposited at their local reserve bank. The amount of required reserves is based upon a percentage of certain deposits at a bank. This cash cushion, known as the reserve requirement, is also one of the core monetary tools used by central banks around the world (though the US Federal Reserve has a strong preference for other tools). Cash in the vault yields nothing, while balances held at the Reserve Banks yield what is called the IORR (Interest on Required Reserves) and IOER (Interest on Excess Reserves), more on this later in this book, and are low in comparison to yields on the securities and loan portfolios. In March of 2020, the Federal Reserve reduced the reserve requirement to zero percent effectively eliminating the reserve requirement.
Fed Funds Sold is cash lent out in the Federal Funds market on an overnight basis in order to meet their reserve requirements. The amount of interest earned is de minimis, as it is essentially a risk-free overnight investment. Fed Funds sold are occasionally broken out as a separate line item on the balance sheet if the amounts are significant.
Goodwill and Other Intangible Assets is typically recognized on the balance sheet following acquisitions and in short represent the difference between the price paid and the identifiable tangible and intangible net assets. Though the accounting treatment for goodwill is not unique for banks, the fact that bank valuation relies much more heavily on asset-based approaches means that goodwill and intangibles deserve a little extra attention.
Bank-Owned Life Insurance is life insurance policies owned by the bank to insure the lives of certain employees. Either the bank or the employee can be the beneficiary. For the latter, BOLI can provide a tax efficient means of providing employee benefits. Generally, BOLI is not a major focus for investors, and is not seen as a franchise enhancing or detracting item.
Liabilities
Deposits represent the largest chunk of liabilities, and are the funds placed by individuals and businesses (collectively known as depositors) into a bank for safekeeping (Exhibit 2.10). One cannot overemphasize the importance that a bank's deposit base has on a bank's business model and franchise value. Thanks to the fractional reserve banking system, deposits are the primary funding source for loans at a bank, and due to their low cost, give banks a significant competitive advantage in their overall cost of capital over other lenders. Similar to loan growth, deposit growth is used as a measuring stick for overall growth. Not all deposits are equal, and certain types of deposits are valued more highly than others. We will go into further detail on deposit composition later in the chapter; however, a quick proxy for the quality of a bank deposit base is the cost of deposits (expressed as a percentage of interest paid on deposits divided by average deposits). Our example bank, FNBG, has a cost of deposits of 27 bps in 2017, which compares favorably to the 2017 industry average of 36 bps.
EXHIBIT 2.10 Liabilities
Source: FNBG 2017 10-K
| Liabilities and Stockholders' Equity | ||
|---|---|---|
| 2017 | 2016 | |
| Deposits | ||
|
$ 313,435 | $ 296,273 |
|
130,988 | 121,086 |
|
467,788 | 487,763 |
|
138,084 | 114,384 |
|
1,050,295 | 1,019,506 |
| Federal Home Loan Bank advances | 75,000 | 71,000 |
| Notes payable | 3,750 | 4,350 |
| Accrued expenses and other liabilities | 16,913 | 14,224 |
|
1,145,958 | 1,109,080 |
Federal Home Loan Bank advances (FHLB advances) represent borrowings under a collateralized line of credit with the regional FHLB. The FHLB are government-sponsored banks that provide credit to its member institutions in order to support lending activity, specifically for home and community loans. Advances from the FHLB may be short-term or long-term in nature. Typically, the cost associated with FHLB advances will be above a bank's cost of deposits, but below other forms of debt financing.
Equity
Chapter 3 covers much of the ins and outs of equity. Equity generally makes up only a sliver of the total capital structure of a bank, usually less than 10%. There are many abstract ways to think about equity, but perhaps the most insightful way to think about equity within the context of a bank is it is the loss absorbing buffer that protects the depositors in the event of losses sustained in the loan portfolio. Too much equity would result in subpar ROEs, while too little would expose the bank to too much risk and crimp growth prospects (Exhibit 2.11).
EXHIBIT 2.11 Equity
Source: FNBG 2017 10-K
| 2017 | 2016 | |
|---|---|---|
| Stockholders' equity | ||
|
85,565 | 84,283 |
|
34,654 | 27,577 |
|
(939) | (1,546) |
|
119,280 | 110,314 |
|
$ 1,265,238 | $ 1,219,394 |
THE INCOME STATEMENT
Net Interest Income (NII) represents the interest earned on interest earning assets less interest paid on interest bearing liabilities. It is the most important earnings driver for a bank. Bank investors tend to focus directly on NII as opposed to its constituents, interest income and interest expense. However, it is important to be cognizant that a sequential increase or decrease in NII can be caused by a change in either interest income or interest expense. In Exhibit 2.12, NII makes up over 90% of total net revenues; this is pretty typical for a community bank.
Provision for Loan Losses (LLP) is the expense item that contributes to the allowance for loan losses. The amount of provisioning expense is a complex calculation requiring many judgment calls by management, based on changes on the expected credit quality of the existing portfolio and to cover newly underwritten loans. Note that it is possible, though unusual, for the provision to be a negative, as it was for FNBG in 2017. It is most appropriate to exclude negative provisions when assessing core operating trends. Finally, it is helpful to look at the LLP in the context of other metrics, such as net loan growth, net charge-offs, and the already existing size of the loan loss reserve. We will cover the ins and outs of asset quality in the upcoming sections.
Noninterest income, also known as fee income, is revenue that is derived from sources other than interest earned on assets. These tend to be secondary revenue streams for a community bank. Common examples of noninterest income include service charges on deposits, realized gains and losses on securities, trading gains and losses, mortgage banking fees, and trust or asset management fees. Fee revenues, such as deposit service charges and asset management fees, can help insulate a bank's business model from moves in interest rates. However, that is not to say fee income is completely uncorrelated to interest rates. For instance, mortgage banking fees are a function of mortgage underwriting volumes, which tends to be inversely correlated to longer term interest rates. In this example, mortgage banking fees act almost as a natural hedge to the typical asset sensitive balance sheet.
EXHIBIT 2.12 Income Statement
Source: FNBG 2017 10-K
| FNB BANCORP AND SUBSIDIARY | ||
|---|---|---|
| Consolidated Statements of Earnings | ||
| Years ended December 31, 2017, 2016, and 2015 | ||
| (Dollar amounts and average shares are in thousands, except earnings per share amounts) | ||
| 2017 | 2016 | |
| Interest income: | ||
|
$ 41,956 | $ 38,313 |
|
5,209 | 4,213 |
|
2,927 | 2,943 |
|
126 | 44 |
|
50,218 | 45,513 |
| Interest expense: | ||
|
2,807 | 2,780 |
|
850 | 67 |
|
214 | 222 |
|
3,871 | 3,069 |
|
46,347 | 42,444 |
|
(360) | 150 |
|
46,707 | 42,294 |
| Noninterest income: | ||
|
2,264 | 2,461 |
|
210 | 438 |
|
390 | 402 |
|
996 | 1,294 |
|
3,860 | 4,595 |
| Noninterest expense: | ||
|
19,366 | 19,474 |
|
2,747 | 2,528 |
|
1,646 | 1,765 |
|
1,482 | 1,363 |
|
400 | 600 |
|
1,267 | 1,199 |
|
451 | 524 |
|
571 | 657 |
|
472 | 284 |
|
349 | 347 |
|
288 | 288 |
|
80 | (5) |
|
1,430 | 1,668 |
| Total noninterest expense | 30,549 | 30,692 |
| Earnings before provision for income taxes | 20,018 | 16,197 |
| Provision for income taxes | 9,307 | 5,696 |
| Net earnings | $ 10,711 | $ 10,501 |
| Earnings per share available to common stockholders: | ||
|
$ 1.46 | $ 1.45 |
|
$ 1.41 | $ 1.42 |
| Weighted average shares outstanding: | ||
|
7,361 | 7,233 |
|
7,607 | 7,417 |
Noninterest expenses represent all other expenses not related to interest paid on liabilities. Personnel, occupancy, and equipment costs are some of the larger items typically found.
Pre-provision Net Revenues (PPNR) represents NII and noninterest income less noninterest expenses, but excludes loan loss provision expenses. Investors will use this metric as a way to look at underlying “run rate” earnings power, with credit noise stripped away. It is helpful as a directional reference, especially when compared on a QoQ or YoY basis.
RATIOS
Return on Assets (ROA) is calculated the regular way, net income over average assets (Exhibit 2.14). ROAs in bank land historically hovered in the low single digit range (Exhibit 2.13). Mathematically, this is expected given that NIMs, which are effectively the “interest-earning” ROA, hover in this same range. As discussed earlier, banks makeup for their “lackluster” ROAs through leverage.
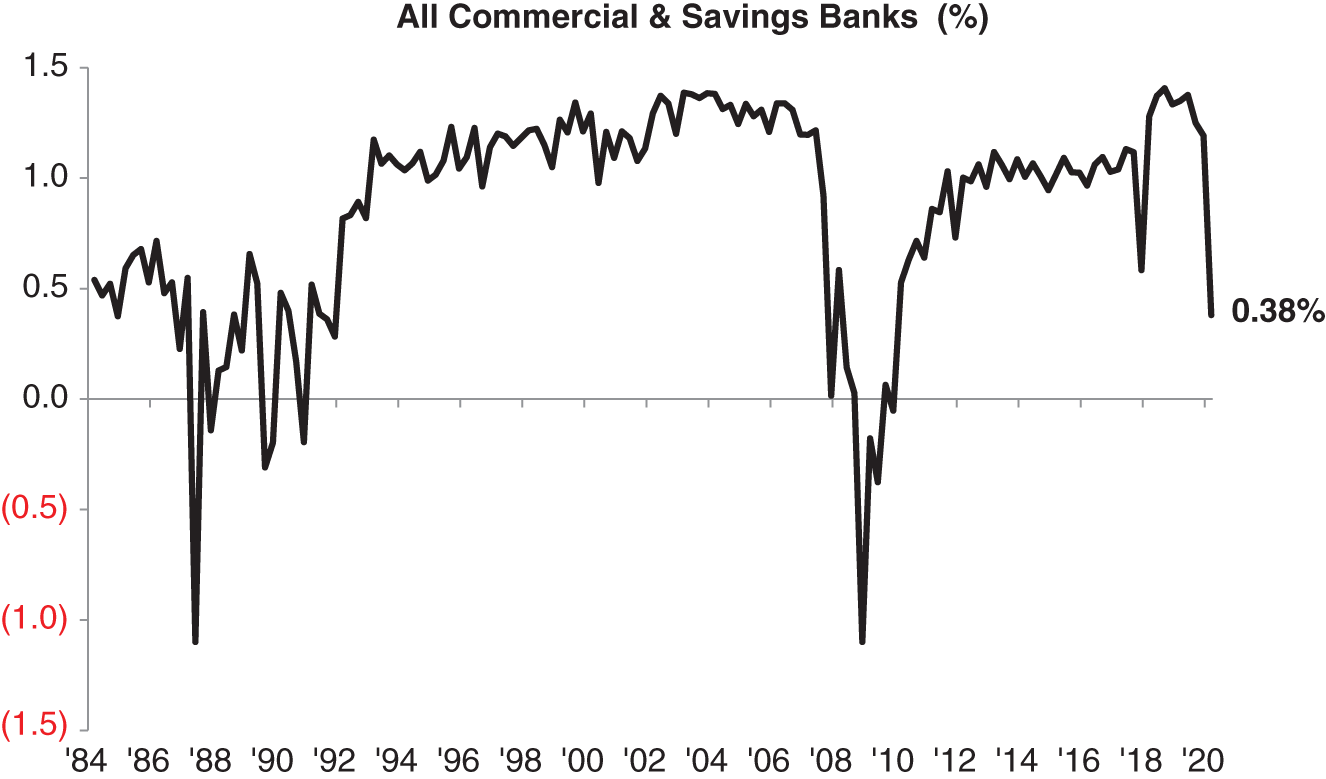
EXHIBIT 2.13 Quarterly Pre-Tax ROA
Source: FDIC
EXHIBIT 2.14 ROA Composition
Source: FNBG 10K, S&P Global Market Intelligence
| FNBG | Banks $1–3B in Assets | ||||
|---|---|---|---|---|---|
| $000s | % of Avg Assets | $000s | % of Avg Assets | ||
| Interest Income | 50,218 | 3.99% | 22,501,695 | 3.87% | |
| Interest Cost | (3,871) | (0.31%) | (2,518,790) | (0.43%) | |
| Loan Loss Provision | 360 | 0.03% | (901,622) | (0.15%) | |
| Fee Income | 3,860 | 0.31% | 8,129,979 | 1.40% | |
| Non-Interest Expenses | (30,549) | (2.43%) | (17,732,963) | (3.05%) | |
| Tax Provision | (9,307) | (0.74%) | (3,084,420) | (0.53%) | |
| Net Income/ ROA | 10,711 | 0.85% | 6,393,879 | 1.10% | |
| Average Assets | 1,257,836 | 582,081,276 | |||
One helpful way to break down ROA is to divide each major line item by average assets. This type of ratio analysis allows us to better understand the drivers of profitability. In our example bank, FNBG, we can see that ROA is below peer levels due predominately to below average fee income and, to a lesser extent, higher than average taxes.
EXHIBIT 2.15 Average ROE and ROA by Asset Size
Source: S&P Global Market Intelligence, 2017
| Asset Size | Count | ROA | Leverage | ROE | ||
|---|---|---|---|---|---|---|
| >$250B | 8 | 0.90 | × | 8.8 | = | 7.85 |
| $50 - $250B | 14 | 1.08 | × | 9.0 | = | 9.76 |
| $10 - $50B | 60 | 0.97 | × | 8.3 | = | 8.03 |
| $1 - $10B | 284 | 0.86 | × | 9.4 | = | 8.08 |
| <$1B | 481 | 0.65 | × | 9.8 | = | 6.42 |
| All | 847 | 0.76 | × | 9.5 | = | 7.18 |
Return on Equity (ROE) is similarly calculated in the typical way, net income divided by average equity. DuPont analysis shows us that ROE can be simply broken down as ROA multiplied by financial leverage. However, further DuPont analysis – breaking down ROA into net profit margin and asset turnover – does not yield any economic insights for a bank. Bank investors are blessed by the fact that regulators have strict rules for leverage and capital ratios. The regulatory framework gives us approximate goalposts for us to estimate what a fully levered balance sheet should look like, making it easier for us to recognize whether an exceptional ROE is from unsustainably high leverage, or from a truly exceptional business model. Conversely, a lagging ROE could simply be a function of an under-levered balance sheet. Exhibit 2.15 shows us average ROA and leverage, and consequently ROE, for banks in different asset size buckets.
Our example bank, FNBG, logged a 2017 ROA and ROE of 0.85% and 8.9%, respectively. With $1.2B in assets, the company generated an in-line ROA, but due to its lower capital ratios/higher leverage, FNBG was able to earn a higher ROE.
Return on Tangible Common Equity (ROTCE) is a more refined way to look at returns to common equity holders. It adjusts both net income and common equity:
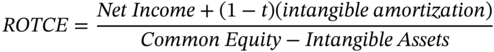
ROTCE is a more accurate metric of the real return on tangible capital. ROEs can get bogged down by the artifacts of acquisition accounting and unfairly penalize those companies with lots of goodwill on their balance sheets. This reduces comparability between companies. ROTCE strips away these issues.
A frequently used valuation framework that you will see later in Chapter 5 is ROTCE vs. P/TBV to screen for potentially undervalued or overvalued stocks.
Earnings Per Share (EPS) is simply net income available to common shareholders divided by average share count. Estimated “core” EPS is more of an art than a science, but some of the more common adjustments include backing out unusual reserve developments (such as negative provisions) and accretion income on acquired loans.
As bank investors and management teams speak frequently on asset growth, being able to assess the approximate impact that a given asset growth will have on EPS is useful. A quick and dirty back-of-the-envelope calculation that is frequently used is simply to use change in assets and ROA as inputs:
For example, if a bank is targeting to grow assets by $250MM, and has historically generated a 1.1% ROA, with a static share count of 3MM shares, the pro-forma EPS impact would be:
Additionally, it is helpful to assess how changes in the NIM impact EPS. Some simple algebra yields the following:
Continuing our example, if a bank with $1.2B in average earning assets expects a 5 bps increase in its NIM, and assuming a 35% tax rate, the EPS impact would be:
Net Interest Margin (NIM) represents Net Interest Income (NII) divided by Average Earning Assets (AEAs). This profitability metric is one of the most important figures looked at by bank management teams and investors:


EXHIBIT 2.16 A Brief History of NIM
Source: FDIC
Though it is technically a profitability metric calculated from NII and AEAs, NIM is often used as an input in quick models to project NII. This is especially true as bank management teams will often provide NIM guidance, giving us an easy input to use for modeling purposes. NIMs are often thought of as the “spread” that a bank earns, which is technically untrue. Instead, it is similar to an ROA, as it a measure of income (interest income) over assets (interest earning assets). NIMs are annualized figures, so if you are looking at quarterly results, don't forget to annualize the NII 2.16.
EXHIBIT 2.17 2017 Net Interest Margin for All US Banks
Source: S&P Global Market Intelligence
| Percentile | NIM |
|---|---|
| 95th Percentile | 4.54 |
| 90th Percentile | 4.28 |
| 75th Percentile | 3.91 |
| 50th Percentile | 3.58 |
| 25th Percentile | 3.24 |
| Median | 3.58 |
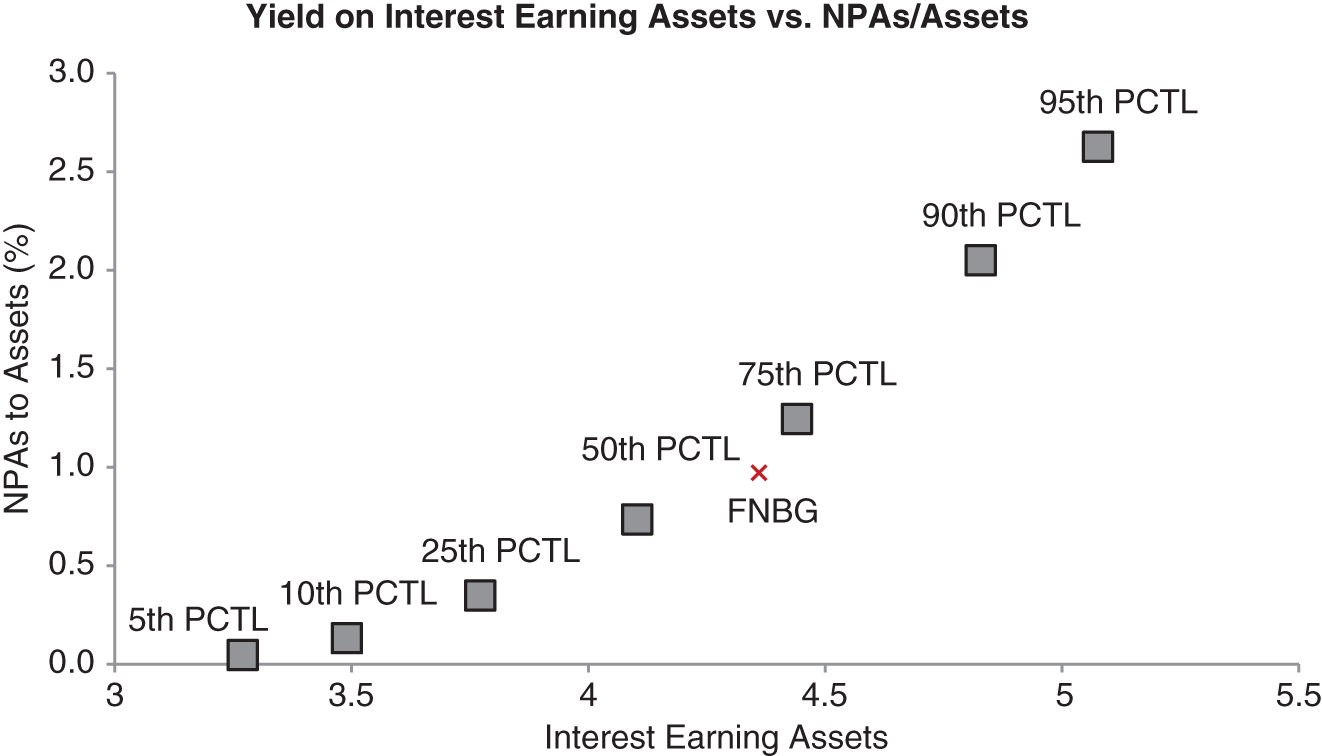
EXHIBIT 2.18 All US Banks: Higher Yields = Higher Risk
Source: S&P Global Market Intelligence
Our example bank, FNBG, had a 2017 NIM of 3.95%, good enough to be in the 77th percentile.
Yield on Interest Earning Assets represents total interest earned divided by average earning assets, on an annualized basis. In a vacuum, a higher yield on interest earning assets is of course better. However, markets are efficient, which means a higher return entails a higher degree of risk. We can see that this is broadly true within our universe of publicly traded US banks, a higher yield on assets is associated with a higher level of non-performing assets (our proxy for risk) (Exhibit 2.18).
FNBG's risk and return profile seems to be consistent with the broader industry. FNBG had a 2017 yield on interest earning assets of 4.27%, good enough to be in the 64th percentile, with NPAs/Assets of 88 bps, which puts them at the 60th percentile.
Cost of Interest-bearing Liabilities represents interest paid on liabilities divided by total interest-bearing liabilities. Interest bearing liabilities only include interest-bearing instruments such as CDs, interest-bearing deposit accounts, debt, and FHLB borrowings. This metric does not represent the total cost of funding for a bank, as it excludes noninterest-bearing liabilities from the denominator. As a result, this metric is less helpful than one would initially think. A bank like FNBG has nearly $300MM in noninterest-bearing demand deposits, nearly a third of its $1.0B deposit base.
EXHIBIT 2.19 All US Publicly Traded Banks: A Lower Cost of Funds Drives Higher ROA
Source: S&P Global Market Intelligence
| Cost of Funds (%) | ROA (%) | |
|---|---|---|
| 95th Percentile | 0.18 | 0.94 |
| 90th Percentile | 0.25 | 0.87 |
| 75th Percentile | 0.38 | 0.85 |
| 50th Percentile | 0.55 | 0.85 |
| 25th Percentile | 0.75 | 0.80 |
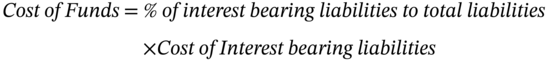
Cost of Funds represents a more complete look at the cost of liabilities that provide capital for a bank (Exhibit 2.19). It is calculated by dividing interest paid on liabilities by total liabilities, which includes all interest-bearing and noninterest-bearing liabilities. Noninterest-bearing liabilities mainly consist of noninterest-bearing deposits – an important value driver for a bank, which we go through further in our deposit composition section. As non-interest bearing deposits bear no interest, a quick reconciliation between cost of funds and cost of interest bearing liabilities is possible through the following calculation:
Cost of Deposits refers specifically to the interest paid on deposits divided by average deposit balances. Gathering low-cost deposits is one of the fundamental ways banks compete with each other. Because depositors don't necessarily view the monies deposited at a bank as an investment, the market for deposits is not necessarily efficient. Said another way, depositors are not depositing money looking for the highest risk adjusted return, they take into consideration things such as deposit services, the ATM/branch network, and digital or mobile applications. Thus, banks have an opportunity to create sustainable systematic advantages over their peers by focusing on deposit gathering.
Deposit Beta is an important concept relating to the sensitivity of deposit costs as compared to an underlying interest rate (usually the Federal Funds rate). Deposit betas are calculated as the change in deposit costs divided by the change in interest rates over the same period. Logically then, in a rising rate environment, a lower deposit beta is better as interest costs won't rise as quickly. However, calculating deposit beta can only be done in retrospect, and by then, the information will already be reflected in a bank's stock. Thus, estimates must be made based on things such as company guidance, the local competitive market, growth aspirations, judgments on the quality of the deposit franchise, and past history (Exhibit 2.20).

EXHIBIT 2.20 Cost of Deposits vs. Fed Funds
Source: FDIC and St. Louis FRED
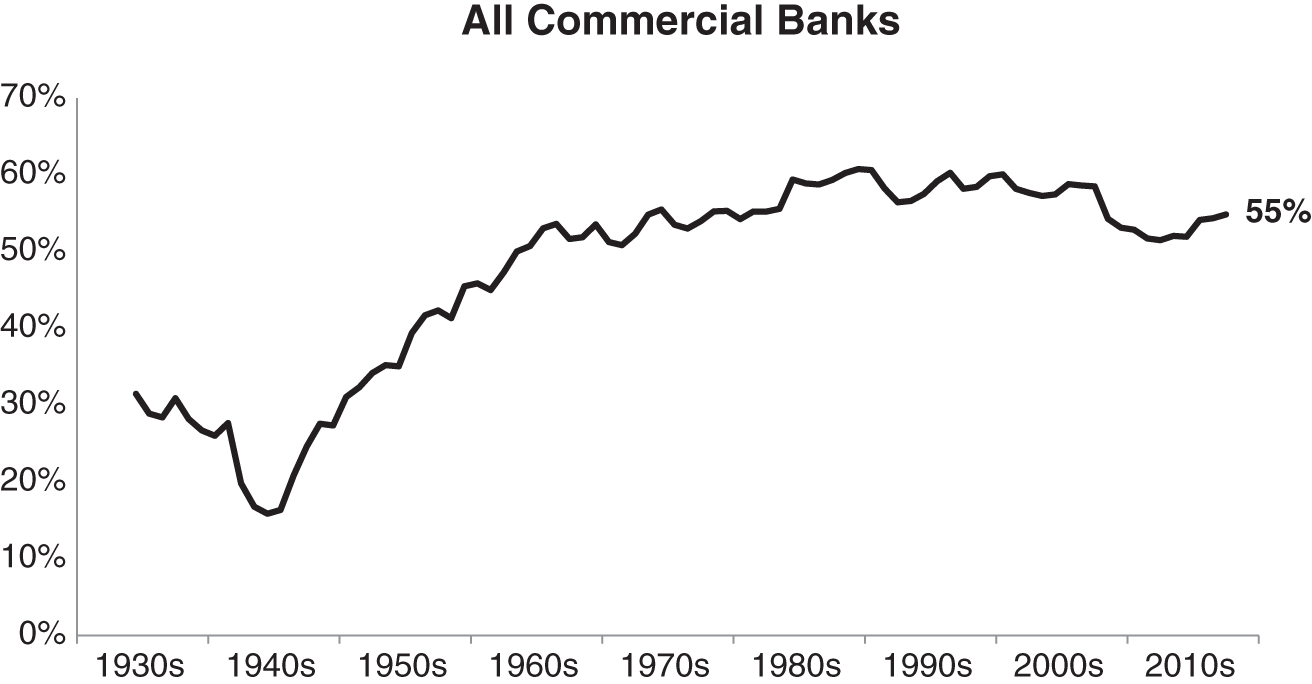
Loans to Deposits (L/D) is a straightforward calculation that simply shows loans divided by deposits. The industry average is around 70%. This simple metric has important implications. A relatively low loan to deposit ratio implies that the bank has a large amount of “underutilized” funds, sitting in relatively low-yielding cash and securities. A bank thus has the opportunity to remix their balance sheet and increase interest income. This is an especially powerful dynamic in an environment where interest rates are generally moving higher, allowing the bank to deploy funds into loans with ever increasing yields. Conversely, a high loan to deposit ratio implies that the bank's balance sheet is “loaned up,” with little room for easy improvements. This is not necessarily a bad thing. First, returns are most likely higher than compared to a bank with a lower loan/deposit ratio. Second, in a falling rate environment, having funds tied up into longer duration higher-yielding loans will mitigate the effects of falling interest rates. Finally, and perhaps unintuitively, the L/D ratio can be well in excess of 100%. Some banks, particularly those that write a large proportion of mortgage loans, end up funding a decent percentage of their loans through FHLB borrowings.
Securities to Assets shows the proportion of securities to total assets. Similar to the loan to deposit ratio, it is a measure that shows balance sheet remixing potential. The industry average has been trending down and is now in the mid-teens.
EXHIBIT 2.21 Efficiency Ratio by Asset Size
Source: S&P Global Market Intelligence
| Assets | Count | Efficiency Ratio (%) |
|---|---|---|
| <$1B | 500 | 73.1 |
| $1B – $10B | 292 | 60.8 |
| $10B – $50B | 63 | 56.7 |
| $50B – $250B | 14 | 59.9 |
| >$250B | 8 | 59.4 |
| All | 877 | 67.3 |
Efficiency Ratio (E/R) in bank land is calculated as non-interest expenses divided by net revenues (NII plus noninterest income). The industry average at a healthy bank is in the 50s to 60s, though some exceptional banks have efficiency ratios in the 40s. An important element of analyzing the efficiency ratio is recognizing that an efficiency ratio can be improved by either decreasing non-interest expenses through cost saving initiatives, or through improving net revenues. Sometimes it is easy to focus narrowly on just the numerator, but understand that a bank with for example, a higher NIM, could support a higher expense base, and thus could be reporting an impressive efficiency ratio, and yet have further room to improve its cost structure.
Exhibit 2.21 suggests that there is a “sweet spot” when it comes to size and efficiency, somewhere in the $10B to $50B in asset range. Our bank, FNBG, had a better than average efficiency ratio of 54%.
Noninterest Expense to Average Assets. This is also a measure of efficiency. The industry average has been trending down and sits in the ∼2.6% range. This ratio is helpful when used in conjunction with the efficiency ratio in understanding the cost structure of a bank. For instance, a bank with a subpar ROA and a high efficiency ratio coupled with a low noninterest expense to average asset ratio could suggest that the cost structure is not the problem, and that instead the bank is not generating enough spread income. In our example, FNBG, net operating expenses measured 1.85% of average assets.
Deposits per Branch divides total deposits by total branches, which yields the average deposits per branch. This metric gives clues to the bank's deposit gathering strategy and the non-interest expenses associated with deposits. The national median sits around $40MM per branch.
Noninterest Income to Revenues represents the percentage of net revenues that are derived from non-interest income related sources. There are minor variations to the calculation (e.g., using operating revenues or using net revenues in the denominator), but the general idea is the same. The industry average is in the 20s to 30s. Investors tend to interpret a higher noninterest income percentage to being less sensitive to interest rates. This is partially true, though as we noted earlier in the section on noninterest income, certain fee revenues exhibit sensitivity to rates.
Equity to Assets represents total equity divided by total assets. It is mathematically the inverse of the leverage ratio, and thus can be used to reconcile ROA with ROE. The industry average is around 11%. Note that this ratio includes intangibles such as goodwill.
Tangible Equity to Tangible Assets represents total equity less intangible assets divided by total assets less intangible assets. The industry average is around 9%.
Tangible Common Equity to Tangible Assets, also referred to as the TCE ratio, represents common equity less intangible assets divided by total assets less intangible assets. The TCE ratio is the “cleanest” way for us to look at the leverage of an institution from the perspective of a common shareholder, and helps us reconcile ROA and ROTCE, which has important implications to valuation.
Asset Quality Metrics are used to monitor the credit quality of assets held on the balance sheet. Loans with payments past due, nonperforming credits, write-downs, and foreclosures are all part of the normal business of underwriting and holding risky financial assets. We will delve deeper into this very important topic in the next section.
Finally, the ratios that bank investors don't use are illustrative as well. Since interest expense is such a fundamental part of the business model, any ratio that excludes or isolates interest expense, such as EBITDA or the interest coverage ratio, has no relevance. Likewise, inventory based metrics (e.g., inventory turnover) and day cycles (e.g., cash conversion cycles) have no applicability.
ASSET QUALITY
Asset quality, also referred to as credit quality, represents the quantity and severity of existing and potential credit problems that exist on bank's balance sheet. From a theoretical framework, banks should not have zero credit losses. The market for loans is fairly efficient, thus for loans to earn more than the risk-free rate, a certain amount of risk must be taken.
Asset quality problems pose the largest existential risk for a bank, and have been the primary trigger for failure and bankruptcy in the past. Due to the highly levered nature of banks, and the relatively thin returns earned on assets, a seemingly small write-off (relative to assets) could have major financial implications. Let's use median bank industry metrics to illustrate an example. Let's say a hypothetical bank with a $2B book of loans is suffering from credit problems and requires a 2% write-off. This would equate to $40MM, or ∼$30MM after-tax. Let's say the bank was otherwise generating an 85 bps ROA, with loans making up 60% of the asset base, implying total assets of $3.3B, and net income of $28MM. Thus a 2% write-off would push net income into a $2MM loss for the bank.
Unfortunately for us bank investors, it is sometimes very difficult to anticipate credit issues at a bank. Most of the times, we learn of credit issues through public disclosures and scramble to analyze how it affects a bank's intrinsic value (at least before everyone else in the market does). Further, bank management teams implement their own credit policies and have a certain degree of latitude in the classification of assets, making comparisons difficult.
Bank investors need to put on their macro hat to look into economic trends to anticipate impacts to certain geographies, industries, and asset types. For instance, a supply glut in certain commodities could affect local economies that rely heavily on said commodities and impact not just business loans, but eventually the housing market (mortgage) and consumers (credit card loans) as well. Finally, even when we correctly anticipate eventual credit issues, it may take a long time for them to manifest in the financials, while the magnitude is difficult to assess.
Before we get ahead of ourselves, see Exhibit 2.22 to go over some definitions and accounting mechanics.
As described earlier, the ALLL is a contra asset account that reflects estimated credit losses within a bank's asset portfolio. Said another way, it represents the amount of write-offs a bank estimates it will take. The word estimate should trigger some consternation, as the “appropriate” size of the ALLL is indeed an opaque calculation with many estimates up to the discretion of management. It is helpful to know that the industry average is for the ALLL to be about 1.1% of the gross loan portfolio, with a standard deviation of 0.5%. Any significant deviations should be looked into. The size of the ALLL is a function of the overall size of the loan portfolio, the estimated probability of default, and the estimated severity of losses in the event of default. Loan reviews are done both for specific loans and also incorporate a general reserve, which reflects an assessment of local economic conditions as well as historical loan losses. Every quarter, an expense on the income statement, the provision for loan losses, is credited to the ALLL. Conversely, actual charge-offs do not impact the P&L directly, but instead are debited from the ALLL. Charge-offs are generally taken after debt is delinquent after a certain period of time (90 days or 120 days being common thresholds).
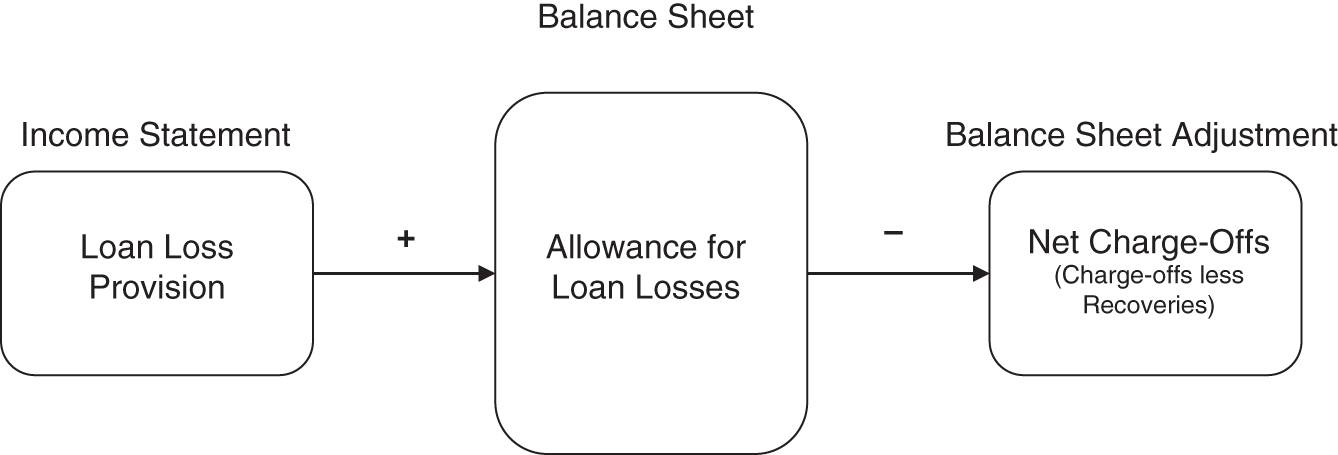
EXHIBIT 2.22 Mechanics of the Allowance for Lease and Loan Loss Reserves (ALLL)
Loan Classifications (Internal)
A loan classification system uses buckets to classify loans by their risk of nonpayment. Regulators require banks to have robust loan classification systems to categorize assets by credit quality. Public disclosures will not show the degree of granularity that a bank uses internally. In fact, banks have latitude from regulators in implementing a credit risk rating system that is most appropriate for them. That said, understanding the internal framework is helpful, and there are some common regulatory guidelines that give us insight into this process:
Credit Quality (Public Disclosures)
There are common descriptions that banks use to describe the credit quality of loans and other risky assets. We will go over some definitions before delving into ratios that bank investors like to look at.
Nonperforming Assets (NPAs) consist of loans classified as non-accrual loans, OREO, and other nonperforming assets (such as securities). A loan will be classified as nonperforming after being a certain number of days past due (often times 90 days for commercial loans, 150 days for residential mortgages), or earlier if repayment of principal and interest is in doubt. When loans are placed on nonaccrual, accrued interest income is reversed with current year accruals charged to interest income and prior year amounts generally charged off as a credit loss. Note that it is possible that an NPA can move back to accrual status if the collectability is no longer in doubt (though this is relatively rare).
Nonperforming Loans (NPLs) consist solely of adversely classified loans, that is, the sum total of loans classified as substandard, doubtful, and loss. NPLs will typically make up the bulk of NPA balances.
Troubled Debt Restructuring (TDRs) are modified loans where a concession was provided to a borrower experiencing financial difficulties. Classification of TDRs can be tricky. Technically, TDRs can be classified as either accruing or nonaccruing loans. Nonaccruing TDRs are included in NALs, and thus NPAs, whereas accruing TDRs can be technically excluded, as expectations are for contractual principal and interest due under the restructured terms will be collected. However, for the sake of conservatism, we tend to lump TDRs into NPAs.
Other Real Estate Owned (OREO) is broken out as a line item on the balance sheet and is thus defined in our prior section on the balance sheet. For a loan secured by a real asset, OREO is the last stop on the balance sheet before a nonperformer is completely off the books. When collateral is foreclosed upon and repossessed, the loan is written off and the fair value of the collateral is brought onto the balance sheet as held-for-sale.
Loan to Value (LTV) is a term used for collateralized loans that represents the value of the loan divided by the value of the underlying collateral. Low LTVs are more conservative for two reasons: (1) The borrower is more likely to be motivated to stay current as they have more of their own equity tied to the collateral; and (2) the severity of loss may be lessened if the repossessed asset has a fair value that can cover the unpaid principal balance of defaulted loan.
NPAs/Assets shows assets classified as nonperforming as a percentage of total assets. The industry average has been declining steadily post the financial crisis of 2008 and sits at around 54 bps. This is one of the most common metrics used when describing a bank's asset quality (Exhibit 2.23).
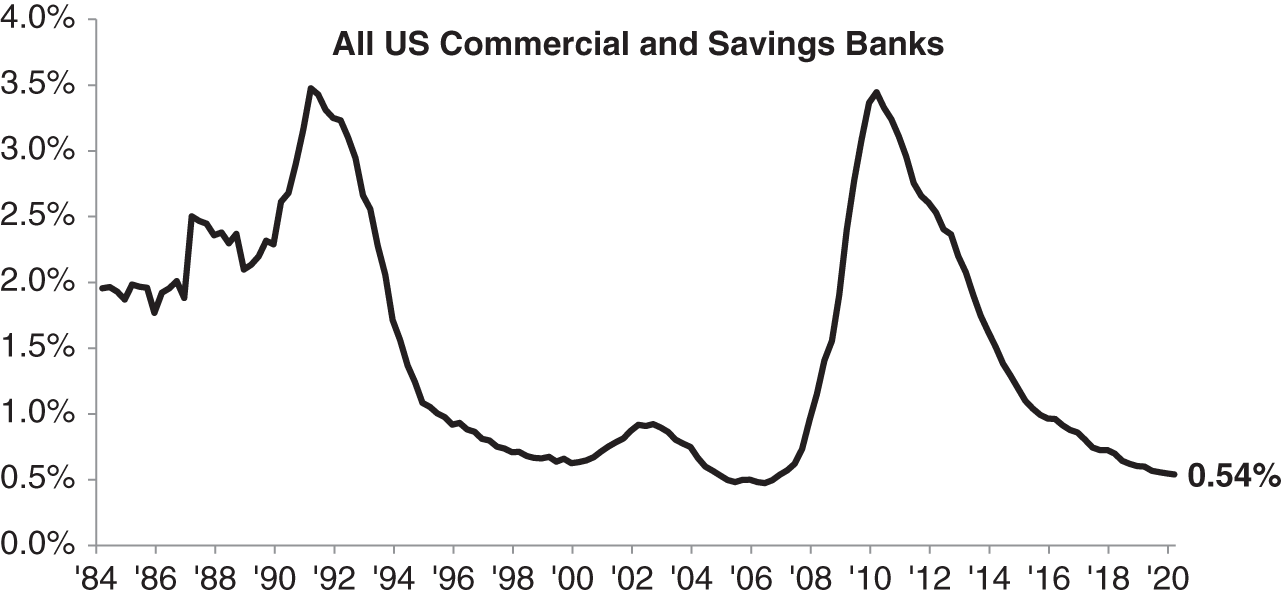
EXHIBIT 2.23 NPAs to Assets
Source: FDIC

EXHIBIT 2.24 ALLL to Total Loans
Source: FDIC
NPAs + 90 Days Past Due/Assets is a more conservative metric that includes loans that are at least 90 days past due. Remember, a loan that is 90 days past due could still be classified as accruing interest, and won't be included in NPAs. As this metric relies on stricter definitions, it is inherently less subjective, making it a helpful metric to use when making cross-sectional comparisons. Mathematically it's clear that this ratio will always be larger than just NPAs/Assets. An increase in the differential between these two ratios, however, could be a lead indicator for credit quality issues.
NPLs/Loans looks at the proportion of nonperforming loans to total loans. The NPL/Loans ratio will be higher than the entire NPAs/Assets ratio. The industry average has likewise declined steadily and is now in the 1.40% range.
Loan Loss Reserves Loans is a helpful way to judge the size of the loan loss reserve of a bank (Exhibit 2.24). For reference, the industry average is in the 1.25% range, and has trended down from the crisis peak of ∼3.65%. Remember, loan loss reserves represent management expectations on future losses, and not actual losses taken. A relatively larger LLR can provide a tailwind (albeit a temporary one) to earnings, as management normalizes the size of their LLR (as we saw post financial crisis). Conversely, an unusually light LLR could be a problem in forward periods as its replenishment will drag on expenses.
Loan Loss Reserves/NPAs is a critical metric when assessing the adequacy of the reserve (Exhibit 2.25). Since write-offs usually come from assets already classified as nonperforming, this coverage ratio will help in determining if the bank has already set aside enough reserves to cover expected losses.
NCOs/Loans gives perspective to the size of charge-offs taken by expressing it as a percentage of loans (Exhibit 2.26). For reference, the industry average is in the 50 bps range, falling from a crisis peak of around 3% in 2010. The metric is usually reported at an annualized rate. Also note that NCOs drain the reserve, so this ratio in conjunction with the LLR/Loans ratio can give us a sense at how well reserved a bank is. For instance, if we see that NCOs have been running at 20 bps of loans (annualized), and the loan loss reserve is 120 bps of loans, the reserve as-is would be able to absorb about six years of charge-offs before being completely depleted.
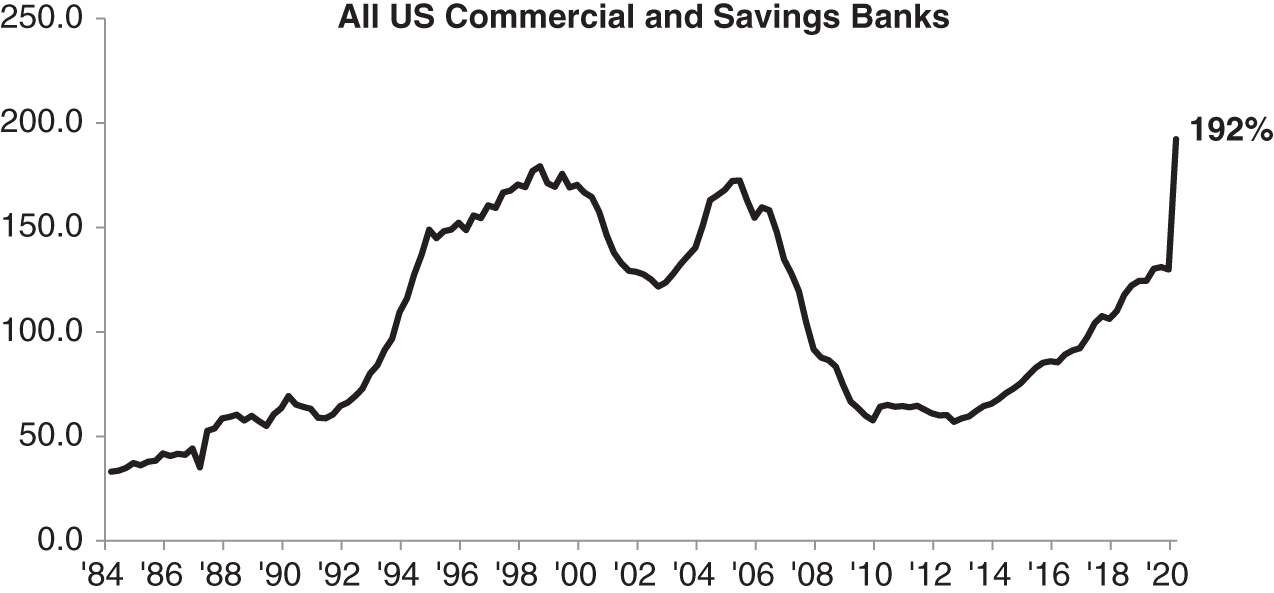
EXHIBIT 2.25 ALLL to Non-Current Loans and Leases
Source: FDIC

EXHIBIT 2.26 NCOs to Loans
Source: FDIC
LLP/NCOs is a clever metric that shows us the directional change in the size of the reserve. Recall that loan loss provisions replenish the reserve, while NCOs drain the reserve. Thus, an LLP/NCO ratio of <1 indicates a decline in the size of the reserve, and generally represents improving sentiment for credit. In 2008, this ratio hit its peak at 176%; it subsequently bottomed out in 2013 at 57% and currently sits right around 100%.
LOANS AND DEPOSITS
Drilling down into the composition of the loan book and deposit base is one of the most critical aspects of understanding a bank. As we've reiterated before, a bank's core business is to take in deposits and to make loans, thus understanding what type of loans are being underwritten and held, and what type of deposits are gathered will help us ascertain a fair value of a bank franchise.
LOAN COMPOSITION
Banks undertake an incredibly diverse spectrum of lending, from unsecured short-term loans extended to businesses for working capital to 30-year mortgages for prospective homeowners. Likewise, the structure, term, and sensitivities to underlying economic trends will vary widely. Though banks have latitude with how they categorize and report their loan balances in public disclosures, regulatory guidelines are much more strict. As a result, most banks will report similar loan categories in their Qs and Ks.
Exhibit 2.27 represents the aggregate loan composition for all FDIC insured depositories. In total, it represents over $9.7 trillion in aggregate loans as of 1Q2018. As you can see, the largest lending categories are residential mortgage, commercial and industrial, and nonfarm nonresidential real estate. Though this aggregate pie chart gives a good idea of the entire banking landscape, it is important to note that the average bank certainly won't have a loan book as well-diversified as this. In fact, most would aspire to have a portfolio as well-balanced as this one. Most community banks are specialized, whether it be in commercial lending products (CRE, C&I) or in consumer lending products (1-4 family, HELOC).
Exhibit 2.28 shows the yield and credit quality metrics by loan types for the entire industry.
1–4 Family Residential Mortgage, also called single-family residential (SFR) loans, represent mortgages extended for the purchase of single-family residences, or the refinancing of such loans. These loans are collateralized by the underlying residential property. Mortgage within the US tends to be longer-dated: 10-year or 30-year terms with fixed rate, though Adjustable Rate Mortgages (ARMs) are a popular instrument as well. ARM structures can vary; general characteristics include a fixed-rate period, a benchmark interest rate, a cap on how frequently the rate can change, how much the interest rate can change yearly, and how much the rate can cumulatively change over the entire term. For example, a 7/1 ARM is fixed for the first seven years before being adjustable once every year for the remaining term of the loan.
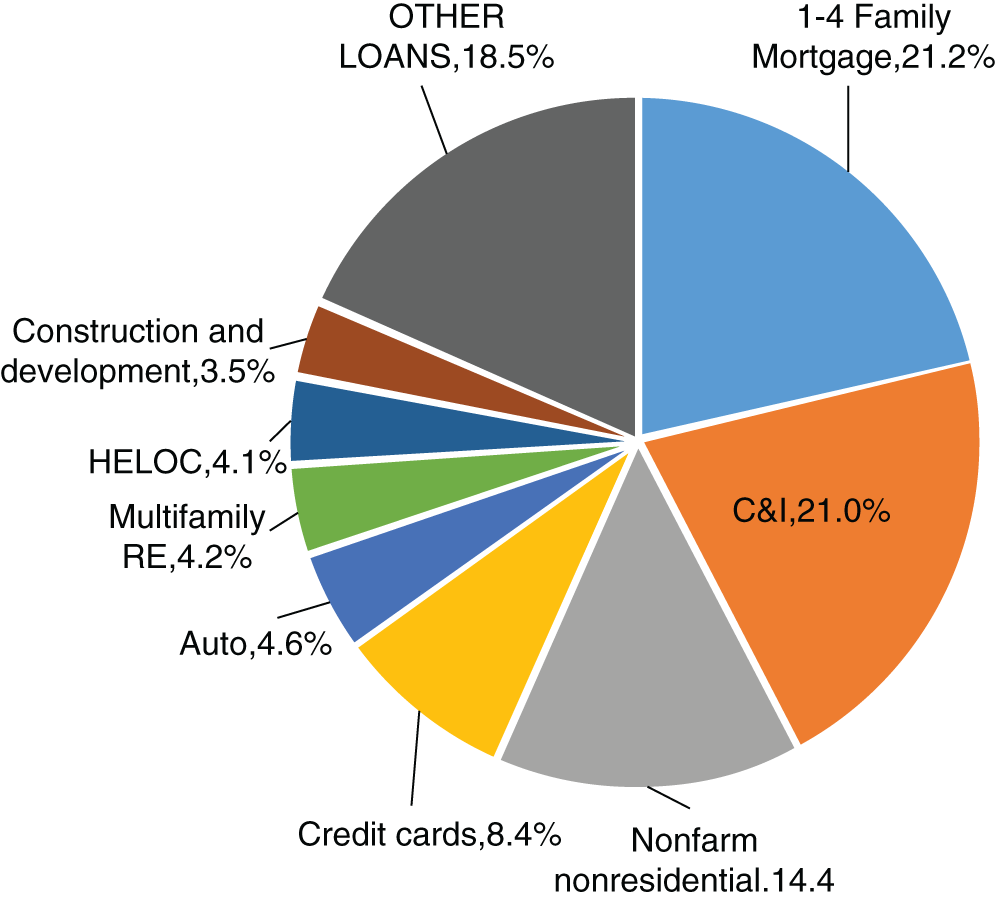
EXHIBIT 2.27 Loan Composition for All FDIC Insured Depository Institutions
Source: FDIC
Stepping back for a moment, the mortgage market in the US is by-and-large a commoditized one, and as a result it is highly competitive. Mortgage-backed securities (MBS), packaged and guaranteed by Government Sponsored Entities (GSEs) like Fannie Mae and Freddie Mac, have helped in this homogenization. Institutions can sell “conforming” loans that conform to the standards set forth by the GSEs to be later securitized and resold into the market as low risk MBS. The conforming metrics change over time and by state but include the size of the loan, the borrower's loan-to-value, credit score, debt-to-income, and other documentation requirements. The commoditization of this product is purposeful, as the Federal government has strongly promoted home ownership. The result is that SFR is very competitive and it is difficult to earn high risk-adjusted returns on this product.
We can see evidence of the long-dated nature of mortgages in FNBG's loan maturity schedule (Exhibit 2.29), over 80% of mortgage matures after five years, compared to ∼71% for the entire loan portfolio. The fixed rate nature of mortgages means the asset class tends not to benefit from rising rates (at least not immediately). Additionally, the long-dated nature of most mortgages means their pricing is usually biased towards the longer end of the yield curve. Thus in an environment where short rates are increasing but long rates are not moving much, mortgage-heavy banks tend to suffer as their funding costs increase but their loan yields do not improve.
EXHIBIT 2.28 Interest Yield and Credit Metrics by Regulatory Loan Type
Source: FDIC, S&P Global Market Intelligence
| Loans Yields & Credit Quality | Avg Balance ($000) | Income ($000) | Yield (%) | 30-89 Days Past Due | 90+ Days Past Due | Nonaccrual | Tot Past Due & Nonaccr | ||||||||
|---|---|---|---|---|---|---|---|---|---|---|---|---|---|---|---|
| % of | Balance | % of | % of | % of | |||||||||||
| Balance | Loan Type | 30-89 PD | Loan Type | 90+ PD | Balance | Loan Type | NonAccr | Balance | Loan Type | PD & NonAccr | |||||
|
2,214,159,251 | 22,612,357 | 4.09 | 22,085,551 | 1.00 | 38.11 | 27,328,397 | 1.23 | 67.15 | 28,704,556 | 1.29 | 47.60 | 78,118,504 | 3.52 | 49.14 |
|
2,036,940,818 | 23,123,460 | 4.54 | 275.052 | 0.40 | 0.47 | 32,933 | 0.05 | 0.08 | 275,064 | 0.40 | 0.46 | 583,049 | 0.84 | 0.37 |
|
1,755,443,558 | 19,144,686 | 4.36 | 971,161 | 0.38 | 1.68 | 129,975 | 0.05 | 0.32 | 1,086,563 | 0.43 | 1.80 | 2,187,699 | 0.86 | 1.38 |
|
701,909,860 | 23,385,166 | 13.33 | 1,246,213 | 0.39 | 2.15 | 162,908 | 0.05 | 0.40 | 1,361,627 | 0.42 | 2.26 | 2,770,748 | 0.86 | 1.74 |
|
740,826,919 | 9,484,141 | 5.12 | 451,643 | 0.13 | 0.78 | 37,679 | 0.01 | 0.09 | 435,014 | 0.13 | 0.72 | 924,336 | 0.28 | 0.58 |
|
71,208,950 | 761,635 | 4.28 | 2,152,910 | 0.43 | 3.71 | 398,193 | 0.08 | 0.98 | 4,443,315 | 0.88 | 7.37 | 6,994,418 | 1.38 | 4.40 |
|
124,672,417 | 1,254,795 | 4.03 | 2,057,896 | 0.26 | 3.55 | 307,701 | 0.04 | 0.76 | 2,853,655 | 0.36 | 4.73 | 5,219,252 | 0.65 | 3.28 |
|
906,499,941 | 7,623,943 | 3.36 | 3,149,339 | 0.30 | 5.43 | 321,788 | 0.03 | 0.79 | 1,872,793 | 0.18 | 3.11 | 5,343,920 | 0.52 | 3.36 |
| Total Loans & Leases | 8,999,459,664 | 112,006,305 | 4.98 | 697,803 | 0.70 | 1.20 | 223,087 | 0.22 | 0.55 | 1,379,152 | 1.39 | 2.29 | 2,300,042 | 2.32 | 1.45 |
EXHIBIT 2.29 FNBG Loan Composition
Source: FNBG 2017 10-K
| TABLE 9 | ||||
|---|---|---|---|---|
| (Dollar amounts in thousands) | Maturing Within 1 Year | Maturing After 1 But Within 5 Years | Maturing After 5 Years | Total |
| Commercial real estate | $ 25,702 | $ 76,323 | $354,967 | $456,992 |
| Real estate construction | 27,279 | 4,740 | 3,187 | 35,206 |
| Real estate multi family | 3,130 | 18,892 | 83,116 | 105,138 |
| Real estate 1–4 family | 11,007 | 22,777 | 139,692 | 173,476 |
| Commercial & industrial | 33,604 | 17,958 | 4,165 | 55,727 |
| Consumer | 1,294 | 391 | 12,372 | 14,057 |
| Sub total | 102,016 | 141,081 | 597,499 | 840,596 |
| Net deferred loan fees | (104) | (323) | (232) | (659) |
| Total | $101,912 | $140,758 | $597,267 | $839,937 |
| With predetermines fixed interest rates | $ 15,459 | $ 55,977 | $195,757 | $267,193 |
| With floating interest rates | 86,453 | 84,781 | 401,510 | 572,744 |
| Total | $101,912 | $ 140,758 | $597,267 | $839,937 |
Commercial & Industrial (C&I) loans are simply loans extended to business and corporations. C&I comes in many flavors: They can be secured (other than by real estate) or unsecured, single-payment or installment, and fixed or floating. Generally, C&I loans are extended to small businesses, as larger entities have the ability to tap the capital markets directly for more favorable pricing. Generally, C&I loans tend to be shorter term in nature, with many of them floating-rate and tied to LIBOR or Prime. As a result, a rising interest rate environment benefits C&I loans more so than other types of loans, and bank investors will naturally flock to those banks that specialize in that type of lending.
As we mentioned, C&I is not a homogenous category. Some more popular ways of slicing up business loans include:
- Working Capital/Seasonal Loans – As the name suggests, these are shorter term loans extended to companies to fulfill seasonal or short-term cyclical capital needs. These can be secured or unsecured, though usually they are secured by accounts receivable or inventory.
- Term Loans – These loans are typically used to finance the acquisition of long-term capital assets, such as property, plant, and equipment. Term loans are longer-term in nature and can match the depreciable or useful life of the asset being financed. Again, these loans tend to be secured.
- Asset Based Financing refers to loans (both working capital and term) that are secured by collateral.
- SBA Loans are small business loans guaranteed by the Small Business Administration (SBA), a government agency that provides support to entrepreneurs and small businesses. SBA loans have to conform to the standards set forth by the SBA to qualify for a partial guarantee (usually 75–85% of the loan balance). SBA Loan programs include: 7(a)-, which is the most popular type of SBA lending and provides working capital needs for up to $5MM; 504-, which finances the purchasing of owner-occupied CRE; CAPLines for lines of credit; Export Loans for export financing; Microloans for working capital needs up to $50K; and Disaster Loans for companies that have been impacted by a declared natural disaster.
Commercial Real Estate (CRE) loans are essentially mortgage loans secured by a lien on a commercial property. Broad categories of commercial properties include office, retail, industrial, hospitality, and residential (as in residential buildings used to generate profits through rental or sale). In terms of interest rate sensitivity, much of the CRE financing provided by banks is on a floating-rate basis, while the term is usually shorter than in residential mortgage but longer than in C&I. Loan-to-Values for commercial real estate loans has regulatory limits that ranges from 65% (undeveloped land) up to 90% (owner-occupied).
Non-owner Occupied CRE is commercial property that is occupied by tenants other than the owner. This is the most classic type of CRE. The bank will focus more on analyzing the expected cash flows at the property level during its underwriting process.
Owner-occupied CRE is a commercial property where the owner is also the primary occupant (other than residential). Since the income at the property level is very much dependent on the cash flows of the owner, owner-occupied CRE loans can interpreted as a commercial loan that is collateralized by property. Thus, the underwriter will look more closely at the credit worthiness and projected cash flows of the owner-occupier, as opposed to being more focused on property level metrics.
We can see that our example bank, FNBG, is primarily a CRE lender as over 50% of loans are categorized as CRE.
DEPOSIT COMPOSITION
Deposits are arguably the marquee feature of a bank, giving them a substantial funding advantage over other types of lenders and representing a significant differentiating factor between banks. A good deposit franchise will be low cost, with low sensitivity to rising interest rates, and “sticky” with regards to flows. There are a few important deposit types that a bank has, each with its own unique features and sensitivities (Exhibit 2.30).
Transaction Accounts, as defined by the Federal Reserve, represent a bank account type that allows full and immediate access to funds with no delays or waiting periods. The positive side is that these types of accounts generally pay lower rates of interest. In fact, many deposit accounts pay zero interest. Transaction accounts are often the primary bank account for individuals and businesses, meaning there is a stickier and deeper relationship, which contributes to franchise value. The minor negative is that regulators require higher level of reserves for these deposits to ensure the liquidity of the depositor. However, the funding advantage more than makes up for the drag from the reserve requirement. According to the FDIC, transaction accounts make up about 18% of total domestic deposits.
Transaction accounts include Demand Deposit accounts and Negotiable Order of Withdrawal (NOW) accounts. Demand Deposits are payable on demand with no limit on the number of withdrawals or transfers that the account holder can make. These types of accounts are particularly sought after for commercial relationships. NOW accounts have pretty much the same characteristics except the bank reserves the right at any time to require at least seven days' prior written notice of an intended withdrawal. This type of deposit has become rarer in recent years.
Savings Accounts are interest-bearing deposits that provide a modest interest rate to depositors, but in turn, limit the number of “convenient” withdrawals or transactions that can be done per month to six. The bank also reserves the right to require seven days' advance written notice of an intended withdrawal (however this is rarely exercised).
Money Market Accounts and Money Market Demand Accounts (MMDAs) offer higher interest rates than savings and demand deposits, but generally require higher minimums and provide fewer transactions per month for the depositor. Before the mid-1980s, MMDAs had more distinctive characteristics from ordinary savings accounts; however, now they are more-or-less the same.
Time deposits are also known as certificates of deposits (CDs) or term deposits, and carry a fixed maturity date paying a specified interest rate. A CD restricts access to funds until the maturity date, and as a result, pays a higher level of interest. Bank investors typically do not assign a lot of value to CDs. Depositors view them more like an investment vehicle, resulting in a very price competitive market for CDs. On the plus side, CDs can be raised relatively quickly; all it takes is a temporary promotion offering higher than market rates to attract deposits. Time deposits have early withdrawal penalties, which dissuade depositors from withdrawing money early. This is helpful in a low-rate environment, as a bank can “lock-in” low-cost funding. A bank and bank investors need to be wary of the maturity schedule for time deposits in order to assess liquidity and interest rate risk. Banks will also break out “jumbo” and “regular” CDs, with the delineation at $100,000.
EXHIBIT 2.30 Deposit Composition
Source: FDIC
| Table CB15 | |||||||||||||
|---|---|---|---|---|---|---|---|---|---|---|---|---|---|
| Federal Deposit Insurance Corporation | |||||||||||||
| Deposits FDIC-Insured Commercial Banks US and Other Areas | |||||||||||||
| Balances at Year End, 1934–2017 | |||||||||||||
| (Dollar amounts in thousands) | |||||||||||||
| Year | Deposits / Domestic and Foreign | Domestic Office Deposits | |||||||||||
| Individuals, Partnerships and Corporations | US Government | States & Political Sub-divisions | All Other | Total Deposits, Domestic & Foreign | Memo | Demand | Savings | Time | Total Domestic Deposits | Memo | |||
| Interest Bearing | Non-Interest Bearing | Transaction | Non-Transaction | ||||||||||
| 2017 | 11,413,864,817 | 3,828,989 | 510,393,409 | 540,093,848 | 12,468,181,063 | 9,183,512,354 | 3,284,668,753 | 1,682,242,133 | 7,957,282,289 | 1,511,045,923 | 11,150,570,345 | 2,026,778,720 | 9,123,791,625 |
Brokered deposits are defined by the FDIC as a deposit that is obtained (directly or indirectly) through the mediation or assistance of a deposit broker. Brokered deposits can be a suitable funding source, but as they do not require any direct relationship with a deposit customer, they are generally not assigned much value by bank investors. Additionally, a study by the FDIC in 2011 concluded that shares of brokered deposit funding used at failed institutions were significantly higher than at non-failed institutions during the past three bank crises. Interestingly, the study found that on average brokered deposits are an indicator of higher risk appetite, which drove higher growth and higher subsequent nonperforming loan ratios. See the link below for the study.
https://www.fdic.gov/regulations/reform/coredeposit-study.pdf
Banks will provide a similar table to Exhibit 2.31 that provides the average balances and rates for different deposit categories. Our example bank, FNBG, has a decent deposit franchise with only 27 bps in average cost, 29% in noninterest-bearing demand deposits, and only a relatively small 12% reliance on time deposits.
EXHIBIT 2.31 Average Rates by Deposit Type
Source: FNBG
| TABLE 12 | |||
|---|---|---|---|
| Average Deposits | |||
| 2017 | |||
| (Dollar amounts in thousands) | Average Balance | Average Rate | % of total Deposits |
| Interest-bearing demand | $ 124,267 | 0.10% | 12% |
| Money market | 395,960 | 0.39% | 38% |
| Savings | 88,249 | 0.10% | 9% |
| Time deposits $100,000 or more | 89,594 | 0.91% | 9% |
| Time deposits under $I00,000 | 34,377 | 0.66% | 3% |
| Total interest bearing deposits | 732,447 | 0.38% | 71% |
| Demand deposits | 300,670 | — | 29% |
| Total deposits | $1,033,117 | 0.27% | 100% |
REGULATORY FILINGS
Public regulatory filings provide bank investors with additional financial data to use in their analysis. The two main benefits bank investors enjoy from regulatory filings are (1) advantageous timing compared to SEC filings and (2) the standardized nature of the forms and schedules, which make cross-sectional analysis more straightforward. However, we must be cognizant that regulatory filings do not necessarily reconcile with those made by public companies to the SEC. The two most helpful regulatory filings specific to banks that we will go over are the FFIEC Call Reports and the Federal Reserve Y-9s.
Call Reports, specifically forms FFIEC 031 and FFIEC 041, are required by every national bank, state member bank, insured state nonmember bank, and savings association. The Federal Financial Institutions Examination Council (FFIEC) is an interagency body that oversees the call reporting process required for all regulated depositories. Call reports are filed for the bank level entity, which means it might not match up one-for-one to bank holding company (BHC) level financials. Additionally, certain BHCs have multiple bank charters/subsidiaries, meaning multiple call reports for one entity.
Call reports are due 30 days after the end of the quarter. While in most cases the call reports come after the earnings release and before the filing of the 10-Q and 10-K, in some cases the call reports are available before the earnings release. Tracking this can sometimes give the investor an advantage.
FR Y-9s are financial reports that are required by the Federal Reserve for domestic bank holding companies. In 1985, the Y-9 reports were revised to parallel the call reports, thus the reporting fields are nearly identical to those in the call reports. FR Y-9's come in a variety of flavors.
- The FR Y-9Cs are required by domestic BHCs with total consolidated assets of $1 billion or more and all multibank holding companies with debt outstanding to the general public or engaged in certain nonbanking activities. These filings are done on a consolidated basis, making them the most useful filing for bank investors.
- The FR Y-9LPs are parent-company only financial statements for large BHCs.
- The FR Y-9SPs are parent-company only financial statements for small BHCs with below $1B in consolidated assets. These reports are only made on a semi-annual basis.
We recommend readers review an interesting academic study on the market reaction to bank regulatory reports:
Badertscher, B.A., Burks, J.J. & Easton, P.D. “The market reaction to bank regulatory reports.” Rev Account Stud 23, 686–731 (2018).
https://doi.org/10.1007/s11142-018-9440-8
Exhibit 2.32 is a reconciliation between the matching schedules in the call report and Y-9s.
The income schedules are analogous to the income statement, showing financial performance metrics over a period of time. In addition, the schedule will have a detailed table on charge-offs and its effects on the loan loss reserve. Meanwhile, the report of condition is related to all things balance sheet. That is, it provides information on the financial conditions of a bank at a specific point in time. Since banks are balance sheet driven entities, and regulators are concerned with the financial health of an entity, these schedules are substantially longer and more comprehensive than the income schedules. Specifically, there is enhanced granularity when it comes to the nonperforming assets on the balance sheet.
EXHIBIT 2.32 Call Report and Y-9s
| Call Report | Y-9 | |
|---|---|---|
| Income Statement | Schedule RI—Income Statement | Schedule HI—Consolidated Income Statement |
| Schedule RI-A—Changes in Bank Equity Capital | Schedule HI-A—Changes in Equity Capital | |
| Schedule RI-B—Charge-offs and Recoveries on Loans and Leases and Changes in ALLL | Schedule HI-B—Charge-Offs and Recoveries on Loans and Leases and Changes in ALLL | |
| Schedule RI-C—Disaggregated Data on the Allowance for Loan and Lease Losses | Schedule HI-C—Disaggregated Data on the Allowance for Loan and Lease Losses | |
| Schedule RI-E—Explanations | ||
| Balance Sheet | Schedule RC—Balance Sheet | Schedule HC—Consolidated Balance Sheet |
| Schedule RCA—Cash and Balances Due from Depository Institutions | - | |
| Schedule RC-B—Securities | Schedule HC-B—Securities | |
| Schedule RC-C—Loans and Lease Financing Receivables | Schedule HC-C—Loans and Lease Financing Receivables | |
| Schedule RC-D—Trading Assets and Liabilities | Schedule HC-D—Trading Assets and Liabilities | |
| Schedule RC-E—Deposit Liabilities | Schedule HC-E—Deposit Liabilities | |
| Schedule RC-F—Other Assets | Schedule HC-F— Other Assets | |
| Schedule RC-G—Other Liabilities | Schedule HC-G—Other Liabilities | |
| - | Schedule HC-H—Interest Sensitivity | |
| Schedule HC-I—Insurance-Related Underwriting Activities (Including Reinsurance) | ||
| Schedule RC-K—Quarterly Averages | Schedule HC-K—Quarterly Averages | |
| Schedule RC-L—Derivatives and Off-Balance Sheet Items | Schedule HC-L—Derivatives and Off-Balance Sheet Items | |
| Schedule RC-M—Memoranda | Schedule HC-M—Memoranda | |
| Schedule RC-N—Past Due and Nonaccrual Loans, Leases, and Other Assets | Schedule HC-N—Past Due and Nonaccrual Loans, Leases, and Other Assets | |
| Schedule RC-O—Other Data for Deposit Insurance and FICO Assessments | - | |
| Schedule RC P—1-4 Family Residential Mortgage Banking Activities | Schedule HC-P—Closed-End 1-4 Family Residential Mortgage Banking Activities | |
| Schedule RC-Q—Assets and Liabilities Measured at Fair Value on a Recurring Basis | Schedule HC-Q—Financial Assets and Liabilities Measured at Fair Value | |
| Schedule RC-R—Regulatory Capital | Schedule HC-R—Regulatory Capital | |
| Schedule RC-S—Servicing, Securitization, and Asset Sale Activities | Schedule HC-S—Servicing, Securitization, and Asset Sale Activities | |
| Schedule RC-T—Fiduciary and Related Services | - | |
| Schedule RC-V—Variable Interest Entities | Schedule HC-V—Variable Interest Entities |
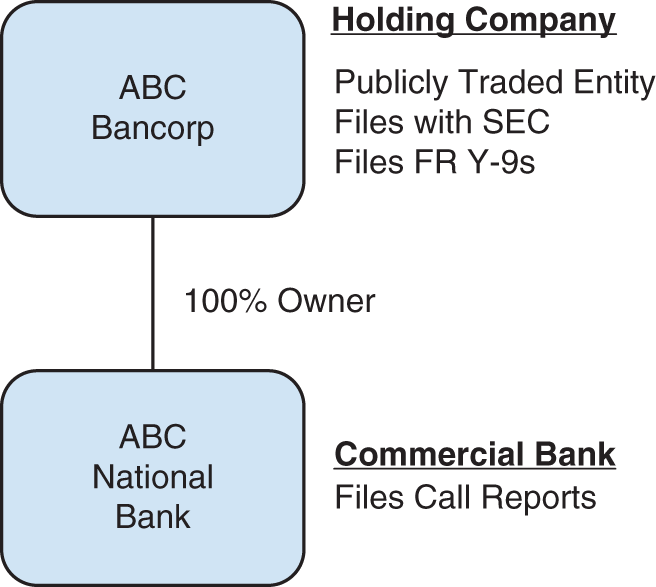
EXHIBIT 2.33 Who Files What
As a refresher, Exhibit 2.33 is a diagram showing the most common type of organization structure, a simple one-bank holding company structure. The wholly owned commercial bank is the entity that files call reports, while the holding company files Y-9s.
Reconciliation Example
We will look at how the call report, Y-9, and 10-K financial tables match up for our example bank, FNBG, which is structured as a simple one-bank holding company (Exhibits 2.34, 2.35, 2.36 and 2.37).
We can see that the constituents of spread revenues, interest income, and interest expense items line up pretty closely. Total interest income is virtually identical between the call report, Y-9C, and 10-K. Meanwhile, total interest expense differs by $214,000 on the call report. This is because there is outstanding debt at the bank holding company level, thus the interest expense on that debt does not show up at the bank level call reports. Provision for loan losses match up, and is one of the more important insights one can glean from the call reports, as it rarely differs from the BHC.
On to the noninterest-related items: Fee revenues line up fairly directly. One note: Realized gains on AFS securities are not included in the noninterest income subtotal for the call report and Y-9, but are included in the 10K. Meanwhile, call report expenses are a bit lower than on the consolidated financials. This is usually the case as there will be some separate expenses that the holding company recognizes.
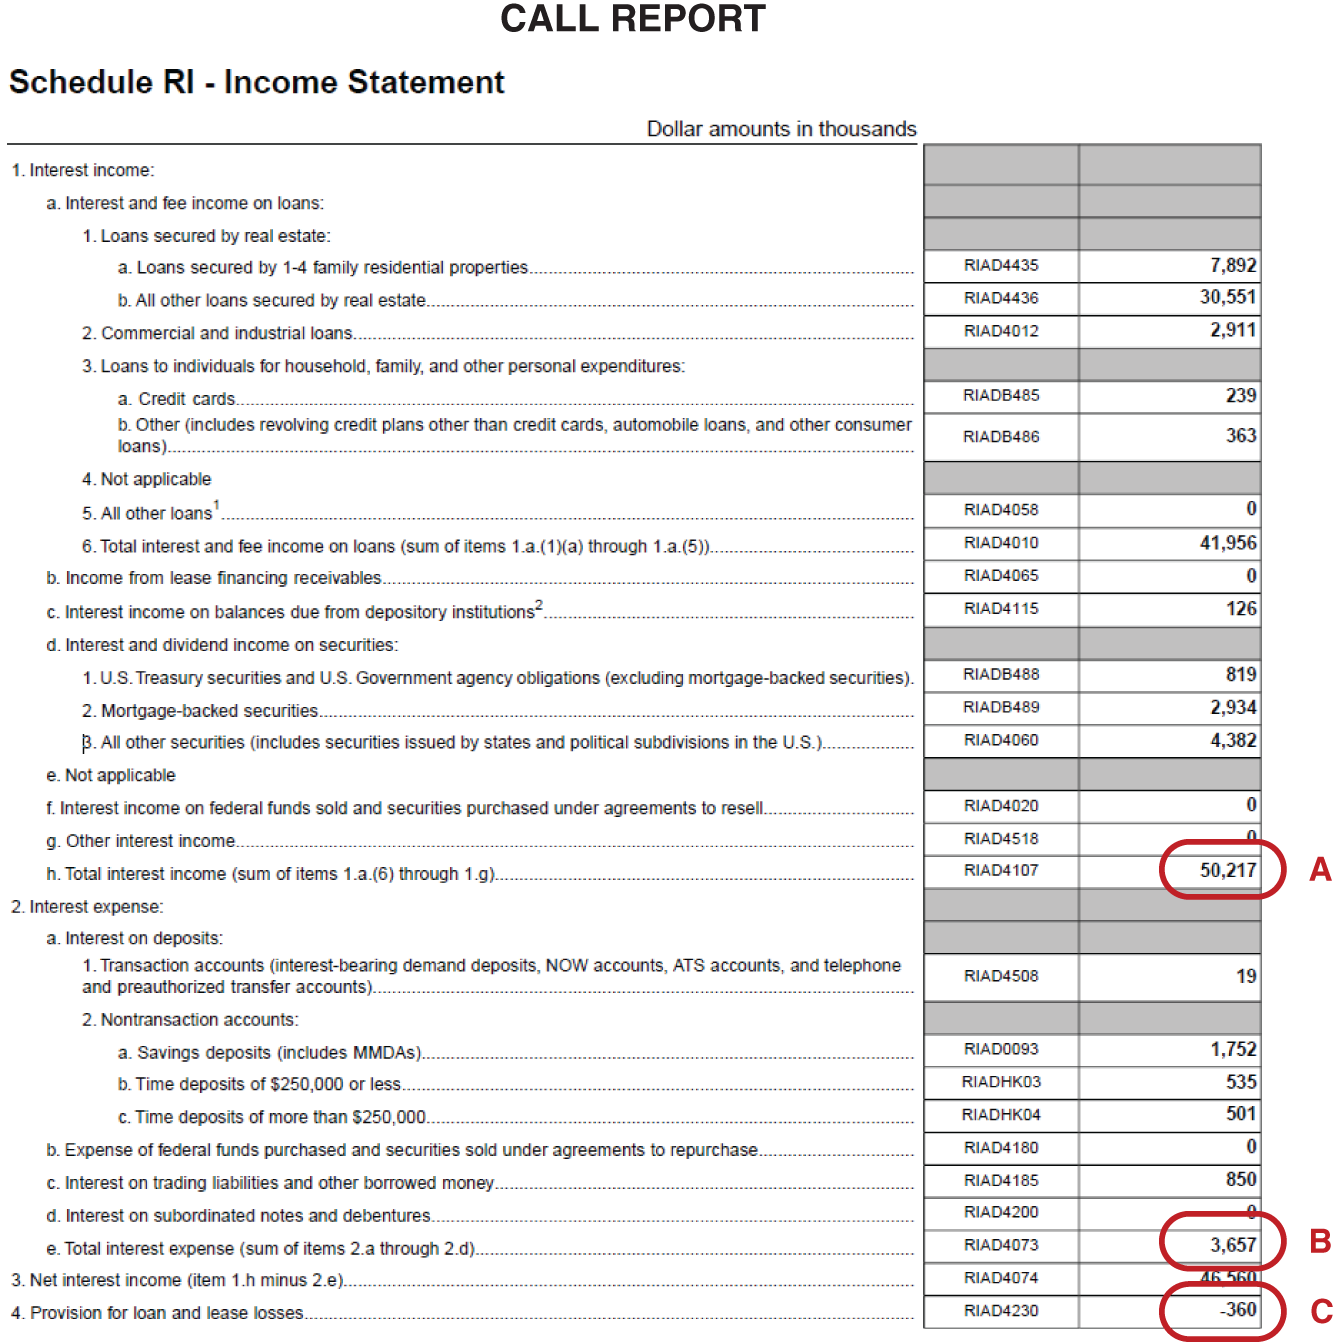
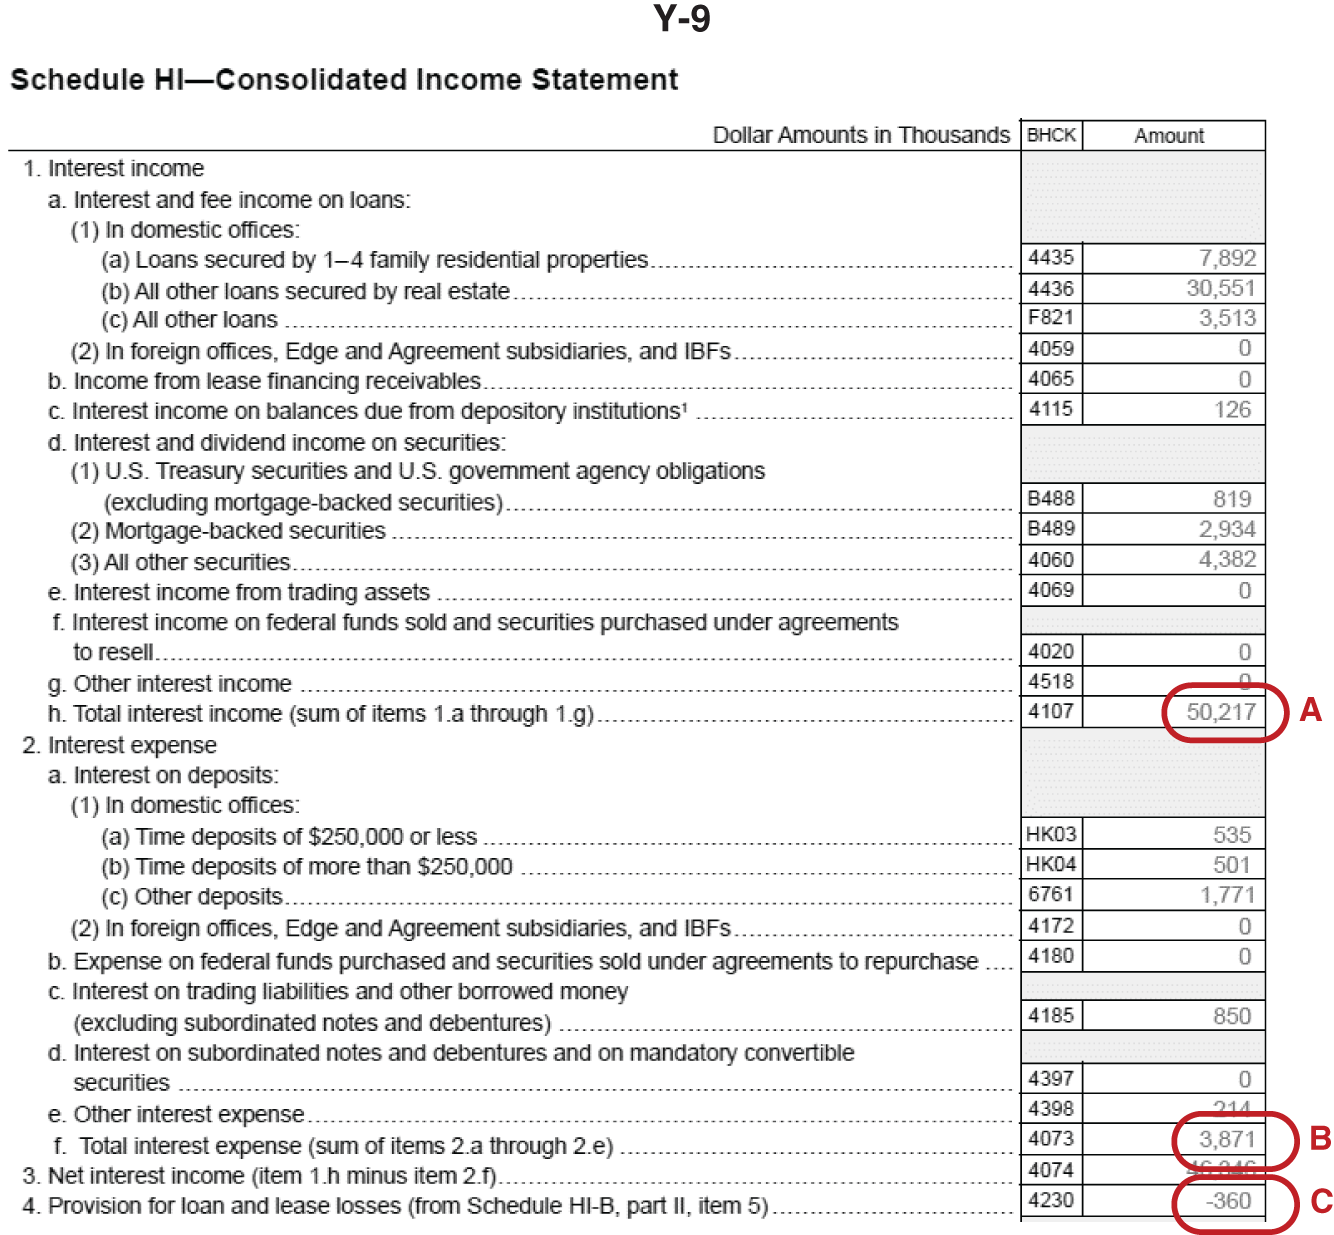

EXHIBIT 2.34 Income Statement – A
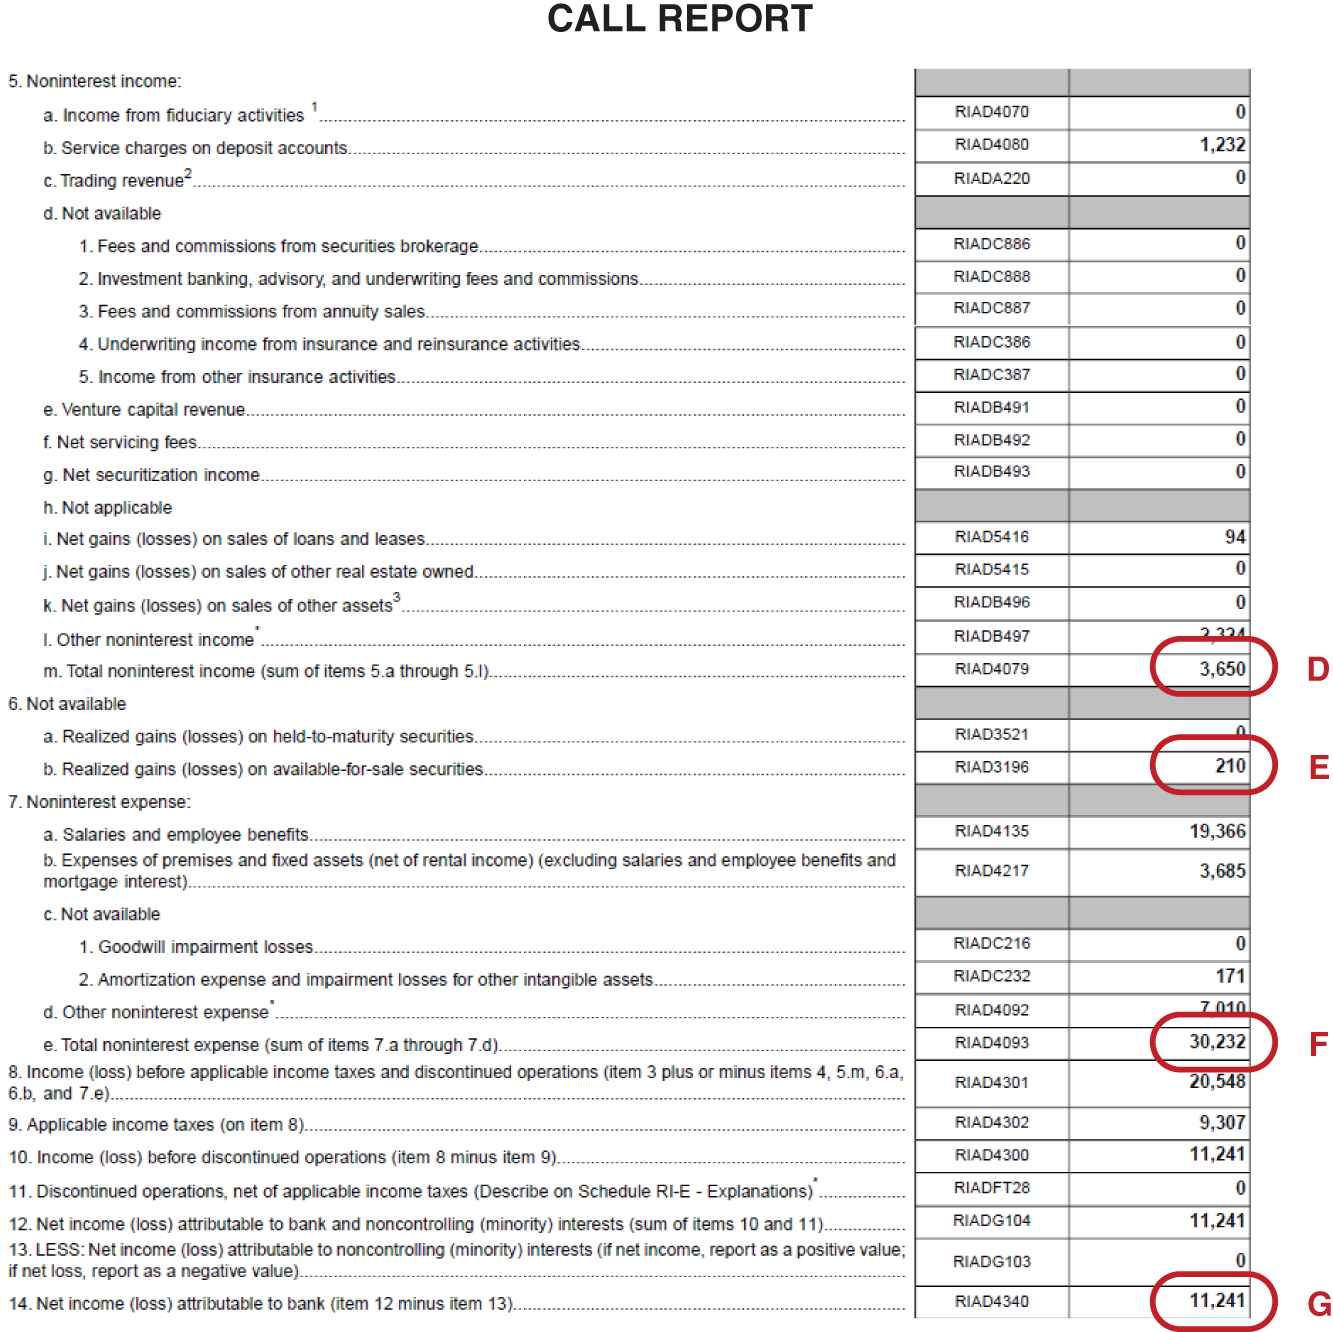
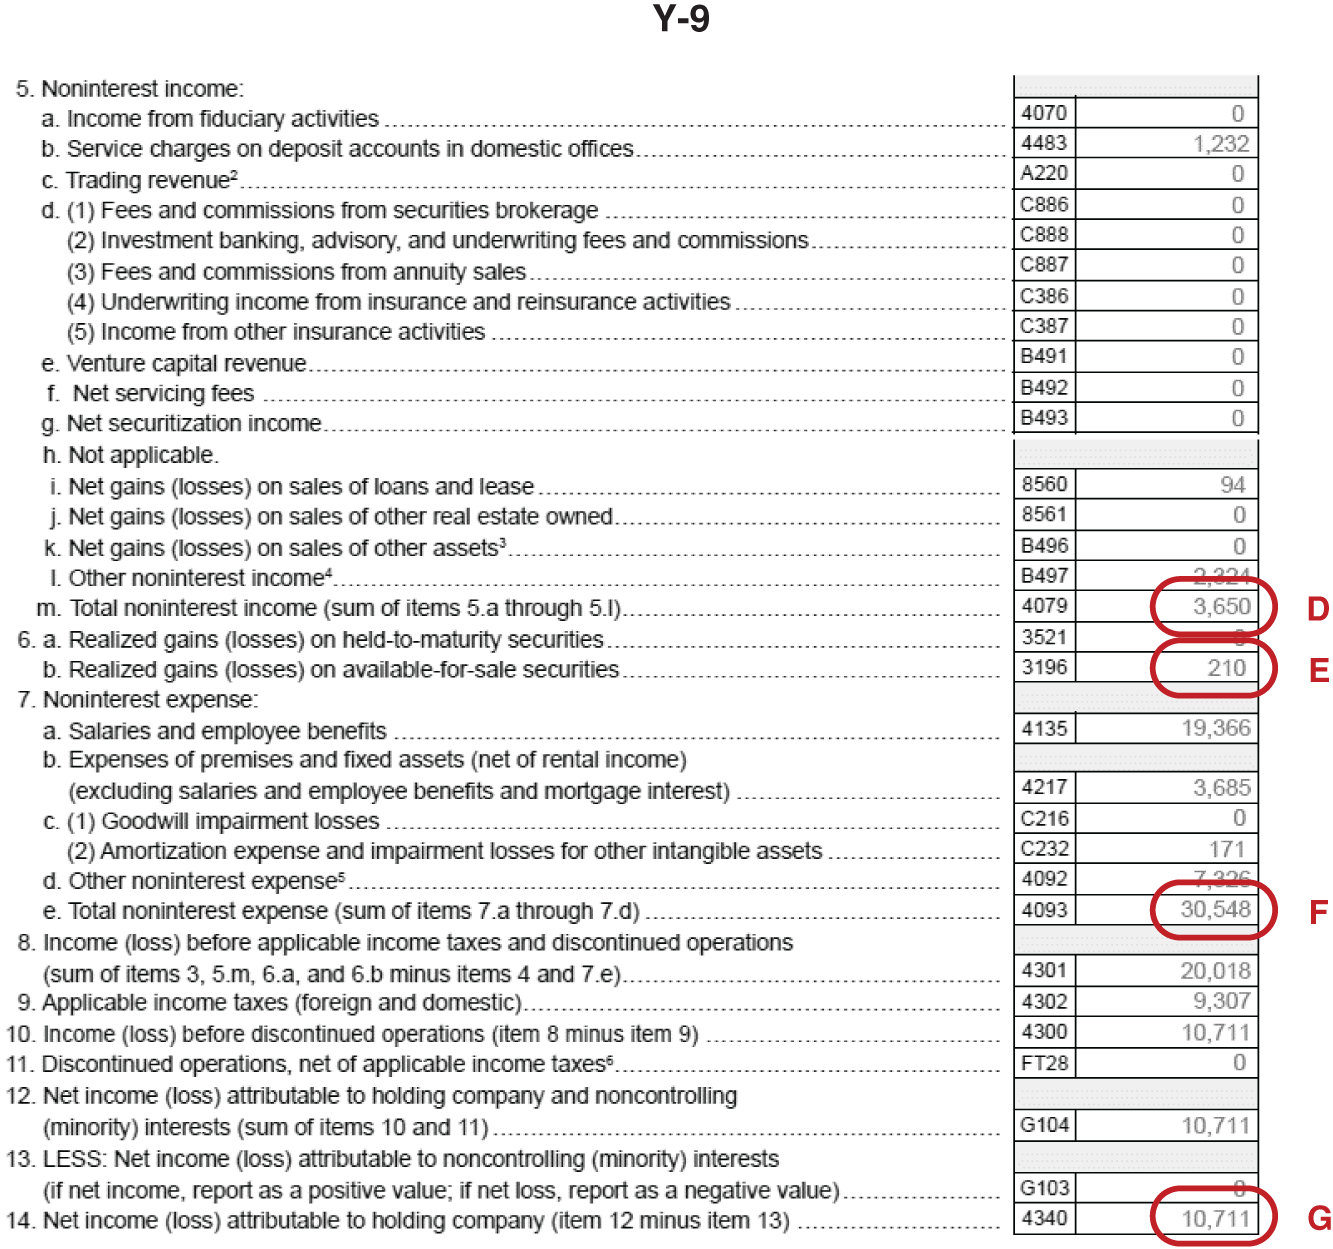
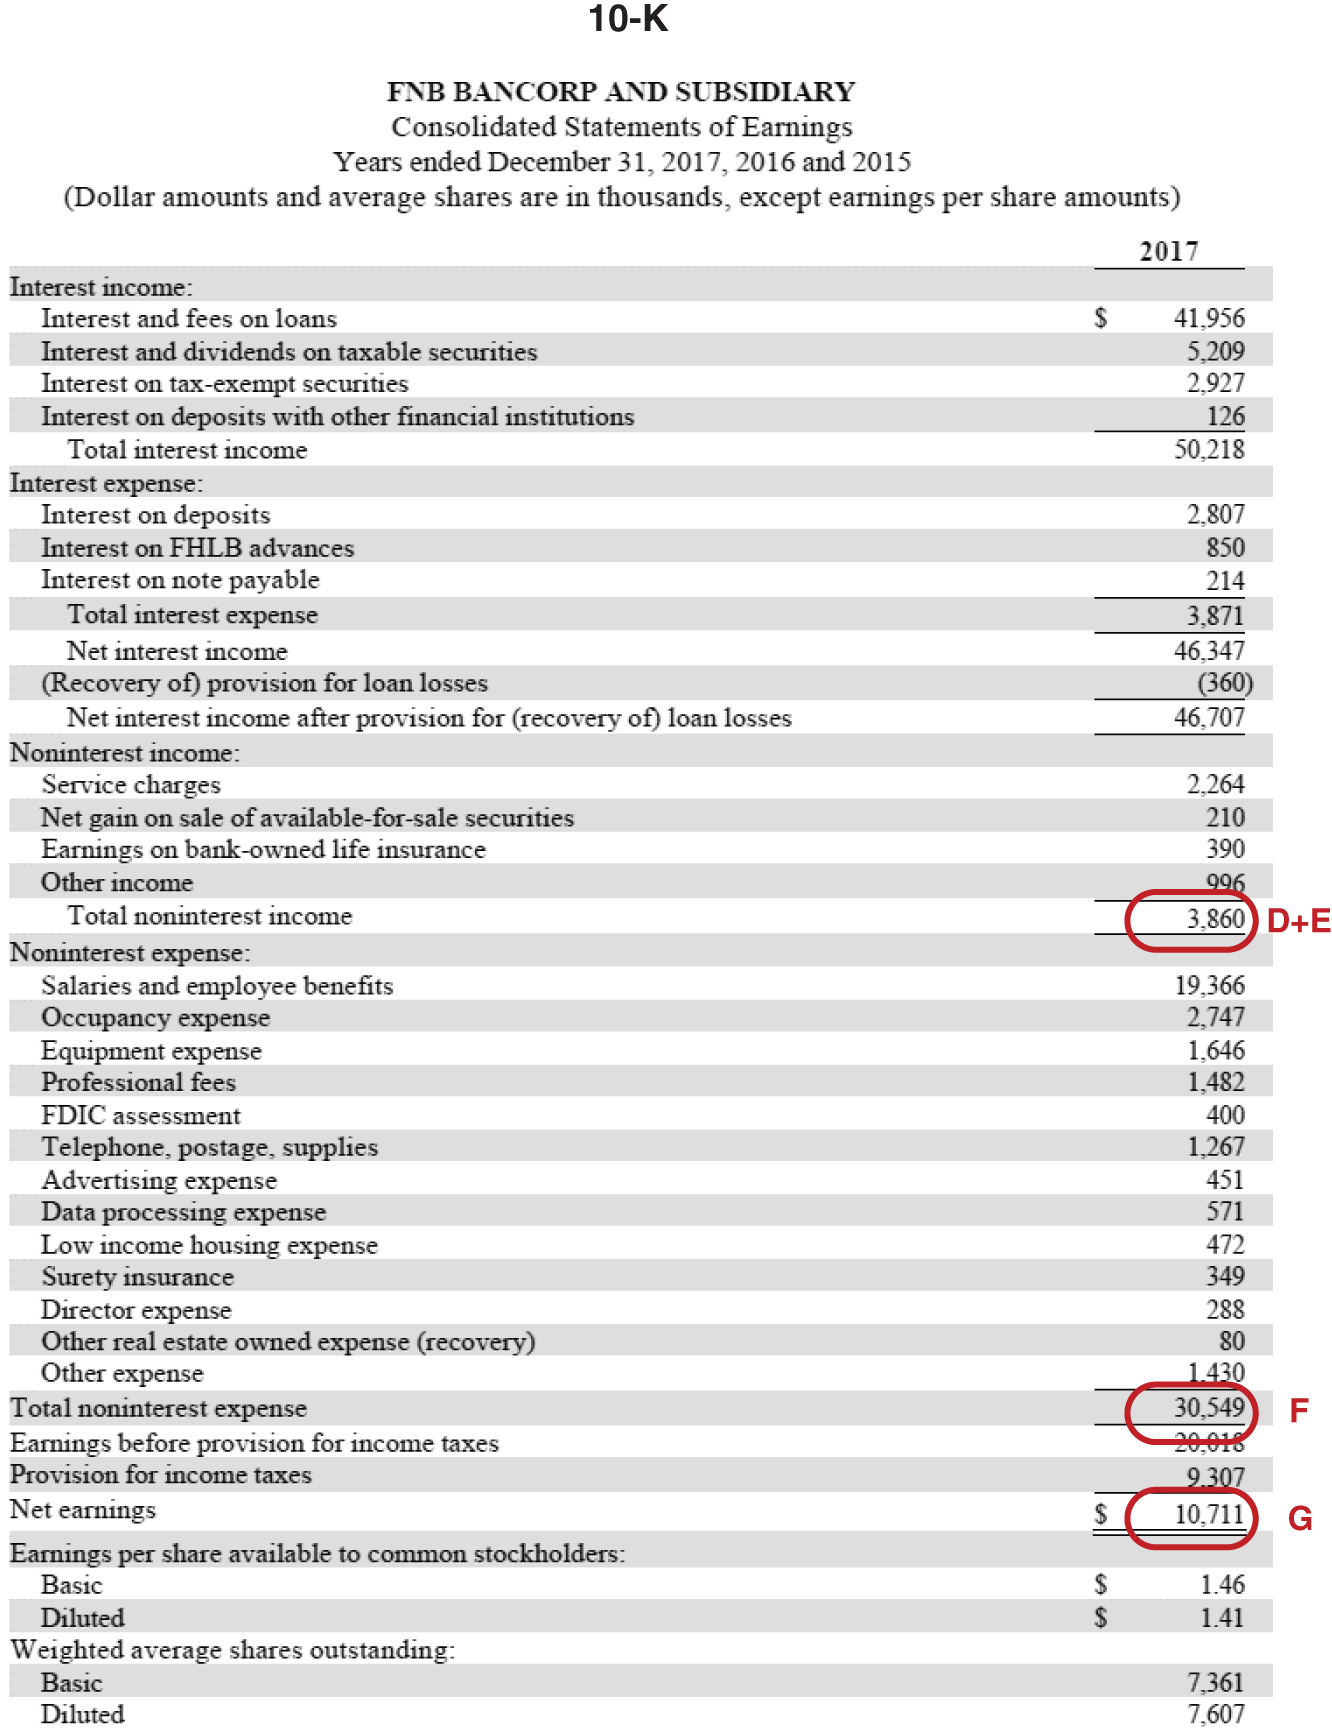
EXHIBIT 2.35 Income Statement – B


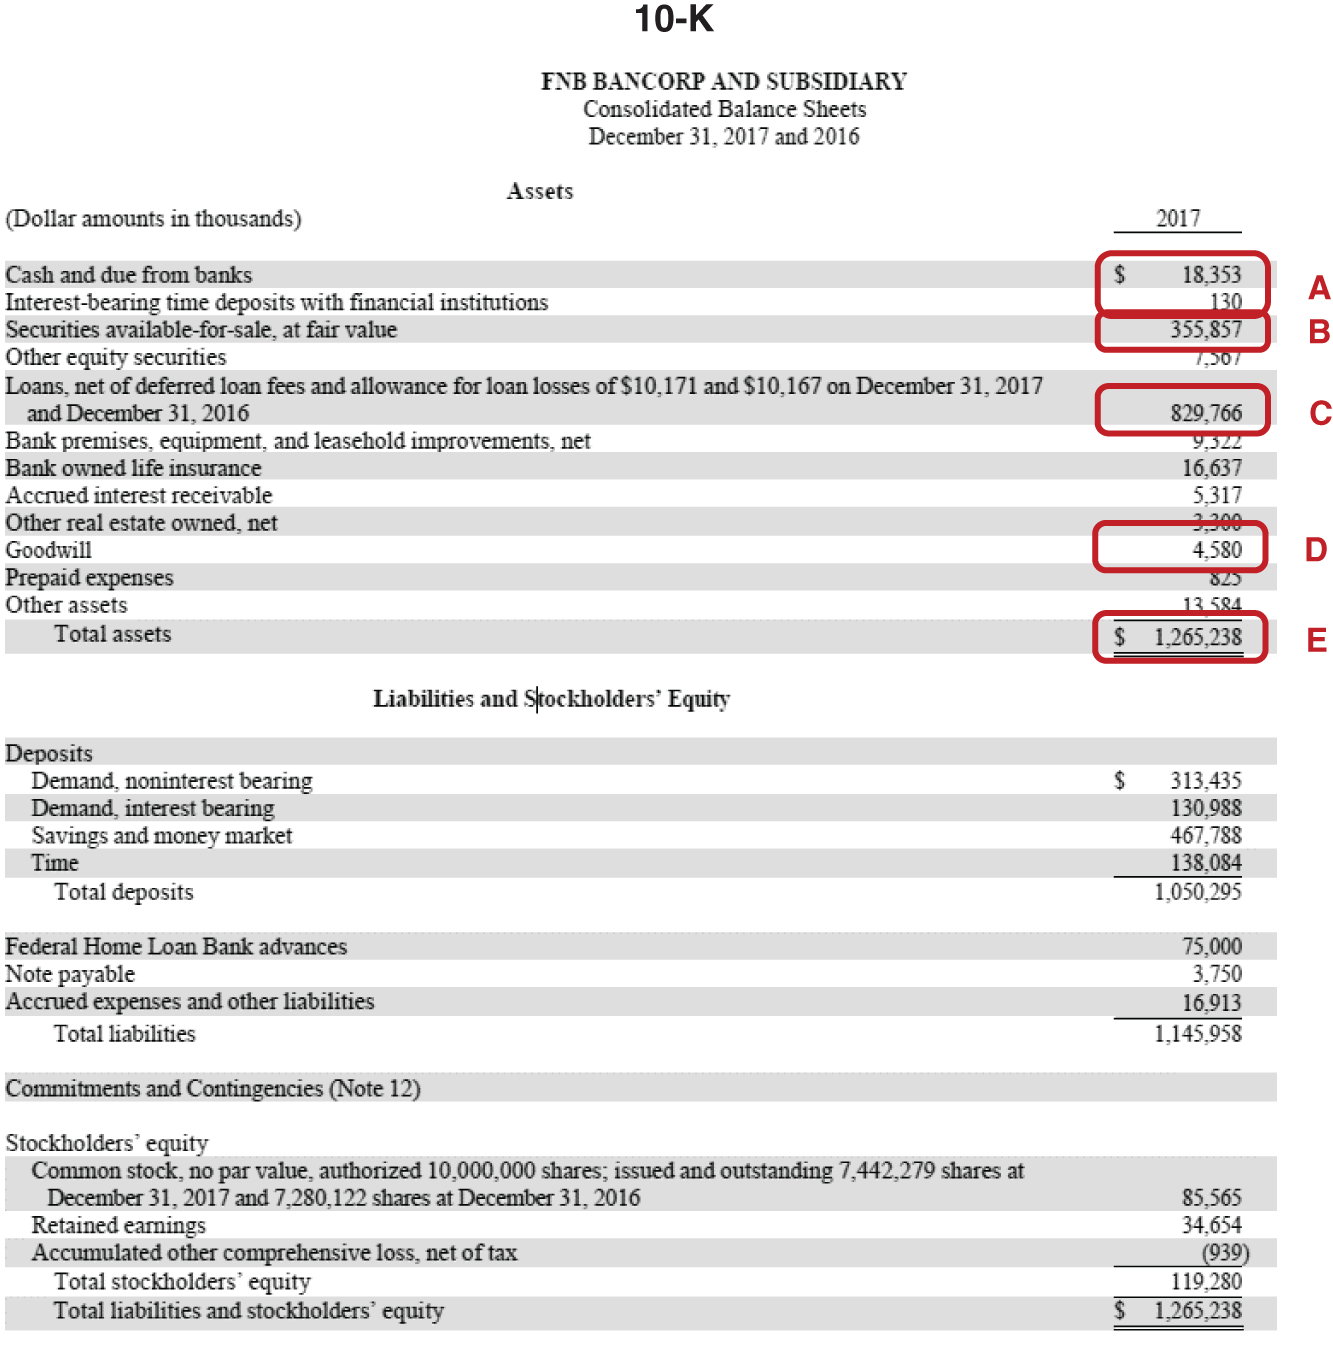
EXHIBIT 2.36 Balance Sheet – A
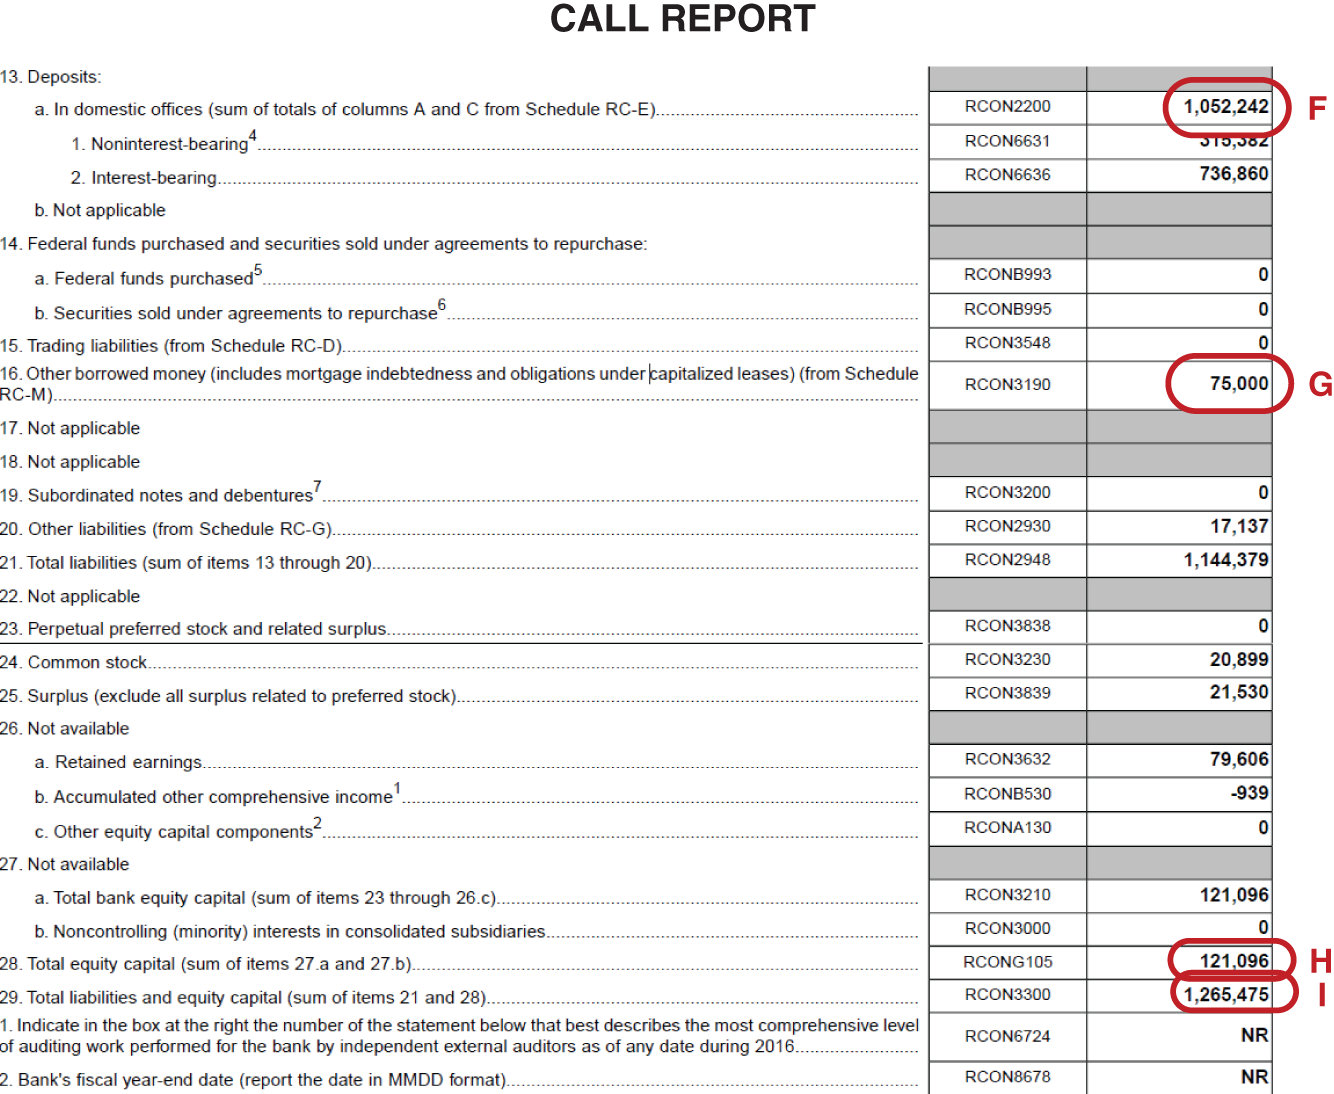

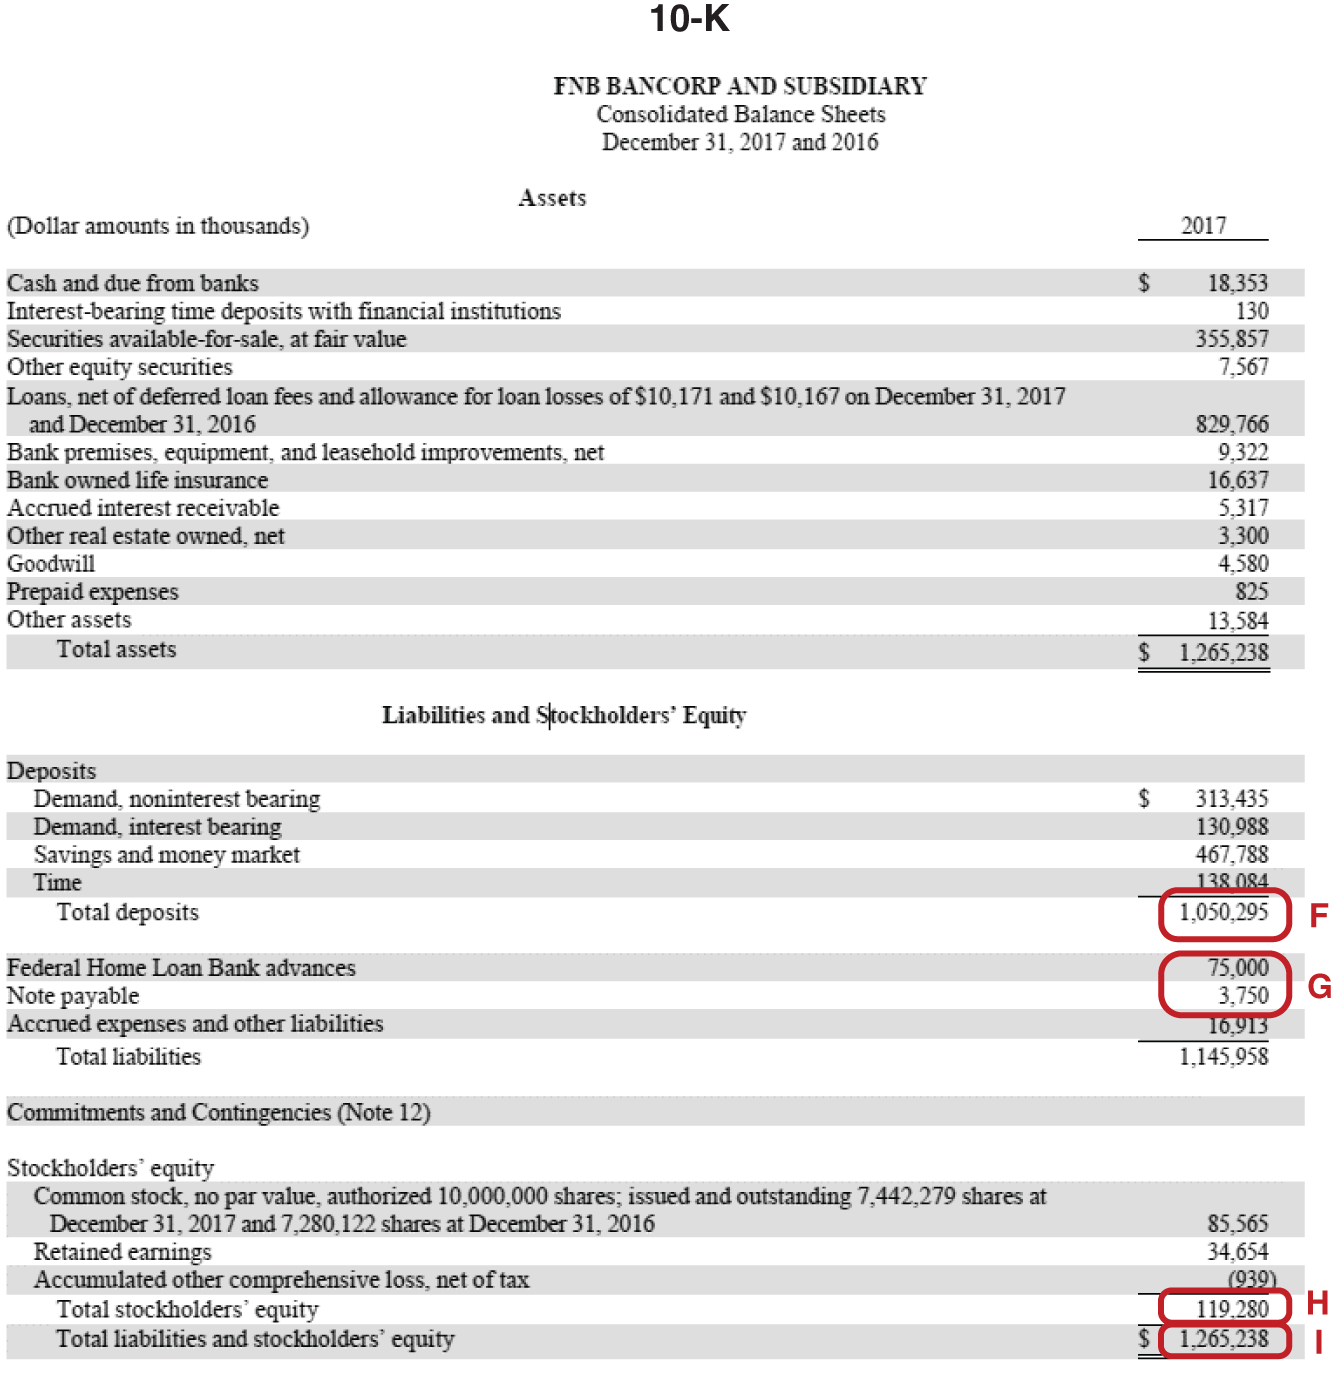
EXHIBIT 2.37 Balance Sheet – B
The net result of this exercise shows that we can use Y-9C filings as a very close proxy to the 10-K results. Further, we see that revenues match up relatively well, as one would expect as the bank-level entity should be the entity generating all the operating revenues. Unfortunately, the final number that we need to calculate EPS, weighted average shares outstanding, is not disclosed in either the call report or Y-9C.
In our example bank, FNBG, the important line items on the asset side of the balance sheet line up: cash and equivalents, securities, gross loans, and the loan loss reserve.
On the other side of the balance sheet, important items like deposits match up between the Y-9 and 10-K. Importantly, the call report misses the $3.75MM in notes payable, since it is debt held at the parent company level. Instead, proceeds from that note are downstreamed to the bank in the form of equity capital; hence, the higher equity capital in the bank level call report compared to the BHC level figures.