A programming language is a factory for transforming input to output. Ring is no exception. In the following two chapters, your objective is to learn how the language intercepts data as input, how it transforms input internally by applying algorithmic logic, and how it exposes input as output to be consumed by the users of the program. Together, these chapters form the second part of the book called “Practical Ring.”
By “practical,” I mean that what you are learning here will be not superficial instructions for taking a user’s input, applying some ifs and elses to it, and sending it to the screen, as you will find in many beginner books. No, things are serious here, because in the real world, even if you know the language by heart, many problems related to algorithmic data acquisition, storage, and transformation will arise, both at the code level and at the program architecture level. In this chapter, we will face these problems, understand them, come with up elegant solutions to them, and challenge the Ring language to help us reign over them.
Ring, because of its inherent flexibility and expressiveness, will help us conquer these input/output problems by allowing us to write quick lines of working code and then rewrite our program, as if we were telling a story, not writing code.
After mastering these extensive learnings distilled from hand-on experience in real-world projects, you can confidently take charge of any complex requirement related to managing data inside a computer program. Hence, you will gain the expert-level techniques to write efficient Ring algorithms. So, bear with me, be patient, and follow along with this step-by-step tutorial, which is dense but instructive and intentionally augmented by dozens of visualizations and yet practical code examples.
In particular, this chapter teaches you how to capture data in Ring programs, as well as, more interestingly, how to deal with complexity in code by preventing it from happening at the data input level, by adopting expressive variable naming conventions, by helping you find your way in the jungle of user interface events, and by pragmatically embracing the golden software architecture principle of all time: separation of concerns.
The first thing a programming language does is intercept data entries. Without data, what a computer program can do? Nothing really. A programmer entering code (hard-coding) is a common practice to get started but is prone to many risks and hidden problems (section “Inputs in the Code”). Also, the user can be asked to enter data in the console or at the command line (section “Inputs in the Console”) or in a graphical user interface, where the MVC design pattern1 becomes a mandatory tool to understand and work with. Ring makes it easy to use by visually designing the windows of your application in the Form Designer and by generating all the complex staff for you (section “Inputs from the GUI”). Or maybe the data comes from a text file (section “Inputs from Text Files”) or a database (section “Inputs from the Database”), and therefore you need to establish a data acquisition framework enabling your application to connect to diverse data formats and deal with them in a unified way. We end the chapter with a final enhancement of the design of the NorthAfrica app we worked on (section “Final Refinement”) and a listing of other data input options, required by modern software (section “Other Inputs”).
Whether it’s hard-coded data, command-line data, text data, GUI data, or database data, you can pick this chapter and learn how Ring can rule them all.
Nine Things You Will Learn
Get data input into your Ring program from many sources
Mitigate code complexity with good naming and code organization
Design graphical user interface (GUI) applications using the Form Designer
Master events in GUI programming
Work with the MVC pattern and design clean software architectures
Refactor, reuse, and extend code
Develop a universal data connector in Ring
Transform data using lists
Develop multiplatform applications
Inputs in the Code
family.ring
Here, the data about the ages of my family members is hard-coded in the program in plain text. This is done, like in all programming languages, by hosting the data in variables.
Using Variables to Host Data in Code
It’s worth mentioning, from the start, that there is no such a strict type called CONSTANT in Ring. We just have variables that we can change any time.3 In my case, when I use a variable as if it were a constant, I write it in uppercase so I can visually identify it. Then I assume my own responsibility, as a programmer, is to treat it as a value that I will never change at runtime.4
It’s language abuse then if we talk of constants in the scope of Ring programming, but we will do it anyway. Consciously.
hardcoded1.ring

This seems great, but wait.
Avoiding Magical Numbers
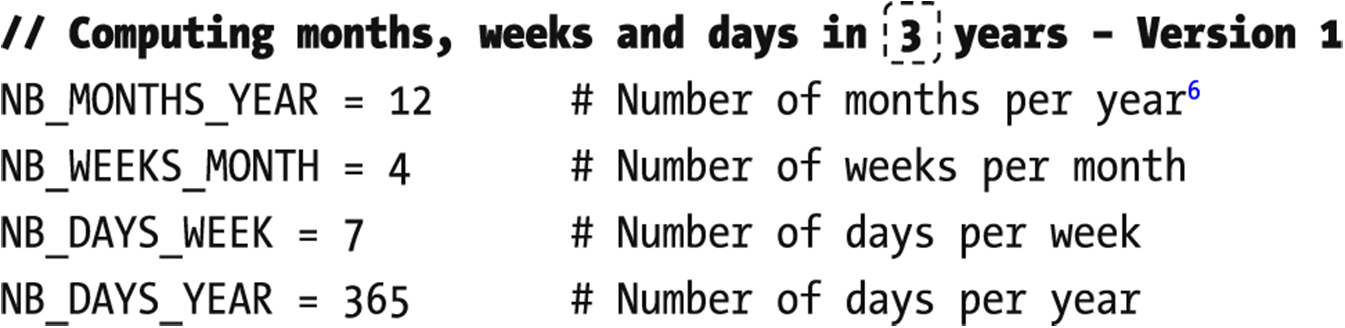
![]() 3 is a magical number in this code sample, meaning it’s a value that is hard-coded without any meaning other than what the code writer knows. In fact, I know it is the number of years, because I am the one who wrote it, but how this can be conveyed to other readers without ambiguity, especially when we are programming “on the large”?7
3 is a magical number in this code sample, meaning it’s a value that is hard-coded without any meaning other than what the code writer knows. In fact, I know it is the number of years, because I am the one who wrote it, but how this can be conveyed to other readers without ambiguity, especially when we are programming “on the large”?7
hardcoded2.ring
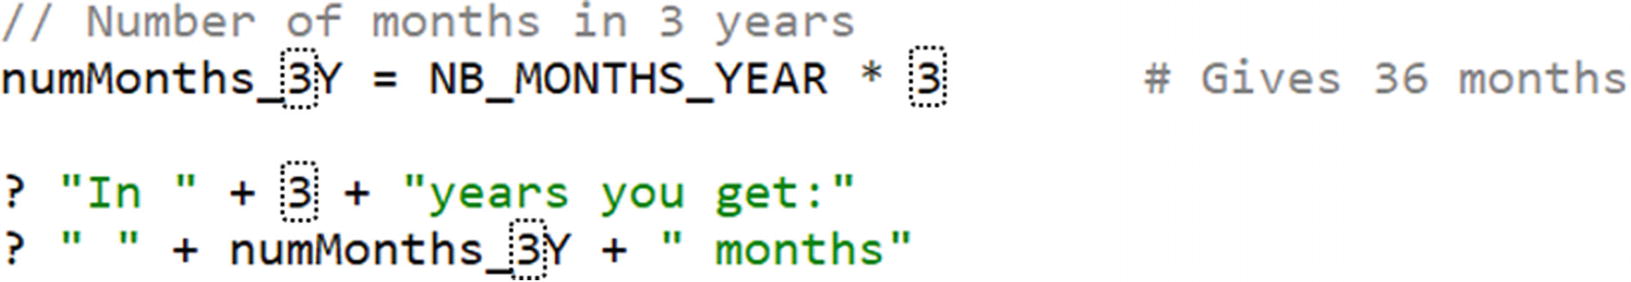
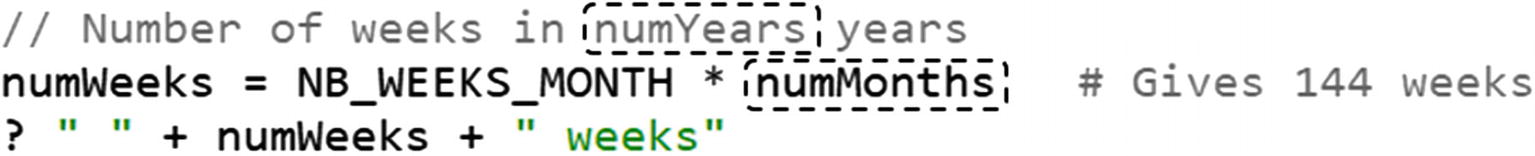
Now, think for a moment about the names of these variables: numMonths_3Y, numWeeks_3Y, and numDays_3Y. What is wrong about them?
There is no consistency in our naming strategy. Having the _3Y postfix in numMoths_3Y no longer makes sense, since the number of years, now hosted in numYears, can be changed to any value other then 3. This is the showcase where 3 is not only a magical number but a magical and hidden defect in the same time!
hardcoded2.ring
So, never rely on a name like numMonths_3Y for your variables. Also, note the changes I made to the text of the comments (in bold in Listing 3-4): we are no longer referring to 3 but to a given number of years!
This nice feature solved part of the complexity that is still there,8 inside your code.
Mitigating Code Complexity

Four blocks of code, clean naming of variables, but…
In part 4, the
 variable is dependent on its calculation in part 3.
In part 3, the
 variable is dependent on its calculation in part 2.
This kind of dependency, owing to the use of global variables, is a bad thing, especially in large programs, because it makes your code hard to understand and fragile at the same time. Why hard to understand? Because you can’t find where it changed and how the chain of changes has impacted the ultimate value of the variable in the current place of your code. Why fragile? Try to move part 4 before part 3, for example, or part 3 before part 2, and then execute: it will break!
The morale of the story is that global mutable state can be evil.
There is a hot discussion in the programming community on whether mutability, the change of global variable values, is a good or bad thing.10 Some say it is a bad design, while others claim it gives them freedom. You should make your own decision based on your particular programming style and real-world context.11
Personally, I start by thinking about the algorithmic problem in hand, without limiting myself by this immutability paranoia. My data is defined in front of my eyes, right in the code, using constants, global variables, and local variables alike. Once I’m done logically with the solution, I take out my perfectionist sword and start iterating on localizing the state of the program as much as possible by transforming globals to local variables.
Usually, this means my code parts are redesigned in functions (or classes) while separating between concerns, as much as I can, so every function gets one and only one clear mission. That’s why I expressed my concern about the program structure and its flow of execution, as shown in Figure 3-1. This is what refactoring means after all: good naming conventions, minimal dependency between variables, careful separation between concerns, and the design of independent but complementary parts of the overall program.
Did I say refactoring? Let’s refactor then.
Refactoring the Data Side
The constants are defined together inside one container: a hashed list.
All the functional parts of the code (2 to 4 in Figure 3-1) are redesigned in functions, and even in a class if this makes sense.
In particular, those functions should be independent and self-contained so they always return the same result if they are fed with the same input data and can be called in any order.12
data[ :NB_DAYS_MONTHS ] returns 12.
data[ :NB_DAYS_WEEK ] returns 7.
And so on.
At this level, it’s sufficient to know that : can be used inside a hashed list as a decorator of the index used to access the corresponding value. But in reality, the : is a general replacement in Ring of "" in delimiting the value of a string. Hence, for example, instead of saying s = "sun", you can say s = :sun; it’s the same.
You may be asking, why do we use these colons to access a hashed list? Well, what happens behind the scene is worth explaining.
If you were to cope with the internal representation and if you want to access the name value, for example, then you should access the first item of the a[] list (which is itself an inner list) and then access the second item of that inner list to find the required value, "Nestor". In Ring code, this is equivalent to saying a[1][2], which is exactly what Ring kindly does, for us, when we say a[:name].
Now tell me what is the equivalent of a[:age]? Yes, a[2][2].
As a general rule, Ring takes the string you put as an index between the [], performs a quick search of the inner list containing that string in its first item, and then returns the second item corresponding to the required value.
We can say “Thank you, Ring!” because such a feature enhances our programming experience and enables us to write code while thinking in it naturally and hiding its complex implementation.13
Now, after implementing the first guideline by refactoring the data side, let’s move to the second one and refactor the code side14 of our program.
Refactoring the Code Side
The second guideline mentioned in the previous section can be implemented by transforming every one of the three parts of the program (from 2 to 4 in Figure 3-1) into a function. For example, to successfully refactor this code snippet from part 3 into a clean function, do this:
numYears, which is visible here as a global variable and hence can affect the code whenever it changes in any corner of the program, must be transformed to a parameter of the function, pNumYears,15 for example. When the function is designed to depend exclusively on its parameters and never on any global variable, then the returned number of weeks for a given pNumYears will be always the same, whatever happened.
The formula used here contains a dependency with the numMonths variable that is calculated elsewhere. Every time its implementation changes then, our code snippet is impacted. Instead, the same calculus can be made using constants, which are not supposed to change.
We are not only more elegant conceptually, but also more precise arithmetically, since the first formula completely misled us. Frankly speaking, the number of days in three years has never been 1008 but 1095 (= 365 * 3).
hardcoded3.ring
These can calculate the results for any number of years and in any order. Our code side of the program is now composed of well-defined functions and deservers applause. But...17
Even those functions are open to an additional18 and useful refactoring.
Separating Between Concerns
As a golden rule for the design of your functions, let them do one thing and do it well, instead of stuffing them with various features and operations. This is another source of software complexity that you should avoid from the beginning. In our case, the functions we just designed perform two different operations: making the calculation and generating the output. These are two different concerns, and they must be separated.
To do so, an output() function could be added and called from inside all the other functions to prepare the output in a string, without printing it yet in the screen (using ?). Once returned to the calling code, we let the caller decide what to do with it: printing it to the screen, using it in any other computation, or blowing it on the wind! Why should we care?
Part of hardcoded4.ring
Part of hardcoded4.ring
hardcoded4.ring
Execute it and compare the result with the previous versions. They are all quiet in terms of output, but the last version exceeds them all in terms of the quality of software code.
There’s one little thing I want to add to this subject of mastering data in your code: the use of global variables.
Using Global Variables
What about using global variables inside your programs?
As I said earlier when I first talked about mutability, some programmers will say they hate globals because they alter the state of the program, and others will say they do need them because they make their lives easier. Some programming languages don’t support them at all, such as Java and Haskell. Others limit their visibility at the program file level, like Python, and still others can extend their visibility to external files, like C. Some languages define them exclusively at the top level of the program, like C++, while others can have them defined anywhere even inside functions, like PHP. A number of older languages, such as BASIC, had only global variables, no more.
In particular, the programming language Closure features a kind of immutable and persistent data structure that always preserves the previous version of variables when they are modified. Technically, when the programmer changes a new value to an existing variable x, then its old value is preserved untouched, in memory, and a new version of x is created to hold the new value. Such a conservative approach, inspired from the functional programming paradigm,20 provides a radical protection of the state of the program and is good for developing heavy data transactional systems and multithreaded applications.
Is that mutable or not mutable? In such religious wars,21 the voice of wisdom is always in between, and to wisdom the Ring language obeys.
Thus, the two variables myVar1 and myVar2 are visible to all the code written in the main region of your program without being globals anymore. You’ll learn more about the visibility of variables at different scopes22 (global, local, and object scope) in Chapter 6.
Verbose mode: The output function generates a whole sentence like it is currently implemented (? numDays(3) returns "In 3 years you get 1095 days").
Nonverbose mode: The output function returns just the number related to the calculation (? numDays(3) returns just 1095).
Part of hardcoded5.ring
Part of hardcoded5.ring
A lovely global, isn’t it?
Inputs in the Console
Suppose we are asked to enhance our previous program by allowing the user to define, by herself, the output mode. If our user is a programmer or someone who can comfortably deal with computer code, then all what we have to do is to give her a copy of the code and ask her to install Ring, or better yet, Ring Notepad, and then play with the bVerboseMode variable right there in the editor!
That’s impractical, I agree. That’s why Ring comes with a standard keyword for intercepting the user’s output as she is typing something on the keyboard. It allows her to give her data input to Ring via the Give keyword. Also, Ring makes it possible to have our program intercept data coming from the command line by typing, for example, ring.exe hardcoded5.ring –true to run the hardcoded5 program in verbose mode. In the following two sections, I give you quick hints on how you can do it.
Using the Give Command
tempo.ring

In the Output window, type your first number in the Input field
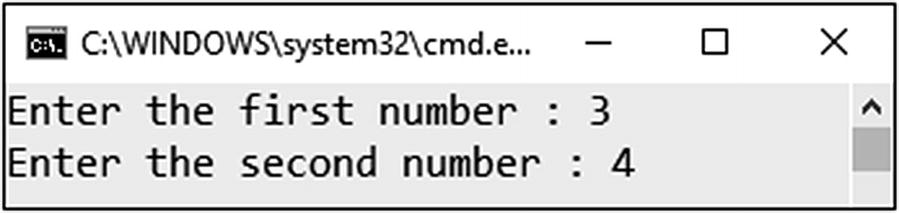
Type your numbers in the console
Any problem?
The console was in a hurry and didn’t show you the answer.
Part of tempo.ring
Anything is a variable that we used to force Ring to wait until a key is pressed, and then the program ends.
Getting Arguments from the Command Line
where arg1 and arg2 are the two arguments that the Ring executable (in the first case) or the Ring script (in the second case) will receive and work with internally.
System("tempo.exe –arg1 arg2"), which enables you to execute system commands in the runtime
SysGet("PATH"), which enables you to get the content of one of the environment variables of your operating system (PATH in this example)
And many other functions that enable you to identify, at runtime, the operating system on which your application is running and, thus, target it with a specific code, such as isWindows(), isWindows64(), isUnix(), isMacOS(), isLinux(), isFreeBSD(), and isAndroid()
Dealing with data coming from outside your program, from the operating system in particular, is not something a modern programmer can escape, since the software domain is moving toward mobile phones, embedded devices, self-driven cars, and autopiloted drones. However, GUI applications remain by far the major interface for capturing data inputs in our software world.
Inputs from the GUI

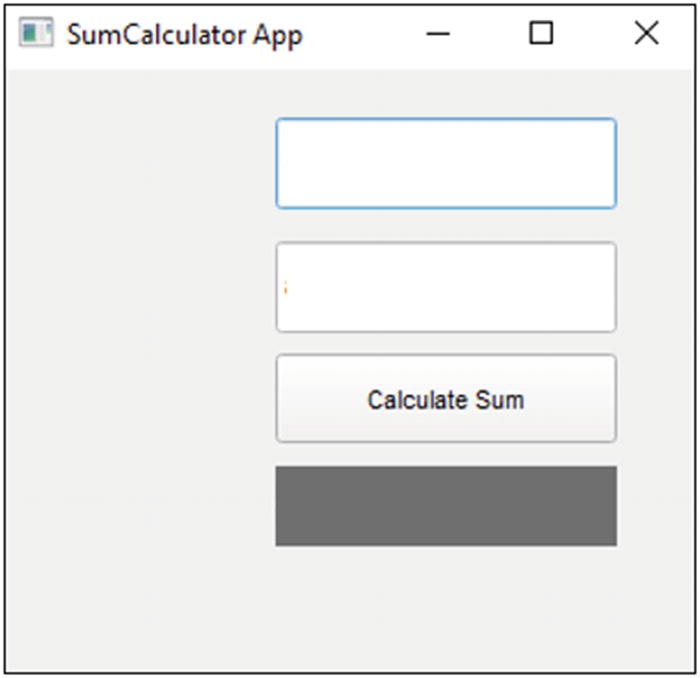
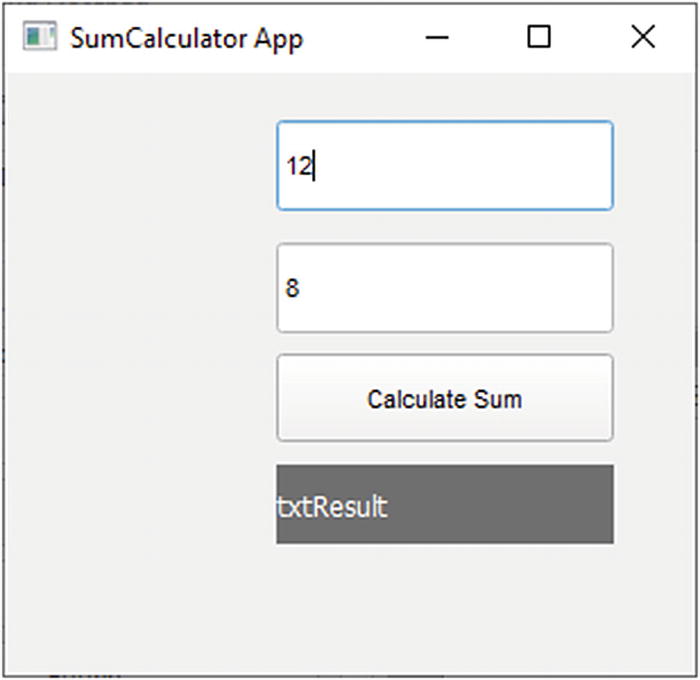
Data input in a graphical window
As you see, this is a calculator app specializing in addition. First things first, let’s build the window graphically using an included tool in Ring Notepad called the Form Designer.
Creating Windows in the Form Designer

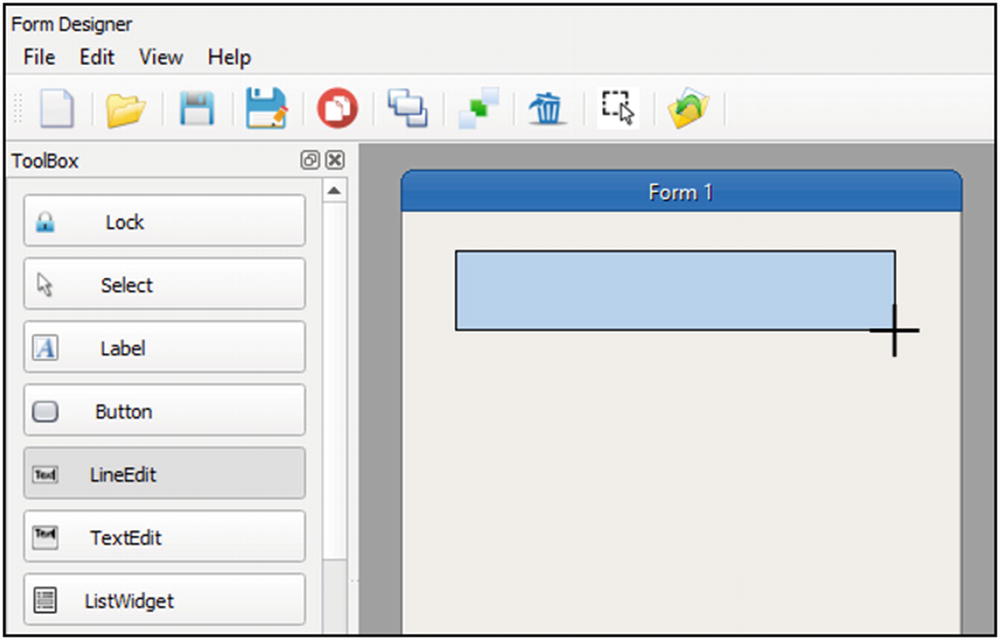
User interface of the Ring Form Designer
You can switch between the Form Designer and the Code Editor (currently I have tempo.ring open, as you can see in Figure 3-5) by activating the related tab on the bottom-left side of the user interface. The Form Designer application has a main menu (1), an icon bar (2), a toolbox (3), a workspace (4) containing an empty form (or window if you want), and a Properties panel (5).
The Toolbox and the Properties panel can be turned on/off by selecting View ➤ Toolbox or View ➤ Properties from the main window (of the Form Designer and not Ring Notepad27).
Actually, the Properties panel shows the attributes of the window. Try to change a couple of them by typing a width of 320 and a height of 350, for example, and observe the impact of that change on the window in the workspace.
Using the mouse to define the region of the selected graphic widget

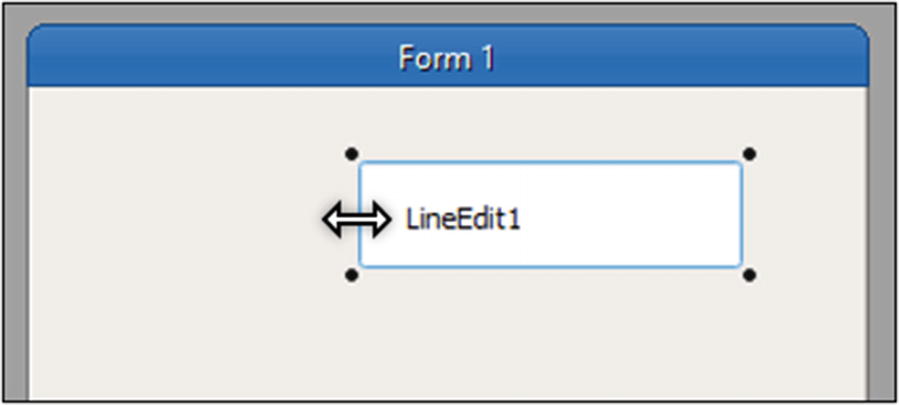
A widget painted on the form, with its attributes displayed in the Properties panel
As you see, the LineEdit widget is still selected, and its properties are displayed in the panel on the right. You can play with them if you’d like. Change the Text Color and Back Color properties if you want by clicking ![]() to the right and choosing your preferred colors from the displayed color selector.30
to the right and choosing your preferred colors from the displayed color selector.30
Using the mouse to change the dimensions of a graphic widget
You can even drop it completely by pressing the Delete button in your keyboard while the widget is selected. But I doubt you may need it, since what I want you to do now is to duplicate it by selecting Edit ➤ Duplicate from the main menu (or by pressing Ctrl+Shift+V). Adjust the duplicated widget position to be under the first one. By the way, note that the Edit menu contains other interesting options (but it is not required to go with them now). Also, set the names of the two LineEdits to, respectively, edtNumber1 and edtNumber2. These names will be used later when writing code for our application logic.

Four widgets not correctly aligned on the form
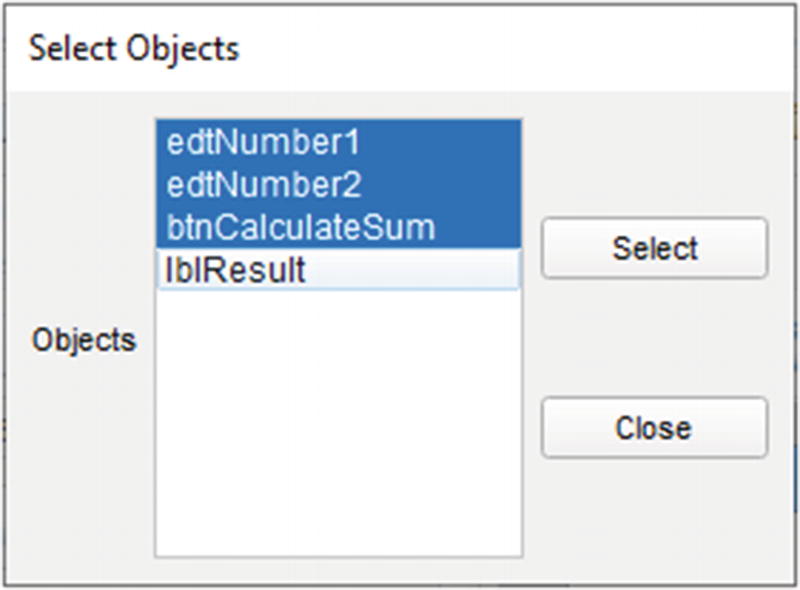
Selecting multiple widgets
I left the last one for you (lblResult); click it and then click the Select button. Your widgets are all selected. Click anywhere in the window to deselect them.

Smart actions when many widgets are selected using the mouse
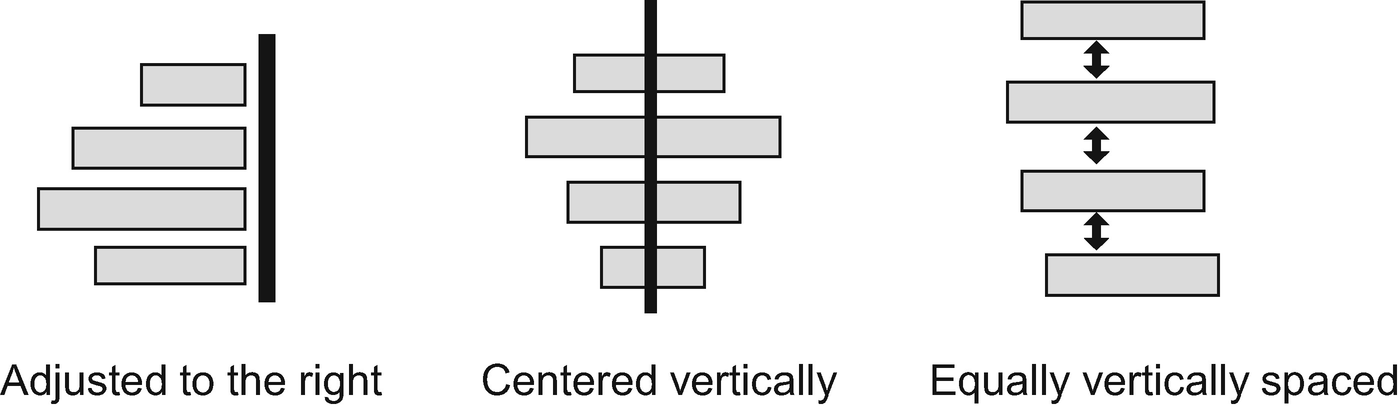
Three possible automatic adjustments of the widget positions
Adjust them back to the left side.
From our SumCalculator App perspective, the four widgets we have on the window correspond, respectively, to the first and second numbers to be provided by the user, the button we press to launch the calculation, and the text label where the result will be shown. You can add some other widgets to get the same initial window we started the section with, but it’s better to keep it basic now.
Automatic alignment of four widgets on the form
This is a toy window, though, and some useful functionality needs to be implemented. I'll be more than happy to help you do it, but before that, you really need to understand what is going under the hood.
Understanding the Generated Files from the Form Designer
As we said before, the Form Designer is written completely in Ring. Its source code is available and can be found in the c: ingapplicationsformdesigner folder. You can even include it seamlessly in any of your applications like it was included in Ring Notepad (read the introductive comments in the formdesigner.ring file). Also, everything Ring does, from parsing your program code to transforming it to bytecode to providing you with a complete WYSIWYG system to designing your interactive forms, is totally transparent, and nothing is left, like with other technologies, inside a dark hole.35
So, what happens exactly when our widgets are visually designed?
Save the form by selecting File ➤ Save as from the main window of the Form Designer, select a new folder called SumCalc under c: ingbookchap3, and save the form file there under this name: sumCalculator.rform (note that you won’t need to type the .rform extension because it will be added automatically).
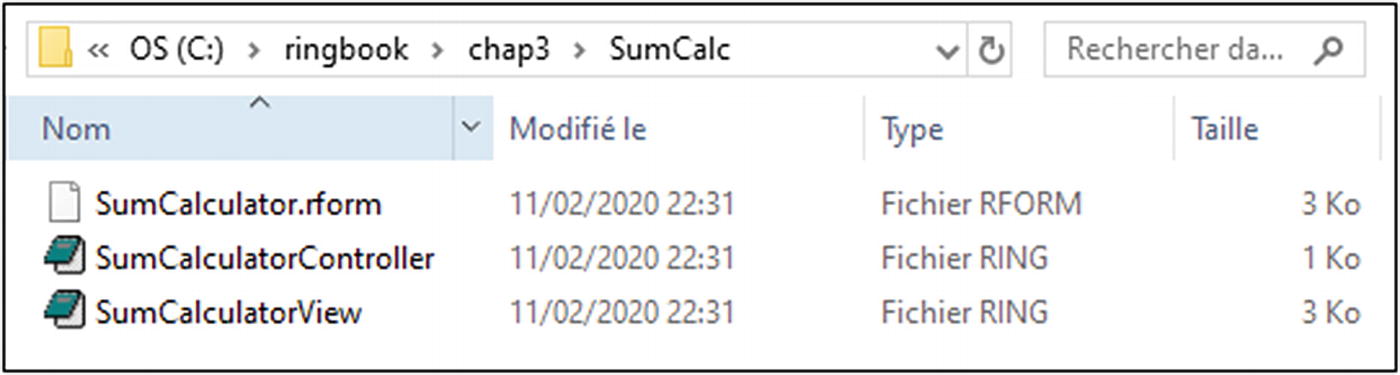
Three files generated by the Form Designer
SumCalculator.rform: This is where the graphic interface of the window is described (as is, without any information about how it is implemented). It corresponds to what the user sees, a window of that type, a button in this position, etc. That’s why I’ll call it the description file.
SumCalculatorView.ring: This is where the user interface is actually fabricated. It says how the UI elements described earlier are implemented, using this particular function or that particular graphic library (Qt in our case36). That’s why I’ll call it the presentation file.
SumCalculatorController.ring: This is where the Ring functions necessary to respond to the various events invoked by the user while using the window (clicking on a button, for example) are written. That’s why I’ll call it the interaction file.

Structure of sumCalculator.rform file in Notepad++
It’s all about a simple Ring list called aObjectsList. Every item is a hash list itself corresponding to one of the five widgets forming the application (Window being the fifth one along with the four widgets we added manually to the form). The hash list contains the widget attributes as they were defined in the Properties panel of the Form Designer.
Save it, close it, and go back to Ring Notepad. From the main menu of the Form Designer, select File ➤ Open, and find SumCalculator.rform in the c: ingbookchap3 ingcalc folder. Open it and observe the new title of the form: it has changed.
Now add a text Label to the form, for example, or change any attribute of the current widgets in the Properties panel. Save the form, switch back to your external text editor, and open the same sumCalculator.form file again: it has changed.
Hence, the description file is modified automatically, under the hood, when you change your design of the window in the Form Designer. But also, any other means can be used to change it: manually by editing the text file or dynamically by another program you write in Ring or any other programming language.37
Among the properties of every object there are some events out there. You can easily identify them, by their names, in the Properties panel or even inside the text of the current description file (did you notice the Click event in Figure 3-15?). These are specified here because they are doomed to play the role of a binder (or messenger or mediator or linker if you want) between the description of the user interface in the current sumCalculator.rform file and its concrete rendering (or implementation in Ring code if you want) in the second presentation file, sumCalculatorView.ring.
So, let’s take a minute to talk about events in programming in general before we continue our journey in exploring the remaining generated files.
Understanding Events
Events are the most known source of software complexity. They are both difficult to introduce38 and hard to implement in code. Yet, they are largely misunderstood by beginners and experienced programmers alike, while being prone to divergent doctrines in defining them and rigorously classifying them, even by the gurus of the software industry.39
Besides explaining how events work in a GUI application like the one we are currently developing, its true value resides in the clarity of definitions provided, which you should embrace and understand from the start of your programming journey with events.40 During your learning experience, inside this book and elsewhere in the future, you will be most likely confronted with many variations of the jargon used, which is actually one of the additional causes of complexity of the discipline of computer science in general and this subject of events in particular.41
In fact, a GUI application is a real-time software system42 composed of a main window, a main events loop, and a number of graphic widgets. The term real-time means that the main events loop is listening all the time to what is happening inside the window. Its role is to intercept any event fired by the user on a widget (click, mouse-over, etc.) and route the execution flow to the part of code specified by the programmer to handle this specific event. A quiet complex system indeed!43
From the user perspective, they allow the user to interact with the user interface.
From the programmer perspective, they provide you with a place to write the reactions of the application to the triggered44 events (we say that you are handling them or controlling45 them) in Ring functions.
They form the application architecture perspective, and they form a bridge to let the user interface (presentation layer) communicate indirectly with the description layer, without being coupled together but, instead, by delegating the control of this communication to the third interaction layer.46

What is happening under the hood of the files generated by the Form Designer
Figure 3-16 draws the mental model you should adopt while thinking of the big picture of the event-driven system established by Form Designer inside your code base to accelerate the development of the GUI of your application. In fact, among the several actions implicated in the click process visualized in the figure, only actions 4 and 5 are required to be done by you, the programmer. All the others are done automatically for you!
After watching how the UI has been described automatically inside the description file, sumCalculator.rform, let’s see how its presentation aspect has been fabricated in the sumCalculatorView.ring.
Fabricating the User Interface
SumCalculatorView.ring
The file contains a class of the same name, SumCalculatorView , which reproduces thoroughly the content of the first description file, sumCalculator.rform, while augmenting it with some implementation staff: a Ring class and a bunch of Ring libraries (StdLibCore48 and GuiLib49) along with a package50 of specialized classes in GUI programming, System.GUI.
At the beginning of the main region51 of the file, an App is initiated (which is actually a Qt app52) with an instance of the previous class. Then, the window is rendered (using win.show()) and then displayed on the screen (using exe(), and both refer to the functions of the same name we discovered in Chapter 1 when we first met with the Qt framework).
In other words, both the description and the presentation are done; what is missing is the user interaction staff.
Responding to User Events
Clicking a button: setClickEvent("")
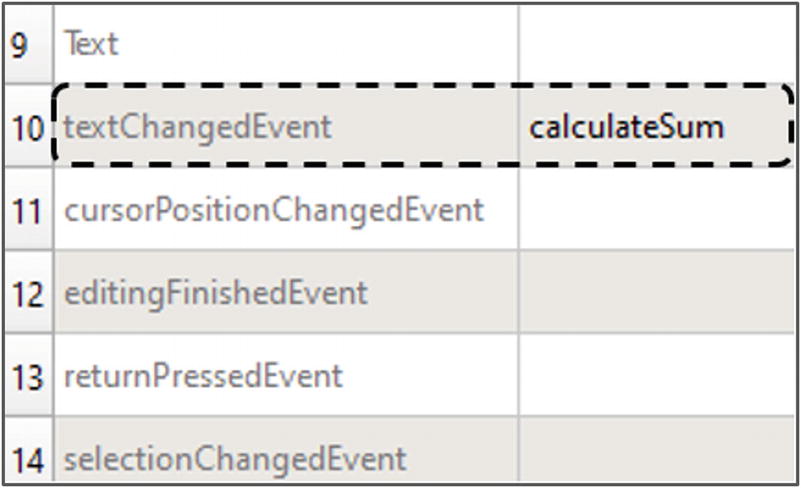
Changing the text in a LineEdit: setTextChangedEvent("")
Selecting text inside a LineEdit: setSelectionChangedEvent("")
And so on53
What you need to do now is to define an action to respond to every event you should trigger (those left empty, "", won’t be managed by the event system and are therefore totally idle). All that is required is providing the name of a function (or more precisely a method, although they are the same in Ring54), because the code itself will be written later in the third interaction file. That method will be evoked by Ring (and, behind the scenes, by the main loop maintained internally by the Qt event management framework famously called Signals and Slots55) at runtime as a response to the user event.
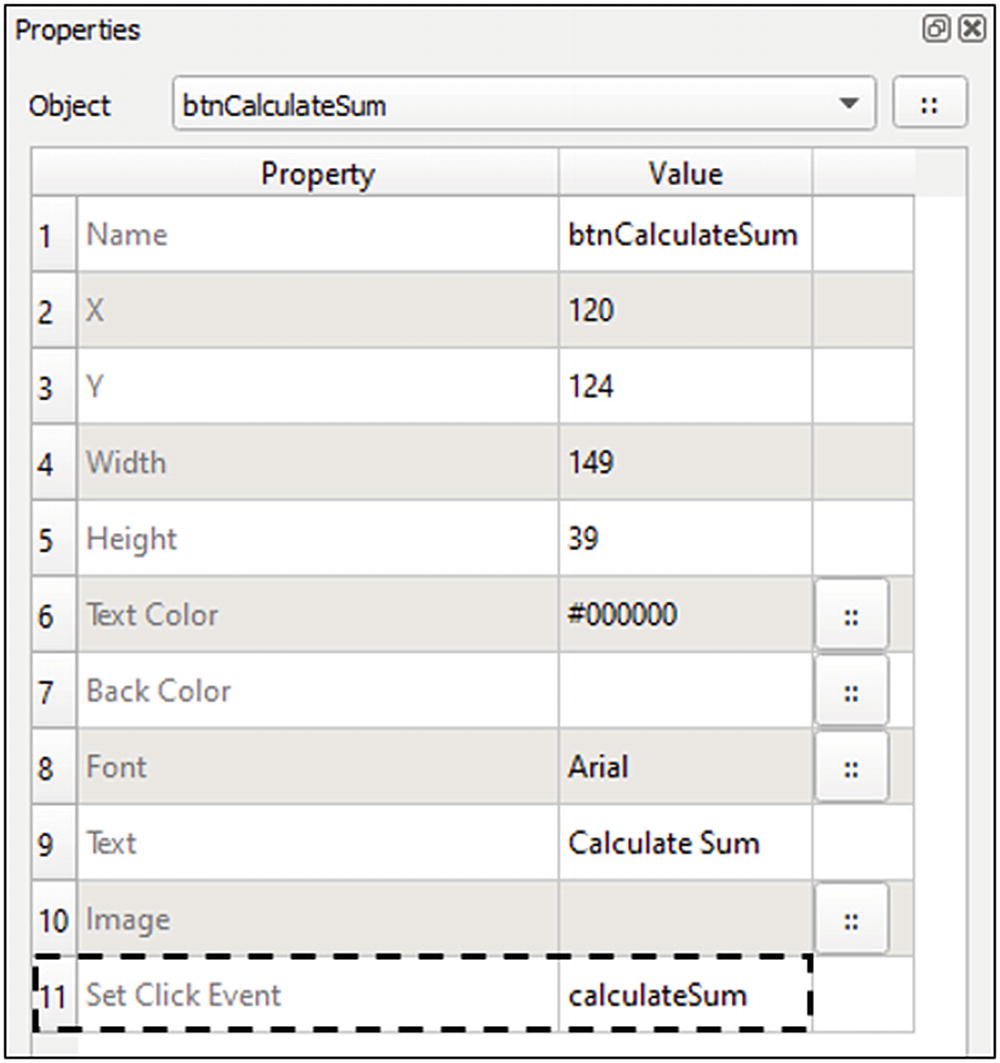
Defining a call back function to the click event of a button widget
Once done, save the form, and verify that something changed in the sumCalculator.rform and sumCalculatorView.ring files.56
As exposed previously in Figure 3-16 and described in the presentation file, sumCalculatorView.ring will delegate the execution flow to the interaction file, sumCaclulatorController.ring, where the calculateSum() method will be implemented (i.e., written in Ring) and executed.
SumCalculatorController.ring
Part of SumCalculatorController.ring
Providing default values in the controller file
You made it, but a better solution for displaying default values is to define them in the description file (in the Properties panel, by entering them in the Text property) and let the Form Designer generate them automatically in the presentation file. As general advice, let the controller (the interaction file) contain what is dynamic by nature. By “dynamic,” I mean the computations you need to make after something happened in the life of the program (a user or system event). The default values are rather static and can be provided before the program starts. Therefore, their best place is the model of our application (the description file).
In the Form Designer, select the two LineEdits, one by one, and enter 12 and then 8, respectively, in their Text attribute in the Properties panel. Save and run. It’s the same result as in Figure 3-18 but with a cleaner implementation.
What’s next? Writing the sumCalculate() method , in the same interaction file, to respond to the click event of the btnCalculateSum button.
Part of SumCalculatorController.ring

A fully functional calculator that make sums
It’s working perfectly. Still the user interface design is far from being satisfactory. Let’s try a little enhancement.
Enhancing the User Experience
An Again! button to re-initiate the form by setting the numbers to zeros (i.e., to empty "" strings).
A Close button, well, to close the window. If the button is called btnClose, then the command you need is oView.win.close().

A more beautiful app59
- 1.
Allow the user to get the sum as she is entering the numbers in the corresponding fields. Think of setting the textChangedEvent property of the two widgets to the same calculateSum function we used before for the button.60
- 2.
Prevent the user from entering other than numbers in the LineEdit fields. You can control the numbers when the user leaves the field by relying on a new method you name onlyNumbers()61 that you specify in the editingFinishedEvent in the Properties panel. In the sumCalculatorController.ring file, you would implement its behavior by coloring the text of the related number in red, for example.
This would be enough to notify the user of possible mistakes, but if she doesn’t care, an additional control needs to be implemented inside the calculateSum() method by displaying an error message in a message box, for example.62
- 3.
Carefully read the “User Interface Principles” article63 from Microsoft about the rules you should follow in designing intuitive desktop user interfaces. In particular, the 20 tips proposed there are all realizable without much effort thanks to the visual development experience allowed by the Form Designer.
Using the Ring designer:
Desktop and mobile development using RingQt:
Building RingQt applications for mobile:
Three Values of MVC in GUI Design
This separation of the three aspects of the GUI application (which I called description-presentation-interaction, for a good reason,64 while they are better known in the software industry as the Model-View-Controller pattern) is essential to crafting a clean and agile software architecture. In particular, this helps achieve three strategic values of any modern piece of software: code reusability, code testability, and targeting of multiple platforms. Let’s discuss them, briefly, one by one.
Code Reusability
A beautiful illustration of how MVC empowers code reusability is when the same function we write in the controller layer (the interaction layer in our terms), calculateSum for example, can be used by many other widgets in our form. Want to practice?
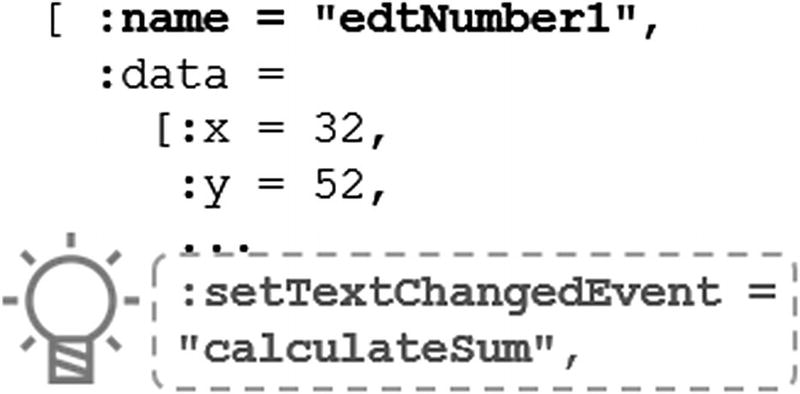
Did you notice the bulb in Figure 3-15?
Properties panel: reutilizing the calculateSum function
Save and run and then test the form. While you are entering a number, the sum is live-calculated, and the lblResult label is updated! Congratulations, you’ve been reutilizing many times the same calculateSum function code you wrote only once!
Code Testability
Usually when you are using the Form Designer to make your GUI applications, the eventual bugs come essentially from the code you are writing inside the callback functions hosted in controller layer (interaction file). Because they are functions, and if you design them to be self-contained as we learned in “Refactoring the Code Side,” then your testing activity is enhanced because it covers small blocks of code with no dependencies at all with the user interface itself.
Under the umbrella of MVC or without it, always think of writing testable code. This can be as easy as designing small functions and classes and narrowing their dependency on the rest of the world. Also, and without disturbing your programming flow with the so-called Test-Driven Development (TDD) practice, you can adopt the Ring way of testing itself using little scripts providing values for your code and replaying them any time you make a change so that the consistency of your application is not broken.
To see how this is done, explore the following folder: c: ing ests. Usually, this is my preferred angle of attack when I want to understand how a given standard function works.
Targeting of Multiple Platforms
Sorry, it is unavoidable! Whatever customer you are making a computer program for, or whatever software company you are working for as a programmer, you will need to make it runnable at least on desktop, mobile, and maybe web platforms. And if you don’t mind, let the mobile flavor work on both Android and macOS and on both small and large screens.
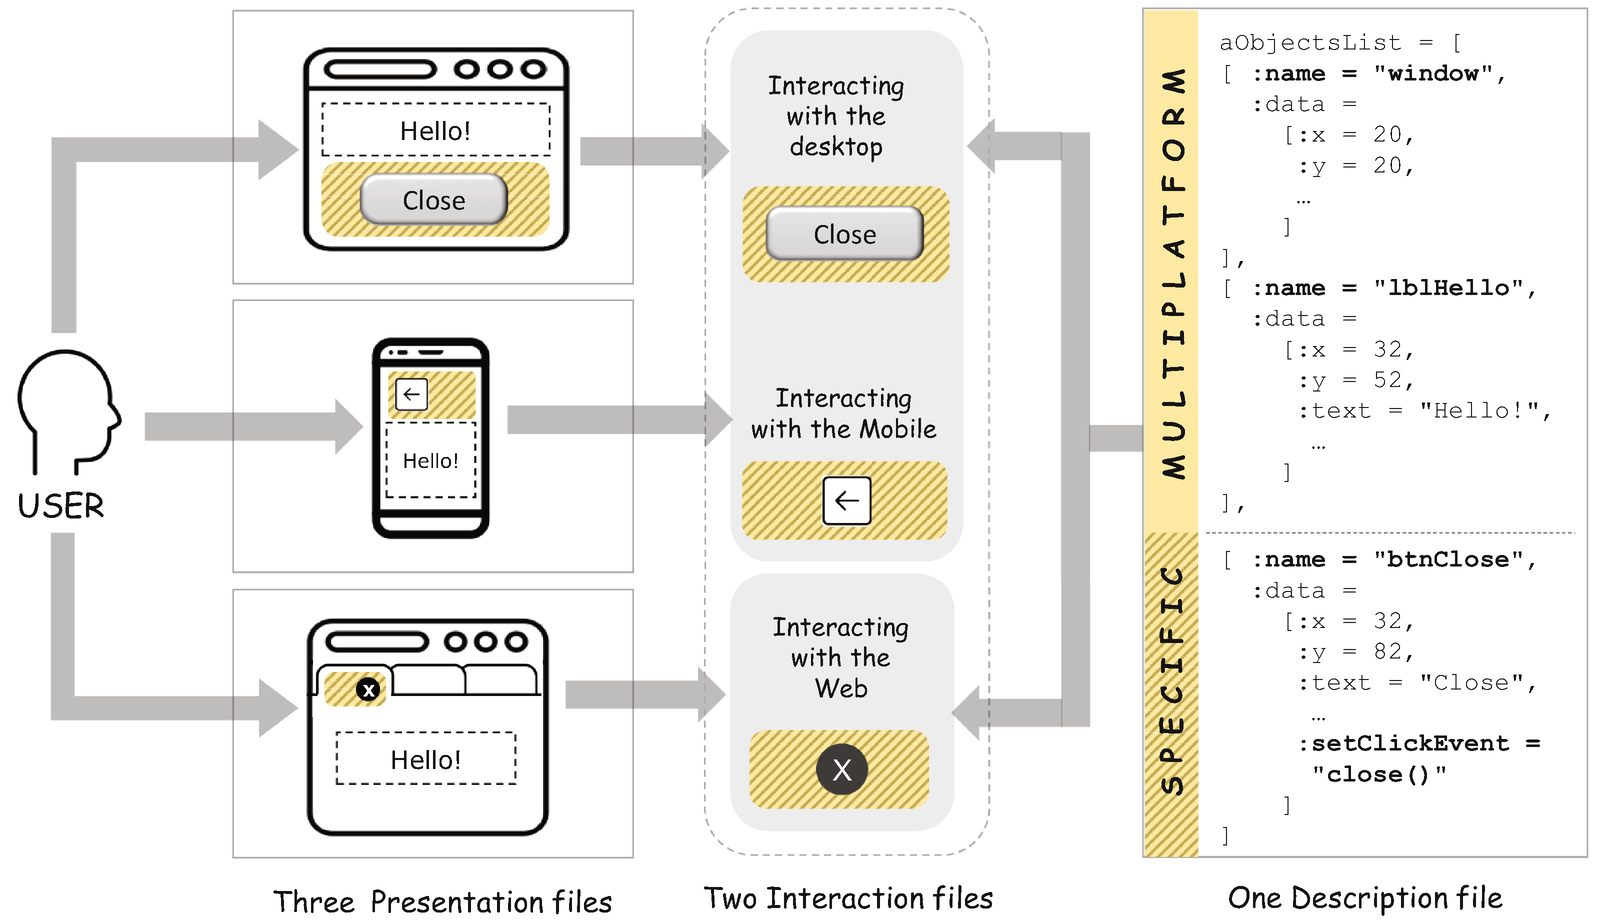
A solution architecture for a cross-platform GUI application
It’s always interesting when you have to deliver the “same” user interface to three different platforms: desktop, web, and mobile. They are completely different in regard to their underlined technologies. Still, portions of our code can remain the same and can remain multiplatform (shown in Figure 3-23). Hence, instantiating a text label "Hello!" at the position (32,52) of the screen can be interpreted in the same way65 by a desktop window, a web browser, and a mobile screen.
On the other hand, there are some specificities of each platform in dealing with some graphic objects. Take the example of the Close button shown in Figure 3-23. While the desktop understands it and provokes the current window to be closed, there is no such a “closing” thing in a browser or on a mobile device. In fact, closing happens at the tab level in the browser, and this is not managed in principle by the web application context (it is a sovereign decision of the user who is free to close any tab independently from the application logic running inside the tab). While in a mobile device and if we cope with the Android application model, what you are allowed to do is to go back to the previous screen; that’s it.
Those differences represent hard problems well known by experienced developers. Based on the Ring user interface model generated for us, it is possible to manage them by making three different implementations of the view of our system (three versions of the sumCalculatorView.ring file) where we specify whether the close button should be rendered on each platform or not. All we need to do after that is call the correct version of the file depending on the user execution platform, using the system function we discovered earlier such as isAndroid(), isMacOS, isLinux(), and so on.
Ultimately, the true fruit of the SoC of three layers is that it allows us to change our technological choices, now or in the future, without breaking the whole application. If you find Ring tightly coupled to Qt as a GUI library while you are not comfortable with everything Qt, make another implementation of the sumCalculatorWinView.ring file with the graphic library of your choice. And if you are targeting the Web, then instead of using GuiLib, use the WebLib library and develop your user interface using the language of the Web.66 Plug it in the system, and the system will work.
On the controller side, as shown in the figure, we could refactor our sumCalculatorController.ring file into two controllers: one for managing the events occurring in the desktop and mobile and one specialized in managing the web events. It is one possible solution, motivated by the similarities between desktop and mobile on one hand and the particularity of web interactions, managed in part on the front end using JavaScript, on the other hand.
First, verifying the current platform (using the same isAndroid()-like instruction)
Second, routing the execution to a dedicated flavor of the close() function written specifically for Android phones (android_goback(), for example)
I won’t show it in code this time, because we don’t have enough space. In the next section, however, you’ll learn how to get data from text files, while designing a clean data acquisition architecture in code since there is no tool similar to the Form Designer that does it for us.
Inputs from Text Files
Many software applications use text as a plain old data source. Generally, the text file hosts brute-structured data or a bunch of configuration properties you want to edit independently from the executable program. In Ring, you can simply read a file by importing its content to a string using the read() function .
Reading Data from a Text File
data.txt
Population (POP) is measured in million people, population growth (GRO) is measured in percent per year, median age (MED) is measured in years, and population density (DEN) is measured in people per km.2 The data is taken from Wolfram|Alfa, which compiled it from The World Factbook of the United States Central Intelligence Agency.68
Specifying the NorthAfrica App
Awesome bar chart, isn’t it?
Seven Steps to the NorthAfrica App
- 1.
Provide the data file called data.txt in which the statistics are hosted (done in the previous section).
- 2.
Write a text file called info.txt where we clarify the assumptions and rules of our program (just for documentation purpose).
- 3.
Provide a configuration file called config.txt in which we specify the variable of comparison (population, population growth, median age, or population density) and the chart orientation (horizontal or vertical).
- 4.
Write a Ring file called transformer.ring responsible for reading the data in data.txt and transforming it into a manageable format by Ring: List[].
- 5.
Write a Ring file called datagraph.ring where we prepare the data in a format allowing us to directly construct a particular type of chart without a hassle.
- 6.
Write a Ring file called chartRenderer.ring containing the code that renders the data contained in a datagraph in a particular visual chart hosted in a string.
- 7.
Change data and configuration in the text files and see how the charts instantly change.
Creating Conventions and Configuration Files
Now we will start step 2 listed in the “Seven Steps to the NorthAfrica App” section.
info.txt
Now for step 3 of the steps listed in the “Seven Steps to the NorthAfrica App” section.
config.txt
Name it config.txt and save it in the same NorthAfricaApp folder we are working in.
Transforming Text Data into a Ring List
Now for step 4 of the steps listed in the “Seven Steps to the NorthAfrica App” section.
We read the text file. Text data is put in a native Ring string.
We add [ and ] before and after every line respecting the syntax of a Ring list.
We constitute the Ring code describing the aData[] list and run it dynamically.
We show the result of our work by printing the list.
tranformer.ring
We’re doing good.
Preparing Data for Showing a Graph
Now for step 5 of the steps listed in the “Seven Steps to the NorthAfrica App” section.
What we need now is to prepare the datagraphs for our charts. Wondering what these “datagraphs” are? How do they differ from the dataset we have in our aData list? And why do we need them? All good questions.

A dataset and a bar chart in Excel
In Excel, it’s live and happens like magic. But under the hood it takes a long way to get from the data sheet to the visual graph. Indeed, Excel thinks of the x and y axes, the scope of values they will represent (from min to max), how many steps they contain, and what the length is of each step. Then Excel calculates the height of every bar depending on the ratio between the value of the variable and the total length of the axis. Finally, it organizes all this data in a matrix directly consumed by the graph: the matrix is the datagraph. I told you it was a lot of work!

A matrix (or datagraph) is a numerical description of the graph

where i ∈ {MAU, MOR, ALG, TUN, EGY}.
Ratios and Approximated Values
i | pi | yi |
|---|---|---|
Mauritania | 4,42 | 0,5 ➔ 1 |
Morocco | 37,7 | 3,7 ➔ 4 |
Algeria | 41,3 | 4,2 ➔ 5 |
Tunisia | 11,5 | 1,2 ➔ 2 |
Libya | 6,37 | 0,7 ➔ 1 |
Egypt | 97,6 | 10,0 ➔ 10 |
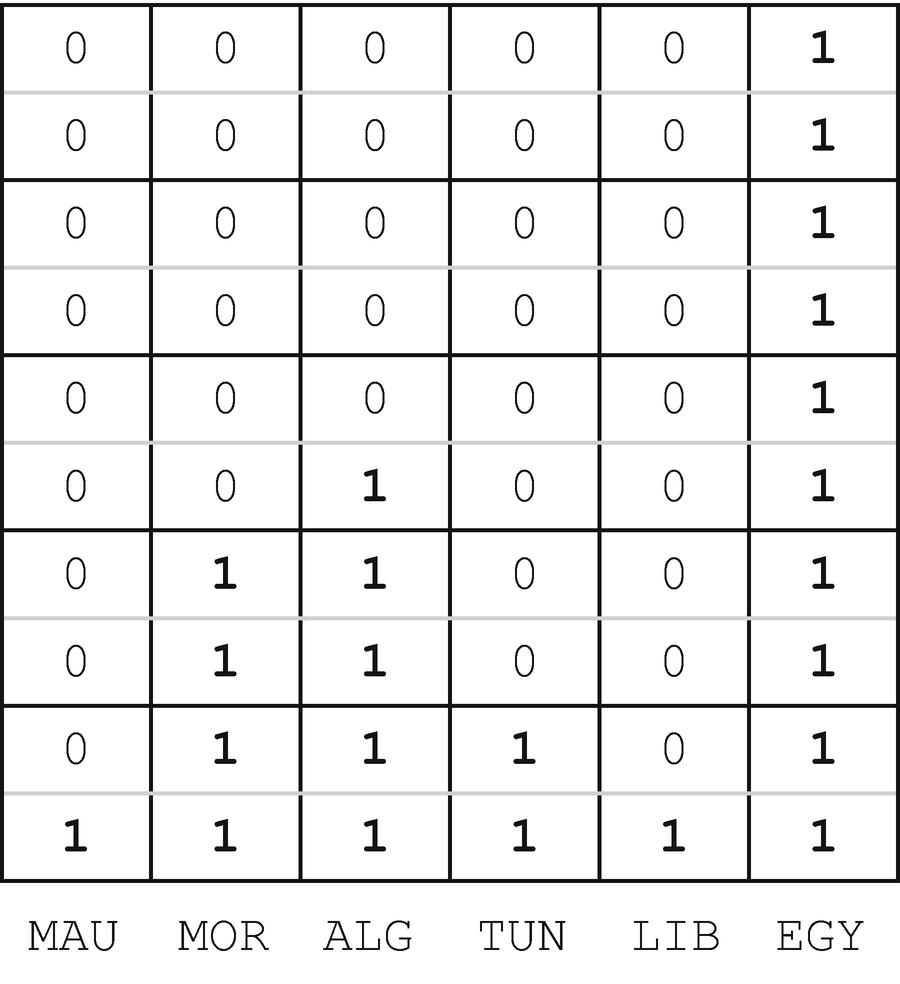
This is the matrix; this is the datagraph!

Datagraph of the horizontal chart
Let’s write an algorithm to reproduce this case in Ring. We start from the lists instantiated dynamically by the transformer. We consider only the first variable (Population), and we end up with only one of the two datagraphs, the horizontal one.70
datagraph.ring
After testing the result, comment out the lines containing the output to the screen using the ? keyword; we no longer need them. We can use the same logic for the remaining variables (population growth, median age, and population density). I will learn it for you as homework. For the moment, we can congratulate ourselves for accomplishing step 6 of our script. What remains is to show the bar chart. For that, we program the chart-rendering feature in a new chartRenderer.ring file.
Rendering the Graph Inside a Text String
Now for step 6 of the seven steps we’re working on.
As requested at the end of the previous section, create a new file called chartRenderer.ring in the same working folder of NorthAfricaApp.
chartRenderer.ring
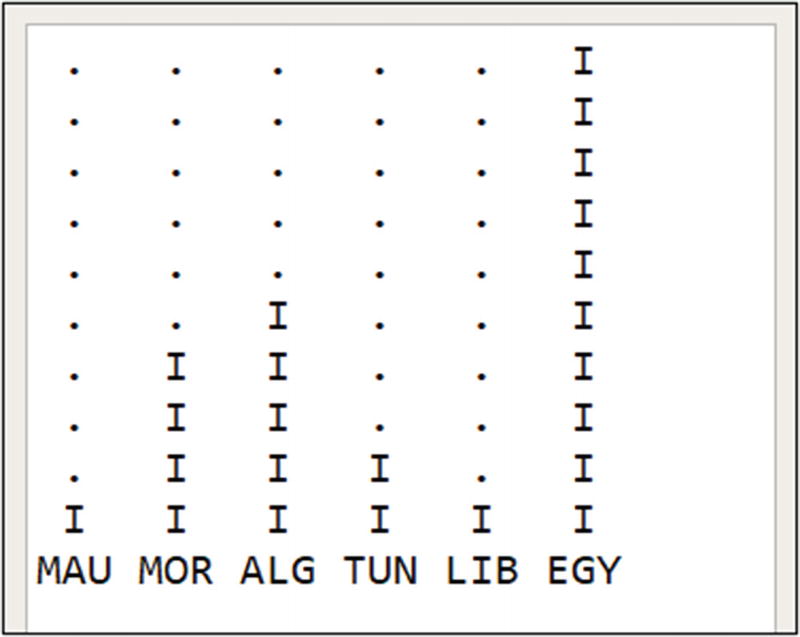
Our bar chart in the Output panel, a little bit simpler than what we dreamed of but still beautifully scribbled in the Output window72
What about the second chart, the horizontal one? Well, it requires another version of chartRenderer.ring and may be another version of datagraph.ring. It depends on the strategy you adopt and the level of SoC73 you adhere to. But, in all cases, the initial data in data.txt remains the same. The transformer.ring file also remains the same whatever graph you want to design. And if you need a version of a given bar chart for a specific platform, a smartphone for example, then only one file must be changed: chartRenderer.ring. Things are crystal clear; you are just rendering the same chart to a different platform. Other programmers who are fond of the Tunisian shakshuka74 may change everything they did and start from scratch. But you, no, because you’ve done it, you’ve “committed” your first clean design in Ring!
What if you make this second horizontal chart by yourself? You will gain a lot of knowledge while trying even when (and mainly when) you don’t succeed.
Now we move to another strategic type of input you should have in your skillset of programming in Ring: inputs from a database.
Inputs from the Database
A database is a physical store of data. Your programing language can only open a connection to it, read some data from it, record some data in it, and finally close the connection with it. Outside these windows of possibilities, when you need advanced actions such as searching and filtering, then you must talk in the language of the database plus of your programming language. The Structured Query Language (SQL), being the ultimate standard language of databases, should be learned. But this is not our focus in this book.
In this section, you’ll learn how to connect to a SQLite database in Ring (after creating it and storing our data in it, of course) while using that data to show the same bar chart we crafted in the previous section.
The main thing to consider when working with databases is that they are structured in tables. A table is a datasheet, like those we have in Excel, with a number of well-defined columns and a set of data records with a vector of data related to every column. Designing a database means creating tables and, for every table, specifying its structure by specifying its columns. All that remains is to fill the tables with data and read it back when needed.
Connecting to a SQLite Database
- 1.
Loading the sqlitelib.ring library containing the necessary functions to deal with a SQLite database in Ring
- 2.
Initializing the database using sqlite_init() and opening a connection to it using sqlite_open()
- 3.
Writing the SQL queries75 for designing the database structure, inserting data in the database, and executing these queries against the database using sqlite_execute()
- 4.
Writing a SQL query that selects data from the database and showing it on the screen
database.ring
Excellent. It is sufficient now to verify that it works. We will come back to aResult in “Adapting the Connector to the Database” to understand its structure and see whether it needs some help to cope with the format we agreed on for the datagraph. Now, using both text and a database to feed the graph invites us to reflect on the architecture of the NorthAfricaApp.
Designing a Clean Data Acquisition Architecture
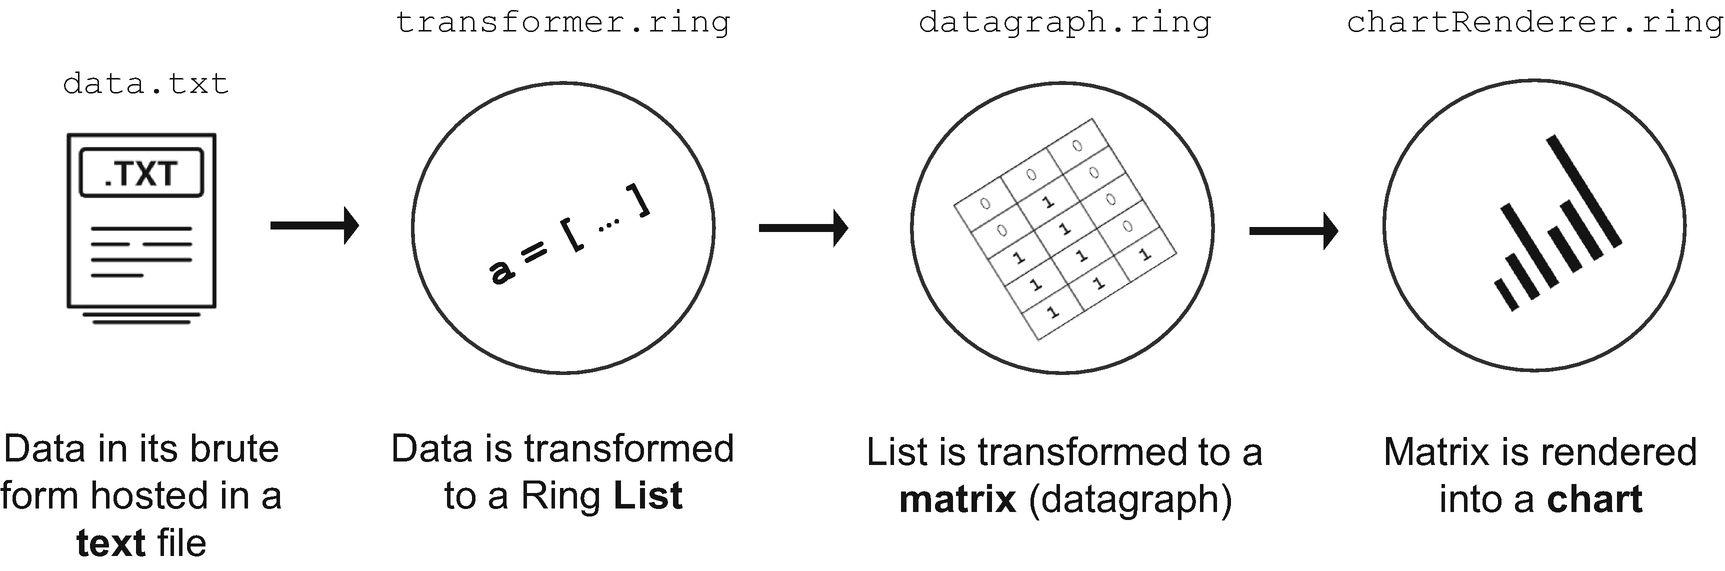
A visual design of the actual data acquisition and tranformation solution
Our system begins with a data hosted in a structured text file, which is transformed to a native Ring List to make it programmable. Then we compute that data into a matrix (datagraph) to prepare it for rendering without hassle. Finally, the matrix is parsed and rendered in a bar chart contained in a native Ring String. The string is shown on the screen.
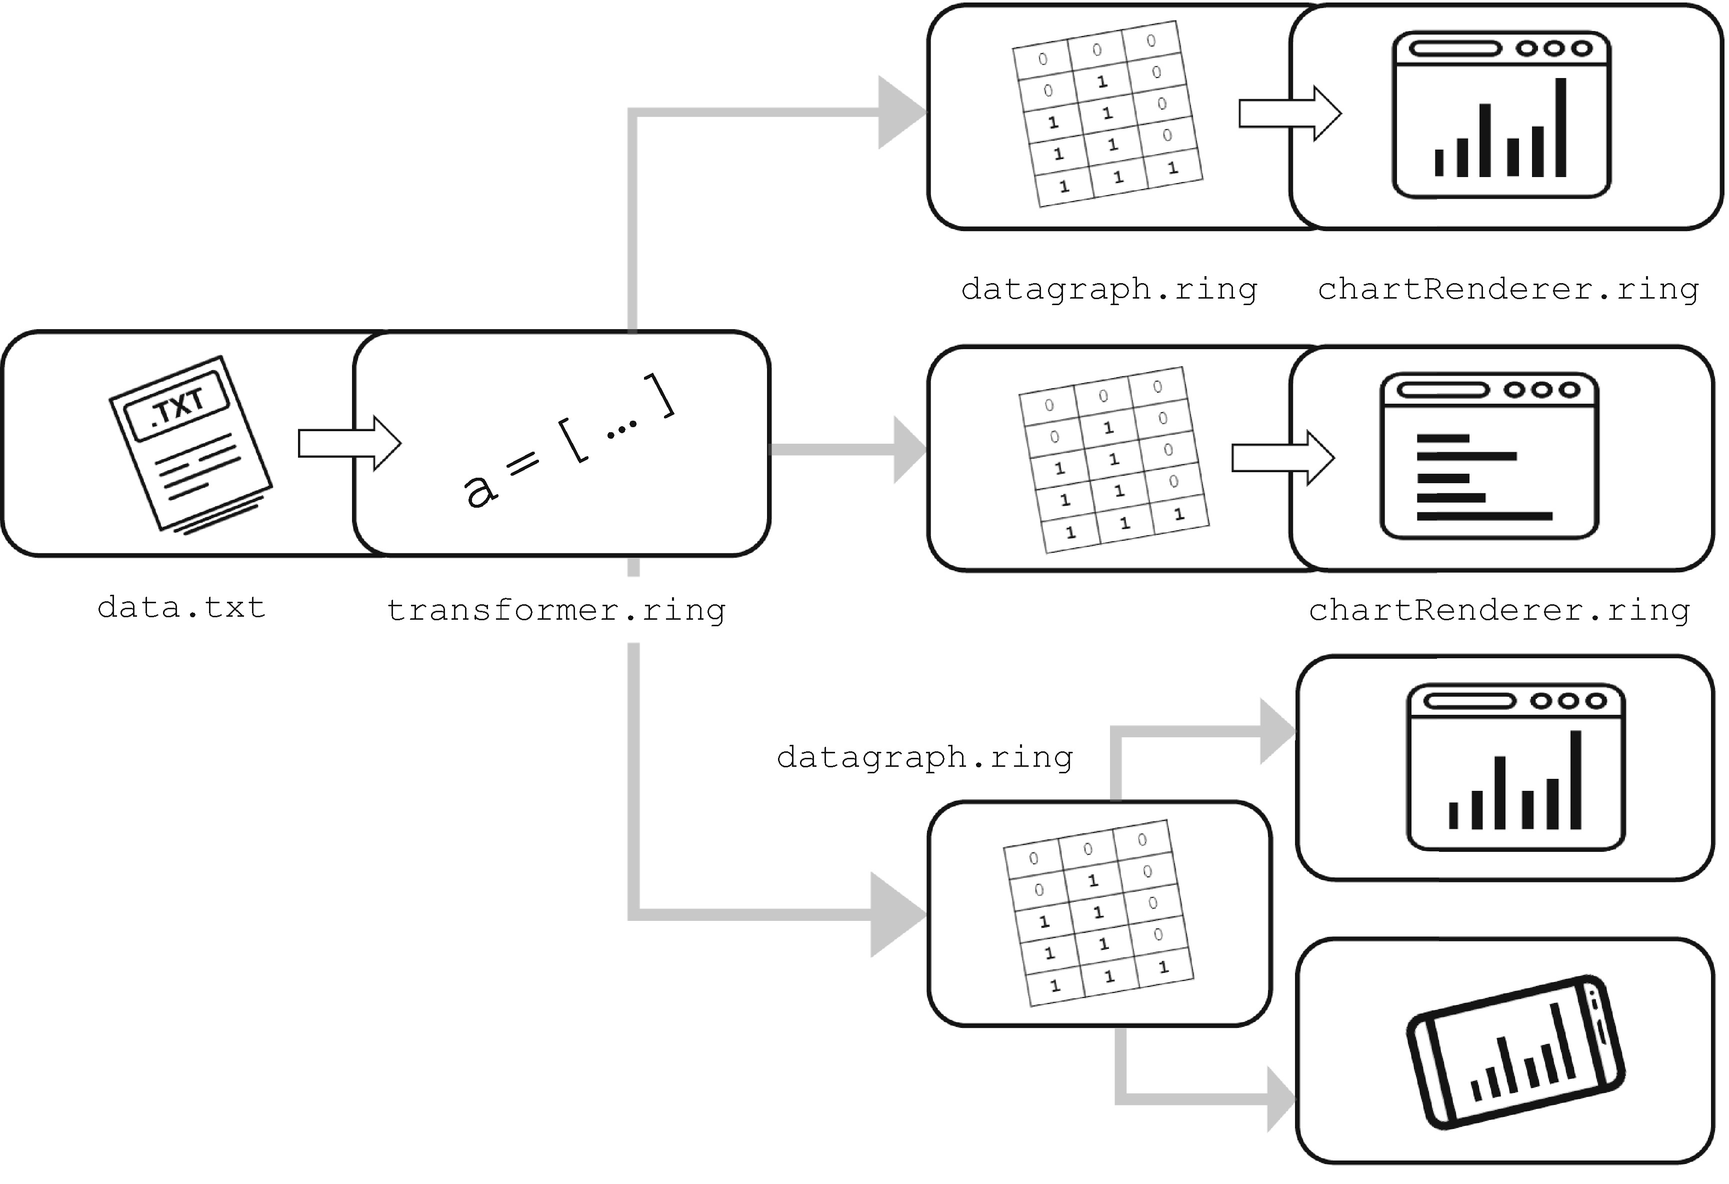
A visual design of the target data acquisition and tranformation solution
At the bottom in the figure, in particular, the same datagraph.ring file has been used to render a bar chart in two different platforms, a web browser and a mobile phone. In real-world projects, this decision can be motivated by the fact that the rendering technology used on both platforms is the same: a cross-platform web engine, like WebKit,77 for example (on which Qt WebView and by consequence the Ring Form Designer WebView widget are based) running on a desktop and also on mobile devices.78
What we are concerned with in this chapter, however, is data input, so let’s stay focused on achieving extensibility on the left side of the architecture and not on its right side. Next, we implement the feature of switching between a text data source and a database data source without impacting the whole system we have built so far.
Switching Between Text and Database Data Sources
Take a deep breath; now we are tackling step 7 of our seven-step exercise. In a minute we will be harvesting the fruits of all of our labor in the chapter.
config.txt
config.txt
Our bar chart should be there with the same data displayed on the screen, but coming this time from a database and not a text file and without being impacted by the fundamental change of data source we’ve just made. Think about it for a while: how exactly can we make it happen?
Well, many answers are possible. The one that first comes to my mind is to adapt the first three lines of transformer.ring by removing the code responsible for connecting a text file and replacing it with code connecting to a database. This means that a transformer must be written to every data source. You can go for it, but one can argue that there will be a cost. Think of the situation where your system contains 30 transformers for 10 different data sources and the logic of transformation itself needs to be changed. Your cost can be devided by 1079 if you had only one place that does transformation independently from the data source. Right?

The solution design, made flexible from the right side (multiple data format input)
Without delay, let’s experiment with this design option by implementing a universal data connector in Ring.
Implementing a Universal Data Connector

Refactoring the transformer by separating two concerns: connection and tranformation
For the separation to be effective, a particular focus should be put on the zone in between (3). In fact, this zone stimulates us to ask an important question: what is the intermediary data that format zone (2) needs to be fed so it does its job without caring about how zone (1) is working?
We went back to these details because it is always useful to develop a memorable mental model of the system in hand before you undertake any refactoring that impacts its structure. In particular, the first criteria of a successful separation of concerns, like the one we are planning to make here, is to get the same result as before while enhancing the organization of the program parts.
Another thing you should always remember is the goal of the refactoring project itself, expressed in terms of the value you will gain. This is easy to lose, like a needle in a haystack, owing to the throng of technical details and sometimes because of feelings of anxiety and puzzling frustration. In our case, the refactoring is made to allow us to diversify our data sources while keeping untouched the same chain of operations coming after the connection staff: transformation and rendering of the final chart.

Necessary work to separate the connection and transformation concerns
connector.ring
connector.ring
Save it in the same NorthAfricaApp folder . From the original transformer.ring file, ensure that the // Preparations part formed from the first three lines was deleted and save the file as is with the same name. Now the transformer contains just the remaining code, which is really responsible for the transformation job.
To test the system, add a load connector.ring line at the beginning of transformer.ring and then go to chartrenderer.ring and execute it (Ctrl+F5). As shown in the output window, our bar chart, safe and sound, salutes us again.
Adapting the Connector to the Database
It seems like we achieved our goal, but we didn’t. Remember that the separation has been made to support other types of connections like a database. So, let’s verify whether the data structure returned by the database connection obeys the same format returned by the connection to the text file.
Part of database.ring
Run aResult[1] to show the first element of the list.
For the first element, show its first and second elements by trying aResult[1][1] and aResult[1][2], respectively.
Do the same with other numbers from 1 to 6.
In database.ring, replace the last line of ? aResult with ? list2code(aResult).
Execute the file to show the result in the Output window.
Some data format unification work is then necessary!
Unifying the Data Format Delivered by the Connector
Variables must be extracted from the first line of the source aResult[] and stored as a list in the first line of the target a[].
Data must be extracted from the source aResult[], one country per line, and stored sequentially in the target a[].

Transforming data into a universal format
dbconnector.ring
Save this dbconnector.ring file in the NorthAfricaApp folder. At the same time, go back to the connector.ring file and rename it as txtconnector.ring . In the NorthAfricaApp folder, physically delete the connector.ring file since we no longer need it. Also, in the same folder, delete the binary file of the SqlLite database, northafrica.db, so we can restart the chain on a clean base.
Tired? I understand. Now we can test everything and see whether the work done about the seventh and last point in the solution script we agreed on at the beginning of the section will be rewarding.
Testing Our Data Acquisition Architecture
You know what? We have reached step 7 in our plan for our refactoring project!
- 1.
In transformer.ring, change the first line load "connector.ring" to load "txtconnector.ring".
- 2.
Activate the tab of the chartRenderer.ring file (open it again if you closed it) and execute it (Ctrl+F5). Let’s look together at the Output window in Ring Notepad and say: “Hello dear chart!”
- 3.
Back in transformer.ring, change the first line with dbconnector.ring.
- 4.
Go to chartrenderer.ring again, execute it, and look at the Output window. It says: “Hello dear same chart!”
The bar chart is displayed without structurally changing any file in our pipeline other than specifying the good connection file in transformer.ring. We didn’t even touch the datagraph.ring and chartRenderer.ring files. That is awesome, except there’s one little detail: the final refinement.
Final Refinement

The current loading flow diagram of the NorthAfrica app
It is not a bad choice right now, but if the system gains in complexity and more calls become necessary, then you, or any reader of your code, might get confused. To avoid this situation, we will relay all the load calls in our program to a single new file. For that, create a new file in the NorthAfricaApp folder and name it, simply, northafrica.ring.

Finding files in Ring folders
Note that I have highlighted some files (connector.ring, database.ring, and tempo.ring). They are not needed, so it is better to delete them from the NorthAfricaApp folder (clean is clean, isn’t it?).
After all the loads are deleted (except those that are specific to loading StdLib and SqlLiteLib libraries), open “Find in files” and perform the same search to ensure you have no unwanted results and something was not left behind.
northAfrica.ring
Execute it (northAfrica.ring). It’s functional.
Personally, I would go a little further to establish a semantic meaning for this piece of code. In fact, calling the datagraph and the transformer are two specific functions I can delegate to the chart renderer. So, I cut the load "transformer.ring" and load "datagraph.ring" lines from the current northafrica.ring file and paste them at the beginning of chartRenderer.ring. I test the app, and I find that everything is OK.
Part of chartRenderer.ring
northAfrica.ring
- 1.
Read the default data source from the config.txt file.
- 2.
Call the txtconnector.ring file if DATASOURCE="text" and call dbconnector.ring if DATASOURCE="database".
- 3.
In the main northafrica.ring file, replace the first line load "txtconnector.ring" (or "dbconnector.ring" if you changed it) with load "chartprepare.ring".
northAfrica.ring
Other Inputs
Inputs from the Web (HTML pages) and the Internet APIs (HTTP requests)
Inputs from binary files (images, voice, etc.)
Inputs from XML files
Inputs from Office software (Microsoft Word and Excel)
Inputs from legacy business software suites (SAP BAPI or Salesforce API)
Inputs from gestures on the screen of a mobile phone and from body gestures in front of the Xbox gaming console
Summary
Even if you decide not to go deeper with this connectivity forest (after all, you are learning how to program and not how to make a gigantic data acquisition and analytics engine82), rest assured: this chapter gave you the skills you need to deal with the most common input scenarios you may encounter in your real software projects. So please, don’t move on if this chapter is not 100 percent mastered.83 Read it again, write your own version of the code, and if you can, design a whole new clean architecture, with a different number of layers, other data formats, and more connections.
It is Sunday, July 28, 2019: Tunisia and Cameroon are to vie for the men’s African Nations title in volleyball. Guaranteed, it will be a hot competition between the Falcons of Carthage and the Lions of Africa! Can I leave, please?