Chapter 1
Why Big Data?
Introduction
It is the year 2032, and with a wave of your arm, your embedded chip authenticates you to log into your trading portal. For years, Swedes have already been placing chips above their thumb to activate their train tickets or to store their medical records.1 Privacy, Big Brother, and health concerns aside, the sheer volume of data collected by IDs from everything from nail salons through subway stations is staggering, yet needs to be analyzed in real time to draw competitive inferences about impending market activity.
Do you think this is an unlikely scenario? During World War II, a passive ID technology was developed to leave messages for one's compatriots inside practically any object. The messages were written in tin foil, but were virtually unnoticeable by one's enemy. They could last forever since they didn't contain a battery or any other energy source, and they were undetectable as they did not emit heat or radiation. The messages were only accessible by the specific radio frequency for which they were written – a radio scanner set to a specific wavelength could pick up the message from a few feet away, without holding or touching the object.
Today, the technology behind these messages has made its way into Radio-Frequency Identification devices, RFIDs. They are embedded into pretty much every product you can buy in any store. They are activated at checkout and at the exit, where giant scanners examine you for any unpaid merchandise in your possession. Most importantly, RFIDs are used to collect data about your shopping preferences, habits, tastes, and lifestyle. They know whether you prefer red to green, if you buy baby products, and if you drink organic orange juice. And did you know that nine out of every ten purchases you make end up as data transmitted through the Internet to someone's giant private database that is a potential source of returns for a hedge fund?
Welcome to the world of Big Data Finance (BDF), a world where all data have the potential of ending up in a hedge fund database generating extra uncorrelated returns. Data like aggregate demand for toothpaste may predict the near-term and long-term returns of toothpaste manufacturers such as Procter & Gamble. A strong trend toward gluten-free merchandise may affect the way wheat futures are traded. And retail stores are not alone in recording consumer shopping habits: people's activity at gas stations, hair salons, and golf resorts is diligently tracked by credit card companies in data that may all end up in a hedge fund manager's toolkit for generating extra returns. Just like that, a spike in demand for gas may influence short-term oil prices.
Moving past consumer activity, we enter the world of business-to-business (B2B) transactions, also conducted over the Internet. How many bricks are ordered from specific suppliers this spring may be a leading indicator of new housing stock in the NorthEast. And are you interested in your competitor's supply and demand? Many years ago, one would charter a private plane to fly over a competitor's manufacturing facility to count the number of trucks coming and going as a crude estimate of activity. Today, one can buy much less expensive satellite imagery and count the number of trucks without leaving one's office. Oh, wait, you can also write a computer program to do just that instead.
Many corporations, including financial organizations, are also sitting on data they don't even realize can be used in very productive ways. The inability to identify useful internal data and harness them productively may separate tomorrow's winners from losers.
Whether you like it or not, Big Data is influencing finance, and we are just scratching the surface. While the techniques for dealing with data are numerous, they are still applied to only a limited set of the available information. The possibilities to generate returns and reduce costs in the process are close to limitless. It is an ocean of data and whoever has the better compass may reap the rewards.
And Big Data does not stop on the periphery of financial services. The amount of data generated internally by financial institutions are at a record-setting number. For instance, take exchange data. Twenty years ago, the exchange data that were stored and distributed by the financial institutions comprised Open, High, Low, Close, and Daily Volume for each stock and commodity futures contract. In addition, newspapers printed the yield and price for government bonds, and occasionally, noon or daily closing rates for foreign exchange rates. These data sets are now widely available free of charge from companies like Google and Yahoo.
Today's exchanges record and distribute every single infinitesimal occurrence on their systems. An arrival of a limit order, a limit order cancellation, a hidden order update – all of these instances are meticulously timestamped and documented in maximum detail for posterity and analysis. The data generated for one day by just one exchange can measure in terabytes and petabytes. And the number of exchanges is growing every year. At the time this book was written, there were 23 SEC-registered or “lit” equity exchanges in the U.S. alone,2 in addition to 57 alternative equity trading venues, including dark pools and order internalizers.3 The latest exchange addition, the Silicon Valley-based Long Term Stock Exchange, was approved by the regulators on May 10, 2019.4
These data are huge and rich in observations, yet few portfolio managers today have the necessary skills to process so much information. To that extent, eFinancialCareers.com reported on April 6, 2017 that robots are taking over traditional portfolio management jobs, and as many as 90,000 of today's well-paid pension-fund, mutual-fund, and hedge-fund positions are bound to be lost over the next decade.5 On the upside, the same article reported that investment management firms are expected to spend as much as $7 billion on various data sources, creating Big Data jobs geared at acquiring, processing, and deploying data for useful purposes.
Entirely new types of Big Data Finance professionals are expected to populate investment management firms. The estimated number of these new roles is 80 per every $3 billion of capital under management, according to eFinancialCareers. The employees under consideration will comprise:
- Data scouts or data managers, whose job already is and will continue to be to seek the new data sources capable of delivering uncorrelated sources of revenues for the portfolio managers.
- Data scientists, whose job will expand into creating meaningful models capable of grabbing the data under consideration and converting them into portfolio management signals.
- Specialists, who will possess a deep understanding of the data in hand, say, what the particular shade of the wheat fields displayed in the satellite imagery means for the crop production and respective futures prices, or what the market microstructure patterns indicate about the health of the market.
And this trend is not something written in the sky, but is already implemented by a host of successful companies. In March 2017, for example, BlackRock made news when they announced the intent to automate most of their portfolio management function. Two Sigma deploys $45 billion, employing over 1,100 workers, many of whom have data science backgrounds. Traditional human-driven competition is, by comparison, suffering massive outflows and scrambling to find data talent to fill the void, the Wall Street Journal reports.
A recent Vanity Fair article by Bess Levin reported that when Steve Cohen, the veteran of the financial markets, reopened his hedge fund in January 2018, it was to be a leader in automation.6 According to Vanity Fair, the fund is pursuing a project to automate trading “using analyst recommendations as an input, the effort involves examining the DNA of trades: the size of positions; the level of risk and leverage.” This is one of the latest innovations in Steve Cohen's world, a fund manager whose previous shop, SAC in Connecticut, was one of the industry's top performers. And Cohen's efforts appear to be already paying off. On December 31, 2019, the New York Post called Steve Cohen “one of the few bright spots in the bad year for hedge funds” for beating out most peers in fund performance.7
Big Data Finance is not only opening doors to a select group of data scientists, but also an entire industry that is developing new approaches to harness these data sets and incorporate them into mainstream investment management. All of this change also creates a need for data-proficient lawyers, brokers, and others. For example, along with the increased volume and value of data come legal data battles. As another Wall Street Journal article reported, April 2017 witnessed a legal battle between the New York Stock Exchange (NYSE) and companies like Citigroup, KCG, and Goldman Sachs.8 At issue was the ownership of order flow data submitted to NYSE: NYSE claims the data are fully theirs, while the companies that send their customers' orders to NYSE beg to differ. Competent lawyers, steeped in data issues, are required to resolve this conundrum. And the debates in the industry will only grow more numerous and complex as the industry develops.
The payouts of studying Big Data Finance are not just limited to guaranteed employment. Per eFinancialCareers, financial quants are falling increasingly out of favor while data scientists and those proficient in artificial intelligence are earning as much as $350,000 per year right out of school.9
Big Data scientists are in demand in hedge funds, banks, and other financial services companies. The number of firms paying attention to and looking to recruit Big Data specialists is growing every year, with pension funds and mutual funds realizing the increasing importance of efficient Big Data operations. According to Business Insider, U.S. bank J.P. Morgan alone has spent nearly $10 billion dollars just in 2016 on new initiatives that include Big Data science.10 Big Data science is a component of most of the bank's new initiatives, including end-to-end digital banking, digital investment services, electronic trading, and much more. Big Data analytics is also a serious new player in wealth management and investment banking. Perhaps the only area where J.P. Morgan is trying to limit its Big Data reach is in the exploitation of retail consumer information – the possibility of costly lawsuits is turning J.P. Morgan onto the righteous path of a champion of consumer data protection.
According to Marty Chafez, Goldman Sachs' Chief Financial Officer, Goldman Sachs is also reengineering itself as a series of automated products, each accessible to clients through an Automated Programming Interface (API). In addition, Goldman is centralizing all its information. Goldman's new internal “data lake” will store vast amounts of data, including market conditions, transaction data, investment research, all of the phone and email communication with clients, and, most importantly, client data and risk preferences. The data lake will enable Goldman to accurately anticipate which of its clients would like to acquire or to unload a particular source of risk in specific market conditions, and to make this risk trade happen. According to Chafez, data lake-enabled business is the future of Goldman, potentially replacing thousands of company jobs, including the previously robot-immune investment banking division.11
What compels companies like J.P. Morgan and Goldman Sachs to invest billions in financial technology and why now and not before? The answer to the question lies in the evolution of technology. Due to the changes in the technological landscape, previously unthinkable financial strategies across all sectors of the financial industry are now very feasible. Most importantly, due to a large market demand for technology, it is mass-produced and very inexpensive.
Take regular virtual reality video games as an example. The complexity of the 3-D simulation, aided by multiple data points and, increasingly, sensors from the player's body, requires simultaneous processing of trillions of data points. The technology is powerful, intricate, and well-defined, but also an active area of ever-improving research.
This research easily lends itself to the analytics of modern streaming financial data. Not processing the data leaves you akin to a helpless object in the virtual reality game happening around you – the virtual reality you cannot escape. Regardless of whether you are a large investor, a pension fund manager, or a small-savings individual, missing out on the latest innovations in the markets leaves you stuck in a bad scenario.
Why not revert to the old way of doing things: calmly monitoring daily or even monthly prices – doesn't the market just roll off long-term investors? The answer is two-fold. First, as shown in this book, the new machine techniques are able to squeeze new, nonlinear profitability from the same old daily data, putting traditional researchers at a disadvantage. Second, as the market data show, the market no longer ebbs and flows around long-term investment decisions, and everyone, absolutely everyone, has a way of changing the course of the financial markets with a tiniest trading decision.
Most orders to buy and sell securities today come in the smallest sizes possible: 100 shares for equities, similar minimal amounts for futures, and even for foreign exchange. The markets are more sensitive than ever to the smallest deviations from the status quo: a new small order arrival, an order cancellation, even a temporary millisecond breakdown in data delivery. All of these fluctuations are processed in real time by a bastion of analytical artillery, collectively known as Big Data Finance. As in any skirmish, those with the latest ammunition win and those without it are lucky to be carried off the battlefield merely wounded.
With pension funds increasingly experiencing shortfalls due to poor performance and high fees incurred by their chosen sub-managers, many individual investors face non-trivial risks. Will the pension fund inflows from new younger workers be enough to cover the liabilities of pensioners? If not, what is one to do? At the current pace of withdrawals, many retirees may be forced to skip those long-planned vacations and, yes, invest in a much-more affordable virtual reality instead.
It turns out that the point of Big Data is not just about the size of the data that a company manages, although data are a prerequisite. Big Data comprises a set of analytical tools that are geared toward the processing of large data sets at high speed. “Meaningful” is an important keyword here: Big Data analytics are used to derive meaning from data, not just to shuffle the data from one database to another.
Big Data techniques are very different from traditional Finance, yet very complementary, allowing researchers to extend celebrated models into new lives and applications. To contrast traditional quant analysis with machine learning techniques, Breiman (2001) details the two “cultures” in statistical modeling. To reach conclusions about the relationships in the data, the first culture of data modeling assumes that the data are generated by a specific stochastic process. The other culture of algorithmic modeling lets the algorithmic models determine the underlying data relationships and does not make any a priori assumptions on the data distributions. As you may have guessed, the first culture is embedded in much of traditional finance and econometrics. The second culture, machine learning, developed largely outside of finance and even statistics, for that matter, and presents us ex ante with a much more diverse field of tools to solve problems using data.
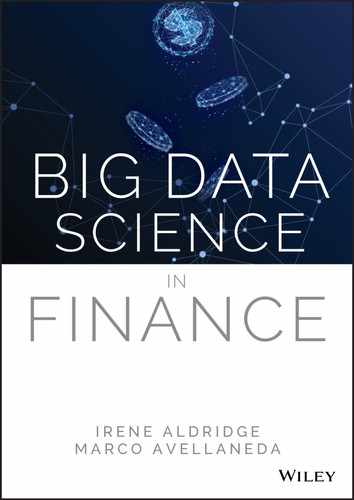
The data observations we collect are often generated by a version of “nature's black box” – an opaque process that turns inputs x into outputs y (see Figure 1.1). All finance, econometrics, statistics and Big Data professionals are concerned with finding:
- Prediction: responses y to future input variables x.
- Information: the intrinsic associations of x and y delivered by nature.
While the two goals of the data modeling traditionalists and the machine learning scientists are the same, their approaches are drastically different as illustrated in Figure 1.2. The traditional data modeling assumes an a priori function of the relationship between inputs x and outputs y:
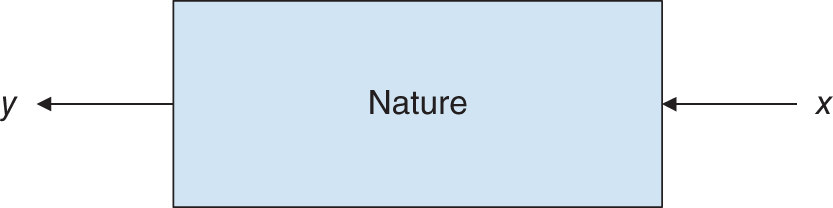
Figure 1.1 Natural data relationships: inputs x correspond to responses y.
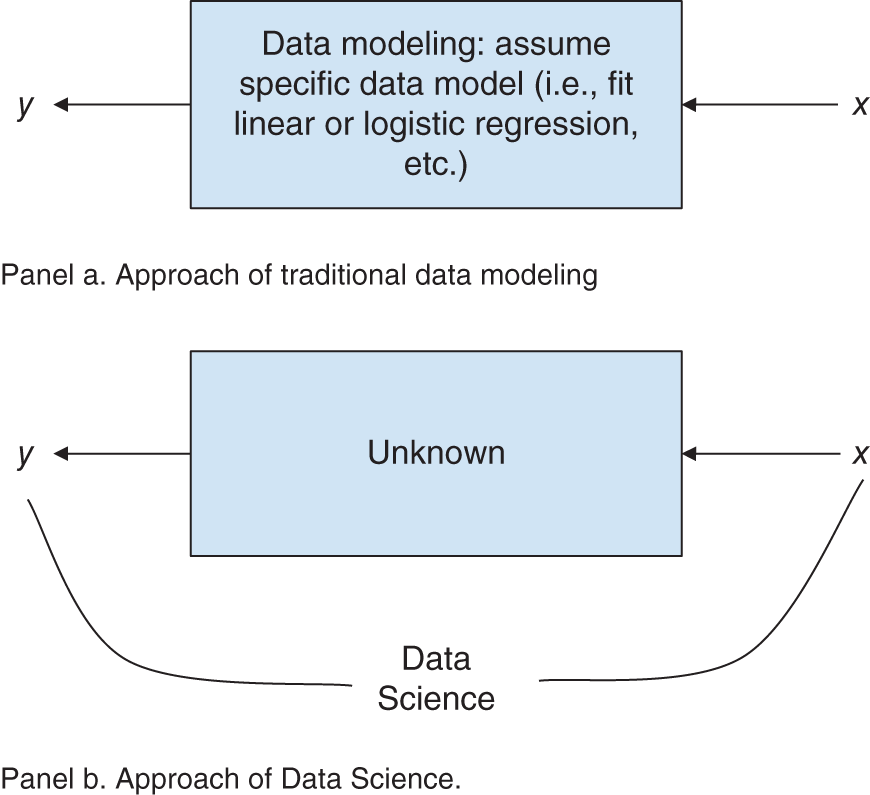
Figure 1.2 Differences in data interpretation between traditional data modeling and data science per Breiman (2001).
Following the brute-force fit of data into the chosen function, the performance of the data fit is evaluated via model validation: a yes–no using goodness-of-fit tests and examination of residuals.
The machine learning culture assumes that the relationships between x and y are complex and seeks to find a function ![]() , which is an algorithm that operates on x and predicts y. The performance of the algorithm is measured by predictive accuracy of the function on the data not used in the function estimation (the “out-of-sample” data set).
, which is an algorithm that operates on x and predicts y. The performance of the algorithm is measured by predictive accuracy of the function on the data not used in the function estimation (the “out-of-sample” data set).
And what about artificial intelligence (AI), this beast that evokes images of cyborgs in Arnold Schwarzenegger's most famous movies? It turns out that AI is a direct byproduct of data science. The traditional statistical or econometric analysis is a “supervised” approach, requiring a researcher to form a “hypothesis” by asking whether a specific idea is true or false, given the data. The unfortunate side effect of the analysis has been that the output can only be as good as the input: a researcher incapable of dreaming up a hypothesis “outside the box” would be stuck on mundane inferences. The “unsupervised” Big Data approach clears these boundaries; it instead guides the researcher toward the key features and factors of the data. In this sense, the unsupervised Big Data approach explains all possible hypotheses to the researcher, without any preconceived notions. The new, expanded frontiers of inferences are making even the dullest accountant-type scientists into superstars capable of seeing the strangest events appear on their respective horizons. Artificial intelligence is the result of data scientists letting the data do the talking and the breathtaking results and business decisions this may bring. The Big Data applications discussed in this book include fast debt rating prediction, fast and optimal factorization, and other techniques that help risk managers, option traders, commodity futures analysts, corporate treasurers, and, of course, portfolio managers and other investment professionals, market makers, and prop traders make better and faster decisions in this rapidly evolving world.
Well-programmed machines have the ability to infer ideas and identify patterns and trends with or without human guidance. In a very basic scenario, an investment case for the S&P 500 Index futures could switch from a “trend following” or “momentum” approach to a “contrarian” or “market-making” approach. The first technique detects a “trend” and follows it. It works if large investors are buying substantial quantities of stocks, so that the algorithms could participate as prices increase or decrease. The second strategy simply buys when others sell and sells when others buy; it works when the market is volatile but has no “trend.” One of the expectations of artificial intelligence and machine learning is that Big Data robots can “learn” how to detect trends, counter trends – as well as periods of no trend – attempting to make profitable trades in the different situations by nimbly switching from one strategy to another, or staying in cash when necessary.
Big Data science refers to computational inferences about the data set being used: the bigger the data, the better. The biggest sets of data, possibly spanning all the data available within an enterprise in loosely connected databases or data repositories, are known as data lakes, vast containers filled with information. The data may be dark, which is collected, yet unexplored and unused by the firm. The data may also be structured, fitting neatly into rows and columns of a table, for example, like numeric data. Data also can be unstructured, as in something requiring additional processing prior to fitting into a table. Examples of unstructured data may include recorded human speech, email messages, and the like.
The key issue surrounding the data, and, therefore, covered in this book, is data size, or dimensionality. In the case of unstructured data that are not presented in neat tables, how many columns would it take to accommodate all of the data's rich features? Traditional analyses were built for small data, often manageable with basic software, such as Excel. Big Data applications comprise much larger sets of data that are unwieldy and cannot even be opened in Excel-like software. Instead, Big Data applications require their own processing engines and algorithms, often written in Python.
Exactly what kinds of techniques do Big Data tools comprise? Neural networks, discussed in Chapter 2, have seen a spike of interest in Finance. Computationally intensive, but benefiting from the ever-plummeting costs of computing, neural networks allow researchers to select the most meaningful factors from a vast array of candidates and estimate non-linear relationships among them. Supervised and semi-supervised methods, discussed in Chapter 3 and 4, respectively, provide a range of additional data mining techniques that allow for a fast parametric and nonparametric estimation of relationships between variables. Unsupervised learning discussion begins in Chapter 5 and goes on through the end of the book, covering dimensionality reduction, separating signals from noise, portfolio optimization, optimal factor models, Big Data clustering and indexing, missing data optimization, Big Data in stochastic modeling, and much more.
All the techniques in this book are supported by theoretical models as well as practical applications and examples, all with extensive references, making it easy for researchers to dive independently into any specific topic. Best of all, all the chapters include Python code snippets in their Appendices and also online on the book's website, BigDataFinanceBook.com, making it a snap to pick a Big Data model, code it, test it, and put it into implementation.
Happy Big Data!
Appendix 1.A Coding Big Data in Python
This book contains practical ready-to-use coding examples built on publicly available data. All examples are programmed in Python, perhaps the most popular modeling language for data science at the time this book was written. Since Python's syntax is very similar to those of other major languages, such as C++, Java, etc., all the examples presented in this book can be readily adapted to your choice of language and architecture.
To begin coding in Python, first download the Python software. One of the great advantages of Python is that the software is free! To download and install Python, go to https://www.python.org/downloads/, select the operating system of the computer on which you are planning to install and run Python, and click “Download.” Fair Warning: At the time this book was written, the latest Python software version was 3.7.2. Later versions of Python software may have different commands or syntax. The readers may experience some issues with different versions of the Python software.
After saving the installation file, and installing Python software, open the IDLE editor that comes with the package. The editor typically has a white icon that can be located in the Apps menu. The editor allows one to save Python modules as well as dynamically check for errors and run the modules in the shell with just a click of the “F5” button. In contrast, the black IDLE icon opens an old-school less-user-friendly Python shell without the ability to open an editor. Figure 1.A.1 shows the Apps menu with the white IDLE editor icon circled.
In the editor that opens, select “File -> New” to open a new instance of a Python module. You may choose to save the module right away to avoid accidental loss of your code. To save the file, select “File -> Save As,” navigate to your desired location, and enter the name of the file, for example, “NeuralNetworkSPY_101.py.” By convention, all Python files have “.py” extension, similar to “.cpp” of C++ files or “.m” of Matlab files.

Figure 1.A.1 Selecting the user-friendly Python editor upon installation.
Opening a Data File in Python
The first step to a successful data analysis is opening a data file and correctly extracting the content. Here, we show step-by-step instructions to opening a Yahoo! Finance historical data file and loading the content into Python variables.
As a first exercise, we grab and open the entire Yahoo! Finance file for the S&P 500 ETF (NYSE:SPY) we downloaded previously. The file contains 10 years of daily data with the following fields:
- Date in YYYY-MM-DD format
- Daily open
- Daily high
- Daily low
- Daily close
- Daily adjusted close (accounting for dividends and share splits, where applicable)
- Daily cumulative trading volume recorded across all the U.S. exchanges.
The first ten lines of the input data (ten years of daily data for NYSE:SPY from Yahoo! Finance) are shown as in Figure 1.A.2.
We downloaded and saved the SPY data from Yahoo! Finance as SPY_Yahoo_2009-2019.csv in “C:/Users/A/Documents/Data” directory. Please note the forward slashes in the directory name. As with other computer languages, Python balks at the single backward slashes in strings, causing errors.
To open the file and display the first ten lines, type the Python code snippet shown in Figure 1.A.3 into the Python editor, remembering to replace the directory shown with your own directory name.
Figure 1.A.2 The first 10 lines of data input (ten years of daily data for NYSE:SPY from Yahoo! Finance).
Figure 1.A.3 Python code opening a Yahoo! Finance daily history data and displaying the first ten rows.
Save the module by selecting “File -> Save” or pressing “Ctrl” and “S” keys at the same time. Now, you can run your Python module by pressing the “F5” key or selecting “Run -> Run Module” from the top bar menu.
If you have just installed Python and are using it for the first time, you may receive the following error:
ModuleNotFoundError: No module named ‘numpy’ The error says that you need to install an add-on library called numpy. To do so:
- Open a brand-new Python module (select File->New File in Python server). If you do not see the menu at the top of your Python server window, you are in the wrong application. Go back to the Python folder and select the first Python server application that appears there. Once you open a new module, please type the following commands inside the module and press F5 to run the commands to find the location of python.exe:
import sys; print(sys.executable)The location will appear in the server window and may be something like C:UsersAProgramsPythonPython37-32pythonw.exe
- Open a command prompt/shell. To do so in Microsoft Windows, search for “cmd.”
- Navigate to the directory where pythonw.exe is installed, as shown in step 1 above.
- Run the following command:
python -m pip install numpy.If you encounter errors again, you need to download an installing utility first: runpython -m ensurepipto do so, then runpython -m pip install numpy.You should be all set. - To execute other programs throughout this book, however, you will need to install additional libraries, namely,
randomfor advanced number generation,matplotlibfor plotting data, andscipyfor scientific statistics functions like skewness. To do so, please runpython -m pip install random, python -m pip install matplotlib, python -m pip install scipyandpython -m pip install pandasfrom the command line.
Tip: during your Python programming, you may encounter the following error on the Python server: “Subprocess startup error: IDLE's subprocess didn't make a connection.” Either IDLE can't start a subprocess or personal firewall software is blocking the connection. The error dialogue box is shown in Figure 1.A.4.
To fix the issue, simply close the existing instance of the server, but leave the Python module open. Then, press F5 on the existing module to run it again – a new server instance will open. This workaround is guaranteed to save you time in the programming process! The alternative of closing all the Python windows and then restarting the server from the start-up menu is too time-consuming.
When you run the module for the first time, a Python shell opens with potential errors and output of the module. In our case, the output looks like the text shown in Figure 1.A.5. Since numpy is configured to deal with numbers, the first row and the first columns are replaced by nan, while all other numbers are presented in scientific notation:
Let's examine our first program, shown in Figure 1.A.3. The first line directs us to import numpy, a Python library the name of which sounds like a cute animal, but actually stands for NumPy – Python's numerical manipulation library. After importing the library and its component, the next line instructs Python to open our data file and store it in a variable called my_data. Next, we display exactly 10 rows of the data file and then exit the program. While 10 is an arbitrary number, the restriction on the total lines displayed is in place to prevent Python from using too many system resources. In particular, Python tends to struggle and “hang up” when asked to display large chunks of data.
Figure 1.A.4 Error dialogue box.
Figure 1.A.5 The output of the first Python program, the code for which is shown in Figure 1.A.3.
If you come to Python from Java, C++, or Perl, you'll immediately notice numerous similarities as well as differences. On the differences front, the lines do not end in a semicolon! Instead, the lines are terminated by a new line character. Variables are type-less, that is, the coder does not need to tell the compiler ahead of time whether the new variable is bound to be an integer or a string. Single-line comments are marked with # at the beginning of a commented-out line, and with “ ” at the beginning and the end of the comment block. On the similarity side, Python's structure and keywords largely follow preexisting languages' convention: keywords like “class,” “break,” and “for” are preserved as well as many other features, making the transition from most programming languages into Python fairly intuitive.
If you encounter any issues successfully running your first Python program of this book, Google is possibly your best bet as a solution finder. Just type any questions or error codes into the Google prompt, and you may be amazed at the quantity and quality of helpful material available online to assist you with your problem. Once our first program runs successfully, we will proceed with the more complicated task of actually building our first neural network.
While techniques discussed in this book are applicable across a wide range of applications, including credit risk rating and Natural Language Processing (NLP) of documents like financial statements, the main focus of this book remains portfolio management and trading. As such, most of the examples in the book will be focused on predictability of future realizations of prices, returns, and other metrics that help portfolio managers make educated investment decisions.
Reference
- Breiman, L. (2001). Statistical modeling: The two cultures (with comments and a rejoinder by the author). Statistical Science 16(3): 199–231.
Notes
- 1 NPR, October 22, 2018, “Thousands of Swedes Are Inserting Microchips Under Their Skin.” All Things Considered. Available at: https://www.npr.org/2018/10/22/658808705/thousands-of-swedes-are-inserting-microchips-under-their-skin
- 2 U.S. Securities and Exchange Commission, Investor Information. Available at: https://www.sec.gov/fast-answers/divisionsmarketregmrexchangesshtml.html
- 3 U.S. Securities and Exchange Commission, Alternative Trading System (“ATS”) List, Alternative Trading Systems with Form ATS on File with the SEC as of November 30, 2019. Available at: https://www.sec.gov/foia/docs/atslist.htm
- 4 “U.S. Regulators Approve New Silicon Valley Stock Exchange.” Reuters, May 10, 2019. Available at: https://www.reuters.com/article/us-usa-sec-siliconvalley/u-s-regulators-approve-new-silicon-valley-stock-exchange-idUSKCN1SG21K
- 5 EFinancialCareers, April 6, 2017. “The New Buy-Side Winners as Big Data Takes Over.” Available at: http://news.efinancialcareers.com/uk-en/279725/the-new-buy-side-winners-as-big-data-takes-over/
- 6 Vanity Fair, March 15, 2017. “Steve Cohen Ramping Up Effort to Replace Idiot Humans with Machines.” Available at: http://www.vanityfair.com/news/2017/03/steve-cohen-ramping-up-effort-to-replace-idiot-humans-with-machines
- 7 New York Post, December 31, 2019. “Steve Cohen One of Few Bright Spots in Bad Year for Hedge Funds.” Available at: https://nypost.com/2019/12/31/steve-cohen-one-of-few-bright-spots-in-bad-year-for-hedge-funds/
- 8 Wall Street Journal, April 6, 2017. “With 125 Ph.D.s in 15 Countries, a Quant ‘Alpha Factory’ Hunts for Investing Edge.” Available at: https://www.wsj.com/articles/data-clash-heats-up-between-banks-and-new-york-stock-exchange-1491471000
- 9 EFinancialCareers, March 23, 2017, “You Should've Studied Data Science.” Available at: http://news.efinancialcareers.com/us-en/276387/the-buy-side-is-having-to-sweeten-offers-to-ai-experts-data-scientists-and-quants
- 10 Business Insider, April 7, 2017. “JP Morgan's Fintech Strategy.” Available at: http://www.businessinsider.com/jpmorgans-fintech-strategy-2017-4
- 11 Business Insider, April 6, 2017. “Goldman Sachs Wants to Become Google of Wall Street.” Available at: http://www.businessinsider.com/goldman-sachs-wants-to-become-the-google-of-wall-street-2017-4