
Introduction
In the twenty-first century as digitalization has increased, almost everything is online. Today we use various online platforms, sites, and when we use them, the data is generated, which is in the form of text, audio, video, images, graphics, etc. (Memon et al., 2017). In the COVID-19 situation we have seen or are very aware that everything depends or relies on the internet whether it is about studies, work for office employees, shopping, transaction of money, etc. We also use various social media sites so that we can connect to the outer world like WhatsApp, Facebook, Twitter, and Instagram and when we use them, we generate data in various forms such as photo, video, audio, text, etc. (Khan et al., 2014). Before 2002 there was minimal use of the internet and the data that was generated in a structured form and small in amount did not grow so rapidly (Mukherjee & Shaw, 2016). We could store and process them with the help of databases and MYSQL. But when we talk about current situation without the help of the internet nothing will be able to work. So, when we use the internet for various purposes the data generated is very large, complex, and complicated. For example let’s talk of how this data is different from the previous one. Flipkart is an e-commerce website that is very popular today and everyone knows about it. We can do our shopping by using this website. When we explore the site and set a filter for purchasing the desired thing which we want, at the same time millions or billions of users also use this website and a very large amount of data is generated by all of us, and the data is in the form of terabytes, petabytes, and zettabytes (Khan et al., 2014; Ularu et al., 2012). Since this data is very large as well as complex, we cannot store it in the database and the data is growing so rapidly (i.e., within a second or so) we cannot process and access it by using MYSQL. MYSQL and database principles function with structured data, which can be in the form of structured, semi-structured, or unstructured data. The data that is generated today is 90 percent unstructured, which is in any form like text, video, audio, images, etc. (Mukherjee & Shaw, 2016). For instance, when we select some product to purchase and it is in stock, but when we click the payment option then an error screen appears, and we are not able to buy the product: that is because at the same time many users are accessing it. So, we leave this website. We go to another shopping website like Amazon, and we find the same product here and we are able to purchase the same product.
From this example we can see how this large and complex data affects a company or business organization, For example, on Flipkart the data is not managed properly but in the case of Amazon it is better (Khan et al., 2014). Users are shifting from one website to another website, because they dislike the previous one. So, to prevent that we need to arrange, organize, and manage this large and complex data. Because of all these issues a new term is introduced: which is known as “big data,” which is the representation of this large and complicated data.
What is Data?
Data is defined as raw facts, statistics, or figures. It can be in many formats such as text documents, images, audio, or videos. Raw data that is the most basic format of data is processed to produce useful information. Data processing and analysis helps organizations increase their productivity and make business decisions.
Classification of Data
Data is classified into three categories (see Figure 15.1):
-
Structured
-
Semi-structured
-
Unstructured
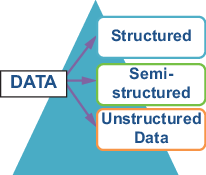
Figure 15.1: Classification of data.
-
Structured data: The data that has some predefined data model and can be analyzed. It is in tabular form in which there is a combination of different rows and columns like: SQL Database, Excel file. In these there is a structure of rows and columns on which the data can be stored. It is a model-based data where there is a model that tells how data can be stored, processed, and accessed. It is also known as traditional form of data as the Database Management System (DBMS) was used to store, process, and access the organized data.
-
Semi-structured data: As the name itself says, “semi-structured”; that is, the data is not completely in the structured form, only half of the data is in structured form. This data does not have any data model like relational database model as in the structured one. The data contain tags and markers so that they can separate the semantic elements.
-
Self-descriptive structure is another name for it. JSON (Java-Script Object Notation) and XML are two examples (Extensible Markup Language). When opposed to unstructured data, semi-structured data is easier to analyze.
-
Unstructured data: Unstructured data is data that lacks a predefined data model and is disorganized. Unstructured data is text-heavy, with dates, numbers, and details thrown in for good measure. As opposed to structured data such as audio, video, and NO-SQL databases, this makes it difficult to interpret this data using conventional systems. When it comes to storing and processing this form of data, new technologies such as Apache Graph for storing node relationships and MongoDB for storing documents have emerged.
Traditional Data
Other names for this type of data are small data or structured data. This type of data can be maintained by business organizations using Database Management System (DBMS). In this we use a centralized database for storing and maintaining data in a fixed format or in a file. For managing and accessing the data we use SQL, that is, Structured Query Language. It is generated at enterprise level. The size of data is in gigabytes or terabytes. The data size is very small. It contains only structured data. So, it is easy to integrate the data. We can manipulate data as well in this. The data is in manageable volume that means we can manage our data easily. It is stable as well. The data model is based on strict schema.
Big Data
This is a term that combines the words “big” and “data.” Big is a word that denotes a broad quantity (Mukherjee & Shaw, 2016). Data is any knowledge that comes in a variety of formats. So, when these two concepts are combined, we get the term “big data,” which refers to data in large quantities and in any form. It refers to data that is massive, fast, and complex, and that can’t be processed using conventional methods. It is the ability to analyze unstructured data, which makes up a huge portion of data in organizations. One of the most important factors driving the growth of big data is the ability to derive value from unstructured data. According to Gartner, big data is data in large quantities that is rapidly increasing, and the data comes from a variety of sources that require cost-effective, new data processing techniques to produce enhanced insight and decision-making (Memon et al., 2017) (see Figure 15.2).

Figure 15.2: Traditional and Big Data.
Characteristics of Big Data
Doug Laney, a market analyst, coined the term “big data” in the early 2000s with the idea of the “5 V’s” (Riahi & Riahi, 2018) (see Figure 15.3):
-
Volume: The large scale of information processed is referred to as volume. The data is larger than conventional data, necessitating more computing and storage capacity at each point of the lifecycle. As the workload grows beyond the capabilities, it becomes a challenge to pool, allocate, and coordinate resources from other Cluster management, and the algorithms can break the task down into smaller pieces.
-
Velocity: It refers to the rate at which data passes through the device. With the rise of the Internet of Things (IoT), data is moving at a breakneck pace and must be processed quickly. The amount of data flowing is enormous, and it is constant in nature.
-
Variety: The form of data is varied. Data is available in a variety of formats, including structured, semi-structured, and unstructured data, as well as text, audio, and video.
-
Variability: It is the volatile flow of data, which means it changes constantly and varies greatly. It’s complicated, but businesses need to know when something is trending on social media and how to handle the resulting spikes in data. Essentially, data inconsistency obstructs the process of efficiently handling and maintaining data.
-
Veracity: It has to do with the data’s accuracy. Since data comes from a variety of places, it’s difficult to link them, fit them, keep them clean, and convert them between systems. As a result, businesses must link and correlate relationships. Otherwise, the data could become uncontrollable.

Figure 15.3: Characteristics.
How Big Data came into Existence
There were methods of gathering and storing a large volume of data before acting on it. In 1970, the US Census Bureau began using punch cards to record population data. The invention of the “tabulating machine” processed punch card information much faster than humans could (Memon et al., 2017). We needed a better way to store and access vast amounts of data in the 1940s because there was an outbreak of information. IBM Research Labs published a paper on Relational Databases in 1970, which explains how to find data in large databases more efficiently (Ularu et al., 2012). It’s like Excel. The internet’s development in 1995 paved the way for Web 2.0. Initially, the internet was mostly used for information, and static websites were prominent, resulting in a disappointing user experience. (Riahi & Riahi, 2018) Since the introduction of Web 2.0 in 2004, users have been able to create, distribute, and store their own data in a virtual environment (Riahi & Riahi, 2018). In the mid-2000s, internet users overflowed social media sites such as Facebook and Twitter, resulting in the dissemination of even more data (Khan et al., 2014). Today, YouTube and Netflix have forever changed the way we watch and download video content. HADOOP, a popular open-source platform for storing data and running applications, was released in 2011. In 2014, the Internet of Things (IoT) would change big data. (Nandhini, 2018) As the world becomes more linked across the internet, businesses are turning to big data to minimize operating costs, increase productivity, and create new products and services.
Why is Big Data Important?
As we all can see, the development of apps is increasing day by day and everyone is shifting online, including social media, people, and businesses. So, there is a huge amount of data is increasing day by day (Khan et.al., 2014). Take, for example, social media sites, which draw over a million users on a regular basis, allowing them to scale data faster than ever before. So, how is this massive volume of data treated, analyzed, and stored? (Ularu et.al. 2012). This is where big data becomes useful.
From where does it come? Or Sources of Big Data
-
Black Box Data: Information provided by planes, such as jets and helicopters. It contains the voices of the flight crew, microphone recordings, and details about the aircraft’s performance (Al-Shiakhli 2019).
-
Social Media Data: Information gathered from sites like Twitter, Facebook, Instagram, Pinterest, and Google+.
-
Stock Exchange Data: This is information from stock exchanges regarding customer share selling and purchasing decisions.
-
Power Grid Data: This is information from power grids. It stores information about specific nodes, such as consumption statistics.
-
Transport Data: This includes a vehicle’s size, model, availability, and distance traveled
-
Search Engine Data: One of the most important sources of big data is search engine data. Search engines rely on large databases for their information.
Pros of Big Data
-
Better decision-making: It has aided the decision-making process in a more significant way. Companies are using big data analytics before making any decisions, rather than making them anonymously (Ularu et al., 2012). For a better decision-making process, a number of user-based considerations are taken into account, such as what the consumers want, the solution to their issues, analyzing their needs according to business patterns, and so on. The level of satisfaction and loyalty of a company’s customers can be used to gauge its performance. Nothing will stop them from expanding if they give their customers what they want.
-
Greater innovations: They are important for success of any organization. For innovation we need data in bulk. big data gives us the freedom to achieve what we want. Companies use big data to evaluate various consumer perspectives on their goods and how they are perceived. It tells them exactly what they’re missing and what the most important considerations are when creating a new product. This aids them in designing innovative products that meet the needs of their customers. Big data serves as a backbone to the Internet of Things (IoT). Take, as an analogy, self-driving vehicles, which are currently in progress and will become a reality in the not-too-distant future. As the name implies, this is a car that does not need a driver and is capable of driving us to our destination on its own. These vehicles are outfitted with several equipment, including sensors, cameras, cloud architecture, and so on. It recognizes a large amount of traffic data, road conditions such as speed brakers, sharp turns, and so on, and then processes the data and makes driving decisions.
-
Education sector: It is unbelievable how it handles data relevant to students at an educational institute. It is not currently in use, but it should be. Teachers find it difficult to handle the data because it is so big. Analysis can be used to quantify the skills of students based on data, allowing teachers to better build their students’ futures. Teachers become very conscious of their students’ strengths and weaknesses and can help them.
-
Product price optimization: Big data is used by businesses to refine the prices they charge their customers (Memon et al., 2017). Their main aim is to set the prices in such a way that their profit is maximized with the use of big data. They set their product’s price according to the customer’s willingness to pay under different installments or circumstances. They want the customer to get value for his money.
-
Recommendation engines: Consider the possibility of receiving recommendations based on our past and current choices made on different online platforms. Isn’t it much easier to live when we have the choice of choosing from things we enjoy? People’s attitudes toward different online outlets have shifted because of this. We’re all more at ease being involved on these channels now. Various online shopping sites are the best example of this. What exactly do they do? They examine each customer’s data and make recommendations based on it. These suggestions are based on the behaviors we engaged in the last time we visited the website, and they are also based on consumer comparisons. Who searched for or bought similar stuff? Online networks have broken down physical walls between us and them in this way. Flipkart is the most well-known example.
-
Lifesaving application in healthcare industry: Centered on the electronic health record of patients, it assists physicians in providing advanced and high-quality treatment to patients. It improves healthcare organizations’ operating performance and encourages them to make improvements. By identifying unknown associations and invisible patterns, it enables doctors to find a better cure for disease. It can also be used to find a cure for a disease like cancer (Memon et al., 2017; Mukherjee & Shaw, 2016).
Cons of Big Data
-
Data quality: Since most big data is semi-structured or unstructured, quality isn’t always consistent. For this reason, data analysts must ensure that the information gathered is reliable. Its format should be suitable. If these issues are effective, they will cause a problem (Nandhini, 2018; Acharjya & Ahmed, 2016).
-
Rapid change: As technology advances, it improves and becomes more advanced than previous iterations. As a result, many businesses are unable to meet the demands of developing these resources. It may often result in a business disaster (Khan et al., 2014).
-
Lack of professionals: Big data analysts are people who evaluate big data to find useful information for growing a company’s productivity. However, people with this expertise are not always accessible (Ularu et al., 2012). The number of people capable of working on big data analytics is decreasing. As a result, it is one of the major drawbacks.
-
Cyber security risks: There is a lack of security. Big data necessitates a lot of storage, and data that isn’t properly stored can be hacked. Data security is disrupted due to a lack of facilities (Acharjya & Ahmed, 2016).
-
Cost factor: Big data analytics is a costly procedure. Hardware, storage, and servicing, infrastructure, tool implementation, and recruiting talented workers are just a few of the extra costs. Working on big data research needs a significant investment of time and effort (Riahi & Riahi, 2018).
Applications of Big Data
Over the past few years, big data has acted as a major game changer in a variety of industries. Big data applications are designed to assist businesses in making more informed business decisions by analyzing vast amounts of data. It has a major impact on a variety of areas, as follows:
-
Finance: The financial organization is reliant on its data, and protecting it is one of the most difficult tasks facing any financial institution. After income, data is the second most important thing to them. Financial institutions were among the first to use big data and analytics. Financial companies use big data for fraud prevention, risk analysis, and other purposes. Instead of focusing on security issues, they are now focusing on delivering quality services to their customers. MasterCard, for example, uses a lot of big data. They have saved billions of dollars thanks to their big data fraud detection technique (Mukherjee & Shaw, 2016; Tarekegn & Munaye, 2016).
-
Telecom: It is at the heart of every digital transformation taking place anywhere on the planet. As the use of smart phones grows, the telecom industry is being overburdened with large amounts of data. Companies can provide strong access to customers by using big data and analytics, as well as eliminate all network obstacles that customers face. Companies can now monitor the areas with the lowest and highest network traffic and adjust network access accordingly. Big data has aided the telecom industry in gaining a better understanding of its customers (Mukherjee & Shaw, 2016; Tarekegn & Munaye, 2016).
-
Travel industry: For many people, getting a stress-free travel experience is a pipe dream. Travel companies can now have more personalized travel experiences thanks to big data and analytics. They now have a much better understanding of our specifications. From supplying them with the latest deals to being able to make real-time recommendations. For any traveler, big data serves as a reference.
-
Media and entertainment industry: It’s all about creativity and career opportunities. It’s like a work of art when it comes to big data. The aim of this industry is to keep customers happy. To do so, they must provide new content to their customers to keep them engaged with their company. The recommendation engine plays a significant role in this. Today, audiences expect content that is tailored to their preferences (Ularu et al., 2012), content that is different from what they’ve seen before. Companies used to distribute advertisements at random, without any research. However, they are now providing advertisements that draw customers and broadcasting them at times when they are most likely to be seen. Netflix, the world’s most popular internet streaming service, uses big data in its recommendation systems. Let’s say we’ve finished watching a Netflix series and then get recommendations for other shows of the same genre that we like. This occurs because of big data’s recommendation engine.
Big Data Analytics
What does this Imply?
This is a concept that combines the words “big data” and “analytics.” Big data is a concept used to describe a set of data that is massive, increasingly increasing, and complex in nature. The amount of data in this is enormous. Using mathematics, statistics, predictive modeling, and Machine Learning Techniques, analytics is used to derive relevant patterns in data and find hidden patterns, consumer preferences, and another useful knowledge (Al-Shiakhli, 2019). As these two words are combined, the result is big data analytics. It collects through a vast volume of data to uncover secret trends and other insights. With today’s technology, we can analyze our data and get answers or facts from it almost instantly. In other words, we can conclude that by applying advanced analytical techniques to very broad, complex big data sets that include structured, semi-structured, and unstructured data from a variety of sources and sizes ranging from Tera bytes to Zeta bytes, we can achieve this. We can make smarter and quicker decisions, model future outcomes, and forecast future outcomes with big data analytics. Companies implement it as they want to make more informed business decisions (Riahi & Riahi, 2018). It provides various advantages for better decision making, preventing fraudulent activities, among other things as well.
What is the Aim of Big Data Analytics?
It is important for all industries. Take Spotify as an example of a music streaming site. Our definition is clarified because of this illustration. Every day, the company’s millions of users produce a vast amount of data. The cloud-based platform uses this to create a recommended song list using a smart recommendation engine based on our likes, shares, and search history, among other factors. The outcome of big data analytics is this. If we use Spotify, we have the top recommendation section, which is based on our preferences, experience, and other factors. We use a recommendation engine that employs data filtering tools to gather data and then filter it when operating on an algorithm.
Types of Analytics
-
Descriptive analytics: It explains or summarizes current data using existing business tools to gain a clearer understanding of what is happening or has occurred (Riahi & Riahi, 2018).
-
Diagnostic analytics: It reflects on past results to figure out what went wrong and why.
-
Predictive analytics: It uses mathematical models and machine learning techniques to forecast potential outcomes.
-
Prescriptive analytics: It recommends one or more course of action to analyze the data.
Tools for Analyzing the Data
-
HADOOP—It allows in the storage and analysis of data.
-
MONGODB—This database is used for constantly changing datasets.
-
Talend—Talend is a data integration and management tool.
-
Spark—This program is used to process and analyze vast volumes of data in real time (Khan et al., 2014).
HADOOP: What exactly is HADOOP?
Apache Hadoop is a Java-based open-source software platform for data processing and storage in big data applications (Yaqoob et al., 2016). Hadoop works by distributing large data sets and analytics workloads across nodes in a computing cluster and breaking them down into smaller workloads that can run concurrently (Ularu et al., 2012). It can handle structured and unstructured data, and it can scale from a single server to thousands of machines.
What is Hadoop’s Evolution?
Hadoop grew from the need to process vast amounts of data. It is based on Google’s MapReduce programming model, which divides an application into small chunks or sections that can run on different nodes. When Doug Cutting and Mike Cafarella were working on the Apache Nutch Project in 2002, they came up with the idea for Hadoop. (Khan et al., 2014) Doug called Hadoop after a toy elephant his son had. Yahoo released Hadoop as an open-source project in 2008, after a few years of development. In November 2012, the Apache Software Foundation made Hadoop available to us.
What is the Significance of this for Big Data Analytics?
It allowed businesses to analyze and query large data sets in a scalable and cost-effective manner using free, open-source software (Riahi & Riahi, 2018). It’s a replacement for data warehouse solutions and closed data formats, which dominated in previous years. As a result, HADOOP paved the way for potential big data analytics advancements.
Core HADOOP Modules
-
(HDFS): HDFS refers to Hadoop Distributed File System. Huge datasets can be shared across nodes in a cluster using HDFS (Ularu et al., 2012).
-
YARN: YARN refers for Yet Another Resource Negotiator. It’s used to control cluster resources, organize activities, and schedule work (Riahi & Riahi, 2018).
-
MapReduce: This is a programming model and large data processing engine that is used to process data sets in parallel. In HADOOP, it was the only execution engine available (Ularu et al., 2012).
-
Hadoop common: This module offers a collection of resources to help the other modules work together (Memon et al., 2017).
Benefits of using HADOOP
-
Scalability: Traditional systems have a data limit at the end. Hadoop is scalable because it operates in a distributed environment. This allows data creators to make their own data pools. First data lakes are a form of centralized data repository that can store both structured and unstructured data. It is a low-cost object storage system with an open format that allows a wide range of applications to access data.
-
Resilience: HDFS is a resilient file system. To compensate for the possibility of hardware or software failures, data stored on any node of a Hadoop cluster is duplicated on other nodes of the cluster. This satisfies the fault tolerance requirement. There is always a backup of data available in the cluster if one node fails (Riahi & Riahi, 2018).
-
Flexibility: Hadoop allows us to store data in a variety of formats, including semi-structured and unstructured data. It enables companies to gain access to new data sources (Ularu et al., 2012).
Challenges in HADOOP
-
Complexity: HADOOP is a low-level, JAVA-based technology that can be tough to work with for users. HADOOP architectures necessitate physical activity and facilities to set up, manage, and improve.
-
Performance: Hadoop performs computations by performing repeated reads and writes to disc, which is time consuming and inefficient as compared to frameworks that want to store and process data in memory as often as possible.
Conclusion
We began by studying about data, its types that are structured, semi-structured, and unstructured. Then we looked at traditional data. To overcome the drawback of this traditional data, big data comes into play. Big data is characterized as a large collection of complex data that is structured, semi-structured, or unstructured and is rapidly increasing. We explored how it came into existence and its importance, also its concept of 5v’s (i.e., volume, velocity, variety, variability, and veracity); its advantages and disadvantages, and about its applications in various places such as in entertainment, healthcare, education sector, etc. We also discussed the term big data analytics, which is used to capture, process, clean, and analyze massive datasets to help businesses operationalize their big data. We learned about the significance and value of analytics, as well as the different forms of analytics such as Descriptive, Diagnostic, Predictive, and Prescriptive. Various data analysis tools, such as Hadoop and Spark, are available. We looked at the Hadoop tool which is used for storing and processing large data sets in any format. We’ve seen what it does, how it has evolved, how important it is, what benefits it has, and what problems it has.
References
Acharjya, D. P., & Kauser, A. P. (2016). A Survey on Big Data Analytics: Challenges, Open Research Issues and Tools. International Journal of Advanced Computer Science and Applications (IJACSA), 7(2). a, b
Al-Shiakhli, S. (2019). Big Data Analytics: A Literature Review Perspective (Dissertation). Retrieved from http://urn.kb.se/resolve?urn=urn:nbn:se:ltu:diva-74173. a, b
Khan, N., Yaqoob, I., Hashem, I. A., Inayat, Z., Ali, W. K., Alam, M., Shiraz, M., & Gani A. (2014). Big Data: Survey, Technologies, Opportunities, and Challenges. Scientific World Journal. doi: 10.1155/2014/712826. a, b, c, d, e, f, g, h
Memon, M. A., Soomro, S., Jumani, A. K., & Kartio, M. A. (2017). Big Data Analytics and Its Applications. Annals of Emerging Technologies in Computing (Aetic), 1(1): 45–54. a, b, c, d, e, f
Mukherjee, S., & Shaw, R. (2016). Big Data-Concepts, Applications, Challenges and Future Scope. International Journal of Advanced Research in Computer and Communication Engineering, 5(2): 66–74. a, b, c, d, e, f
Nandhini, P. (2018). A Research on Big Data Analytics Security and Privacy in Cloud, Data Mining, Hadoop and Mapreduce. Shreyas Satardekar International Journal of Engineering Research and Application, 8(4): 65–78. a, b
Riahi, Y., & Riahi, S. (2018). Big Data and Big Data Analytics: Concepts, Types and Technologies. International Journal of Research and Engineering, 5(9): 524–528. a, b, c, d, e, f, g, h, i
Tarekegn, G. B., & Munaye, Y. Y. (2016). Big Data: Security Issues, Challenges and Future Scope. International Journal of Computer Engineering & Technology (IJCET), 7(4): 12–24, Article ID: IJCET_07_04_002. a, b
Ularu, E., Puican, F., Apostu, A., & Velicanu, M. (2012). Perspectives on Big Data and Big Data Analytics. Database Systems Journal, 3(4): 3–14. a, b, c, d, e, f, g, h, i, j
Yaqoob, I., Hashem, I. A. T., Gani, A., Mokhtar, S., Ahmed, E., Anuar, N. B., & Vasilakos, V. (2016). Big Data: From Beginning to Future. International Journal of Information Management, 36(6): 1231–1247. →