Software application development should always begin with a clear problem statement that describes a problem to be solved, including its requirements, scope, limitations, exceptions, and expected outcomes. You analyze this problem statement to come up with a design representation. The design representation of an application is like the blueprint that is created before the construction of a home or the engineering design created before a product is machined.
Software application developers are often eager to jump into coding before they design, but this is not good practice. The best practice is to analyze and design the solution to a problem in a standard format so that all the parameters can be discussed with the stakeholders in an implementation-independent fashion, using visual representations of the design components. Unified Modeling Language (UML) (https://www.uml.org) offers multiple diagram models for design representation.
The UML design methodology was introduced about three decades ago to address the development challenges that arose as the scale and complexity of software increased, with small-scale systems being replaced by large, multimodule systems. UML modeling has been widely adopted by many organizations, and UML diagrams have become a standard for visual models for designing software. The UML models and documentation are maintained by the not-for-profit Object Management Group (OMG). The latest version, UML 2.0, has 13 types of diagrams categorized in 3 groups: structural, behavioral, and interaction diagrams. There is a good chance that you are currently using one or more of these diagrams in your environment. This appendix reviews a selected set of UML diagrams that are used in the design of decentralized blockchain applications in this book. Many UML tools, free and paid, are available for drawing UML diagrams. One of the freeware options, draw.io (https://app.diagrams.net/), was used to develop the designs for the applications in this book.
A.1 Problem analysis and design
Would you ever launch into building a house without a blueprint? No way! Not only do you need a plan, but you also need a plan in a standard format that can be reviewed, understood, and approved by the authorizing agency. Similarly, UML diagrams are a set of diagrams that help you visually represent the design of your solution to a problem so that stakeholders can understand, discuss, and approve it before you start developing and coding the solution.
Let’s take a look at the behavioral, structural, and interaction diagrams that are put to use in this book for designing decentralized applications.
A.2 Behavioral diagrams
In this book, we employ two UML behavioral diagrams: use case diagrams for requirement gathering as one of the first steps in the design process, and finite state machine (FSM) diagrams later in the design process for defining state transitions of the executable code (smart contracts) on the blockchain.
A.2.1 Use case diagrams
Use case models help you analyze a problem statement, identify the actors or users of the system defined by the problem, and determine how these actors will use the system. The actors need not be only humans; they can be humans, applications, and devices, for example. The actors are anything or anyone that provides the stimulus for activation of one of the use cases identified by the problem statement. The use case diagram, therefore, defines three items, as shown in figure A.1:

Figure A.1 Actor, use case, and stimulus
An actor is someone or something that interacts with the system you are designing. A use case provides some value to the actor. Let’s analyze a problem and design the use case diagram for it to clarify this process.
Problem statement Design a vending machine: a customer inserts coins and chooses a drink that is delivered. For simplicity, consider only the case with no exceptions and with the exact amount of coins required deposited.
The use case diagram for the vending machine coin counter and drink dispenser is shown in figure A.2. It has four use cases at the first level--insert coins, see drinks, select drink, and pick up drink--which are direct stimuli or operations invoked by the customer. The insert coins operation in turn invokes the count coins use case, see drinks requires display drinks, and select drink results in deliver drink. These secondary use cases are not directly invoked or used by the customer. An important note is that a use case diagram is not like a traditional flow chart. It simply lists the operations in the elliptical use case symbols. The operational flow is not defined here.

Figure A.2 Use case diagram for vending machine
Try using draw.io, Microsoft Visio, or another tool of your choice to create the use case diagram and get some practice.
A.2.2 Finite state machine diagrams
FSM diagrams define the states that define the operational flow on execution of code and the transitions among them, a classic type of diagram from the theoretical foundations of mathematics and computer science. In the context of blockchain, an FSM diagram is used to define the states and state transitions when a smart contract executes; it’s a convenient tool for expressing the behavior of a smart contract.
DEFINITION A finite state machine is made up of a set of states (an initial state and one or more terminal states), transitions from one state to another, and the events that bring about those transitions.
Let’s explore the elements of the FSMm using an example problem and its finite state machine representation. We’ll use the count coins use case from the vending machine use case diagram in section A.2.1 and design its logic in the form of an FSM. For simplicity, let’s assume that the vending machine counts up to 25 cents and takes 5- and 10-cent coins as the only inputs. The FSM for counting to 25 cents is shown in figure A.3.

Figure A.3 FSM for counting exact change (25 cents)
The starting state is S0, and the ending state of the FSM design diagram is S25. That is, beginning at the value 0, using 5C and 10C coins, you would like to reach the S25 state. The states possible are S5, S10, S15, and S20. You can see the transitions brought about by the customer inserting 5C and 10C coins, ending up with S25. The FSM in figure A.3 exhaustively enumerates all the logical possibilities. Assume that the customer is aware of the requirement to insert exact change.
You can draw this diagram with any tool of your choice. The version here was created with the widgets provided by the draw.io tool; draw.io does not explicitly provide an FSM diagram, but you can use the circles and arrows from the general template.
A.3 Structural diagrams
This category of UML diagrams helps you define the static structural design of your solution. We will study only one of them: the class diagram. You will learn to represent multiple classes and their relationships, using standard notations. Class diagrams are useful for defining the overall structure of a module or a smart contract solution.
A.3.1 Class diagrams
The class diagram was introduced to represent a class in an object-oriented design of a solution, but it can be used to represent any class of object in a problem. You discover classes in your problem statement by underlining the nouns in the statement and making a list of these nouns. Then you examine the complexity of the nouns to decide whether a noun or object is complex enough to be a class or should be a structure within a class or a simple scalar variable.
A class diagram has three compartments, as shown in the template in figure A.4: the name of the class, the data area with a field and type for each data item, and the functions area. This template is from the draw.io tool, but you can create a class diagram using any UML tool or drawing package you are familiar with.

Figure A.4 Class diagram template
Let’s define a simple class diagram, using the automobile as an example.
Problem statement Design a class diagram representing a generic automobile.
Choose a simple name, Auto, for the class and then design the other parts of the class diagram. A rule of thumb for discovering data items is to ask and answer these questions: “What are the characteristics of this class of object? What data defines an automobile?” Imagine yourself in an auto dealership, and try to enumerate all the characteristics you desire in the automobile you want to buy. There can be many, but for this example, choose color, miles per gallon, and year of manufacture. You can see these characteristics in the first compartment of figure A.5.

Figure A.5 Class diagram for an automobile
Next, add the functions. The question to ask this time is “What are the behaviors of this class of objects?” Once again, you can imagine many answers to this question, and they may vary depending on whether you are a simple user of the automobile or a mechanic who repairs it, who may know about fuel injection and other inner details. The simple functions of the automobile are enumerated in the second compartment in figure A.5; again, these are a few representative examples.
The data fields of the class can be obtained by answering this question: What are the properties of the objects of this class? The functions can be obtained by answering this question: What can the objects of this class do?
Next, we’ll look at associating many types of objects in relationships.
A.3.2 Classes and relationships
A problem design can be defined by different types of classes in relationships such as
Other relationships are possible, but these will be useful in the context of smart contracts and blockchain-based decentralized applications.
Inheritance
Generalization and specialization of classes, known as inheritance hierarchy, is used for representing a hierarchical structure of classes, as shown in figure A.6. Continuing with the automobile example, we can specialize the basic design by using various characteristics and behaviors. In this case, you can see the specialization of the Auto class into Sedan, Truck, and Van classes. Here, only one item has been added to the data field of each class (parameters for the number of doors, presence of a cargo bed, and number of passengers), but you may be able to think of other features that specialize these classes. The relationships are clearly indicated. These classes extend the basic Auto design, as shown by the Extends arrows in the diagram. (An unfilled triangle shape is used for the arrowhead in this kind of relationship.) Sedan, Truck, and Van are said to have the same characteristics as the base class Auto and to inherit them from the Auto class, but they also have special features that qualify them to have their own class definitions.

Figure A.6 Auto hierarchy class diagram
Composition
Composition or aggregation relationships are used when a class is composed of one or more other classes of objects. Using the same example, an Auto is composed of many other classes of objects or aggregations of objects, as shown in figure A.7. (The solid diamond shape at the head of the arrow indicates this type of relationship). These classes include FuelInjection, CruiseControl, and AntiLockBrakes. Note that I haven’t filled in any fields or functions in the class definitions because I’m not an expert in this domain. If your team doesn’t contain a domain expert, it will need to collaborate with one to fill in these kinds of details.

Figure A.7 Automobile composition class diagram
Association
An association relationship among classes is used when a class needs to use the functions of another class. Consider the example of a Teacher class and a GradingSheet class, as shown in figure A.8. The association between these two classes is that a Teacher uses a GradingSheet. This relationship is not inheritance because a GradingSheet is not a type of Teacher, and obviously, a Teacher cannot be composed of GradingSheets. So the relation is association. In this case the association is uses, as indicated in the diagram in figure A.8. Also observe the one-to-many designation (1..n) on the arrow connecting the two classes, indicating that a Teacher may have many GradingSheets.

Figure A.8 Teacher-GradingSheet association diagram
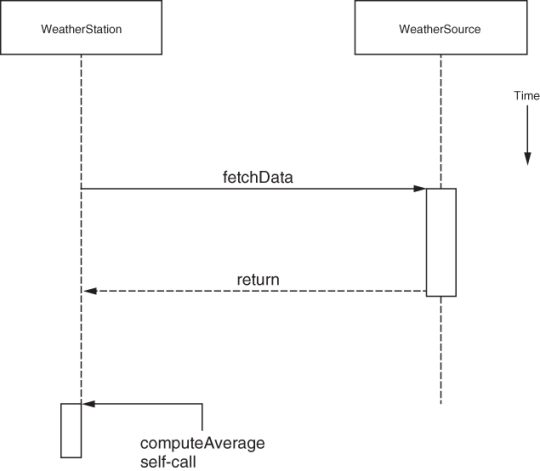
A.4 Interaction diagrams
In this category, you will learn about the sequence diagram as a means for designing and analyzing interactions among various software components of a blockchain application. The sequence diagram adds temporal elements to the design, which means that it lets you specify the time and the order in which functions are invoked. The vertical line in the diagram indicates timeline/progress. In figure A.9, you see the interaction between a weather station and a data source in the field to compute the average temperature. The two classes shown are WeatherStation and WeatherSource. The sequence diagram shows the interaction and the timeline. This type of diagram is useful for explaining the sequence of operations with reference to time when a smart contract is used.