Chapter Four
How to Select a Common Stock Mutual Fund
Let's Look at the Record
Time and again during the presidential election campaign of 1928, Alfred E. Smith, the Democratic candidate, said, “Let's look at the record.” The phrase became part of our political language. In the mutual fund field, too, investors say “Let's look at the record.” It is an important, if potentially fallible, step in the fund selection process. In this chapter, I shall first examine the major types of common stock funds and the ways to distinguish them. Next I will turn to the structural investment characteristics of stock funds. I will conclude by looking at the record and discussing the role of past fund returns in the selection process.
This chapter considers common stocks as a distinct asset class. There is no presumption that you have yet decided what portion of your total investment portfolio should be represented by common stock mutual funds. The allocation of dollars among the three primary classes of financial assets is an entirely different decision with its own unique considerations, and I will address it in Chapters 12 and 13.
Deciding which particular common stock funds to invest in is a challenge. Today there are some 1,400 common stock mutual funds. They tend to adhere to investment policies and objectives generally in line with broad strategic definitions. I divide common stock funds into five basic classifications, and indicate the number of funds in each category.
- Growth funds (361) seek long-term capital appreciation, with dividend income more or less incidental.
- Value funds (290) seek a combination of growth and income, often focusing on stocks with above-average yields and below-average price-earnings ratios.
- Equity income funds (74) seek to provide a major portion of total return through income and invest in stocks with yields that are generally well above average.
- Broad-based specialty funds (524) focus on the major market subsectors, such as aggressive growth stocks (135), small company stocks (152), and international or global stocks (237).
- Concentrated specialty funds (183) invest in the stocks of a single industry, such as health care, public utilities, or gold mines.
It is no mean task to decide in which of these five stock groups to invest, to say nothing of the myriad choices within each group. Further, even investors with a long-run focus often invest with more concern for a fund's record of past performance than the appropriateness of its investment objective. While you should always read the prospectus to determine a fund's investment objective, too many stock funds set forth their objectives so broadly that it is almost impossible to discern anything specific. For example, “we will do our best to earn you the highest possible return” is an objective as meritorious as it is meaningless.
In general, you have two basic strategies from which to choose in seeking the holy grail of superior long-term performance. The first is to select a mainstream stock fund in either the growth or the value category and hope for marginal superiority, with some level of consistency, over stocks in the aggregate. This plan, implicitly adopted by most fund shareholders, provides the broadest level of diversification. The second strategy is to select a differentiated fund in either the growth or value category, or a specialty fund whose returns and risks will vary significantly from the market as a whole. In either case, you should be aware of the extra risk assumed in accepting a lower (sometimes much lower) level of diversification. Put another way, the potential rewards of owning a mutual fund that might rank among the top 10% of all funds during a given interval are usually accompanied by the risks of owning a fund that might rank in the bottom 10%. Or, as it has been said, “many that are first shall be last, and the last shall be first.”
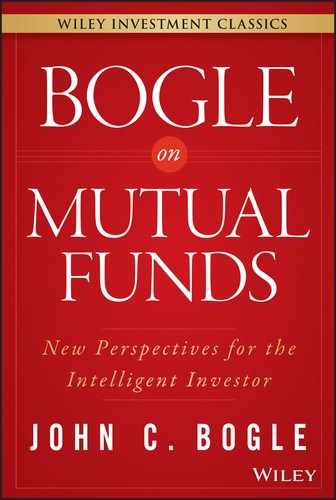
The primary mainstream funds, as I noted, include growth funds and value funds. In practice, there is a soft distinction between these two stock fund classes. While their short-term returns have varied from one period to another, their long-term returns have been fairly similar, as Table 4.1 shows. Admittedly, looking at five-year aggregates blurs much of the distinction between the returns of these two stock fund categories. But on a year-by-year basis over an extended period, a slow cyclical pattern emerges in which first one type of fund leads the market, then the other. The upper part of Figure 4.1 shows the cumulative returns of both types of funds over the past 20 years; the lower shows the relative returns achieved by each fund type over the period. When the line is rising, growth funds are leading. When the line is falling, value funds are leading.
Table 4.1 Growth Funds versus Value Funds (20 Years Ended December 31, 1992)
| Average Annual Rate of Return | ||
| Growth | Value | |
| 5-year periods (inclusive) | funds | funds |
| 1973–77 | − 2.9% | + 1.7% |
| 1978–82 | +19.1 | +15.9 |
| 1983–87 | +11.0 | +13.5 |
| 1988–92 | +14.7 | +13.6 |
| Total period 1973–92 | +10.1% | +11.0% |
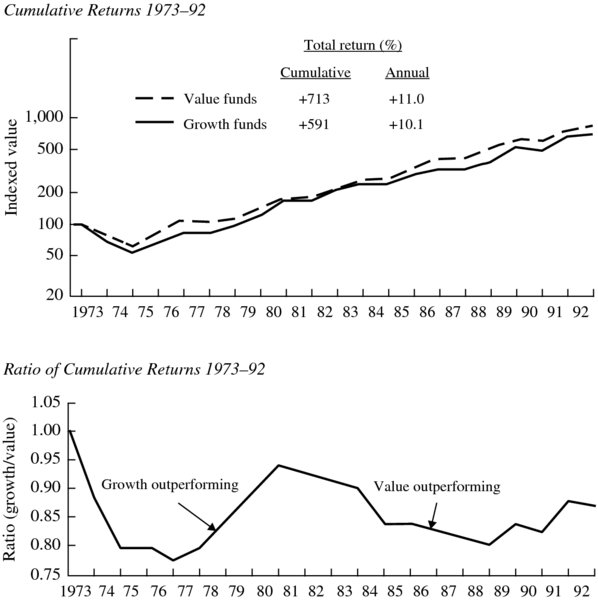
Figure 4.1 Growth Funds versus Value Funds
Note that value funds had their day from the end of 1972 to the end of 1976, received their comeuppance from 1977 to 1980, only to resume dominance through the end of 1988. The message of the chart, it seems to me, is that there are few profits—and lots of problems—in trying to predict the relative performance of these two investment styles.
Table 4.2 Rank of Equity Holdings (December 31, 1992)
| Growth funds | Value funds | |
| Philip Morris | 1 | 1 |
| FNMA | 2 | 5 |
| Merck | 3 | 4 |
| PepsiCo | 8 | 16 |
| Pfizer | 11 | 19 |
| American International Group | 13 | 13 |
| Royal Dutch | 16 | 6 |
| General Electric | 18 | 2 |
| Bristol-Myers Squibb | 20 | 12 |
| IBM | 21 | 7 |
Some further difficulty in distinguishing between these two basic types of funds is manifested in their portfolio holdings. Table 4.2 compares ten equity holdings (ranked in terms of percentage of assets) that comprise a substantial portion of the portfolios of both value funds and growth funds. The portfolio parallelism begins with Philip Morris, the largest holding in each fund group, but it hardly ends there. The overlap between the two columns confirms that the real-world similarities between the typical growth fund and the typical value fund are far greater than the differences. This process of mongrelization seems to have developed over the past decade. It means that the accepted broad definitions of equity fund categories are considerably less useful than each individual fund's specific investment characteristics.
Equity income funds represent a third type of mainstream offering. They can be considered close sisters to value funds, with a tilt toward current income. Such funds entail a more conservative approach to equity fund investing, but their returns are heavily influenced by the general level of interest rates. The broad-based specialty funds, on the other hand, represent a more zealous investment approach that entails higher price volatility than the mainstream funds. For instance, aggressive growth funds seek maximum capital appreciation as a primary objective. They frequently pursue this objective through the fairly active buying and selling of securities, resulting in high levels of portfolio turnover. The small company funds, on the other hand, focus their investments in stocks with relatively small market capitalizations and often emphasize more speculative emerging companies.
Small company stocks have, over the long term, outperformed their larger capitalization cousins, which dominate the typical growth and value fund portfolios. However, there have been protracted periods when large company stocks performed better. The upper chart in Figure 4.2 shows the cumulative performance of small stocks (Russell 2000 Index) and large stocks (S&P 500 Index) over the 20-year period ended December 31, 1992. The lower chart shows the relationship between the returns of the two stock groups. When the line is rising, small company stocks are outperforming large company stocks; when the line is declining, the reverse is true. While small cap stocks provided higher returns over the full period, their dominance was achieved prior to 1984. Since then, large cap stocks have been by far the better performers.

Figure 4.2 Small Cap versus Large Cap Stocks (20 Years Ended December 31, 1992)
Each equity fund type has particular investment characteristics. In evaluating each, be aware of two important distinctions. First, while the total returns of each stock fund type are often comparable over extended periods, the equity income and value funds have tended to carry lower risk (less price volatility) than have the growth, aggressive growth, and small company funds. Second, there is a difference in the character of returns among these fund types. Specifically, dividend income comprises a higher proportion of total return for equity income and value funds than for the other three fund types. Dividend income tends to be stable and durable over time. Capital growth is more volatile and spasmodic. This is an important distinction as you select a stock fund.
Table 4.3 gives some idea of the marked difference in the composition of total returns among the primary equity fund types, using the past 15 years as an example. The table shows that, while the long-term total returns of these five stock fund types were remarkably similar over the 15-year period, the composition of those returns was strikingly disparate. Clearly, if you are in the accumulation phase of your life cycle—unconcerned with generating current income from your investments and interested in minimizing taxable income—you may well prefer a growth fund over an equity income fund. Conversely, if you are in the distribution phase of your life cycle, you may prefer an equity income fund or a value fund. By evaluating the composition of total returns, you can select the most appropriate type of stock fund and then proceed to make specific fund comparisons within that group of funds. Evaluating past returns in this manner provides a logical framework in which to make rational investment decisions.
Table 4.3 Components of Total Return (15 Years Ended December 31, 1992)
| Income as | ||||
| Income | Capital | Total | percent of | |
| Fund type | return | return* | return | total return |
| Equity income | +6.2% | + 7.8% | +14.0% | 44% |
| Value | +4.3 | + 9.4 | +13.7 | 31 |
| Growth | +2.7 | +12.9 | +15.6 | 17 |
| Small company | +1.8 | +14.3 | +16.1 | 11 |
| Aggressive growth | +1.2 | +12.7 | +13.9 | 9 |
*Includes increases in net asset value plus reinvested capital gains distributions.
There is another type of common stock mutual fund, the international fund. This term has come to describe funds investing entirely outside the U.S. Thus far, I have virtually ignored international funds mainly because they entail unique risks that are not relevant to the investor in domestic common stock funds. The rationale for investing in international funds is that they should provide an ancillary level of diversification to your portfolio. Since the prices of foreign stocks often move in different directions, at different times, and in different dimensions than the prices of U.S. stocks, their inclusion in a diversified portfolio tends to reduce its short-term price volatility.
Compelling arguments have been promulgated to support the notion that investing in foreign stocks will improve your cumulative total return while reducing the volatility of your annual return. However, I am skeptical that international funds will add substantial value for the long-term investor. In my view, there is no inherent reason to believe that the major bourses outside of the United States will provide either higher or lower returns than the U.S. stock market. The so-called emerging markets such as Malaysia, Thailand, Mexico, and the like may offer the opportunity for relatively higher growth, but only at considerably higher risk. When the total returns in foreign markets are converted from local currency to U.S. dollars (which is ultimately the only currency that matters to the U.S. investor), returns become much more variable, reflecting the wide fluctuations in the value of the U.S. dollar versus foreign currencies. This currency risk means that a weakening U.S. dollar will enhance the returns earned by U.S. investors in international markets and a strong dollar will reduce their returns.
In Figure 4.3, the upper graph compares the returns achieved in the U.S. stock market since 1973 with those achieved in foreign markets in the aggregate, measured in both local currency terms and U.S. dollar terms. The lower graph reflects the relationship between foreign market returns (measured in local currency terms) and U.S. market returns. The benchmark for the foreign markets is the unmanaged Morgan Stanley Capital International Europe, Australia, and Far East Index (referred to as EAFE).
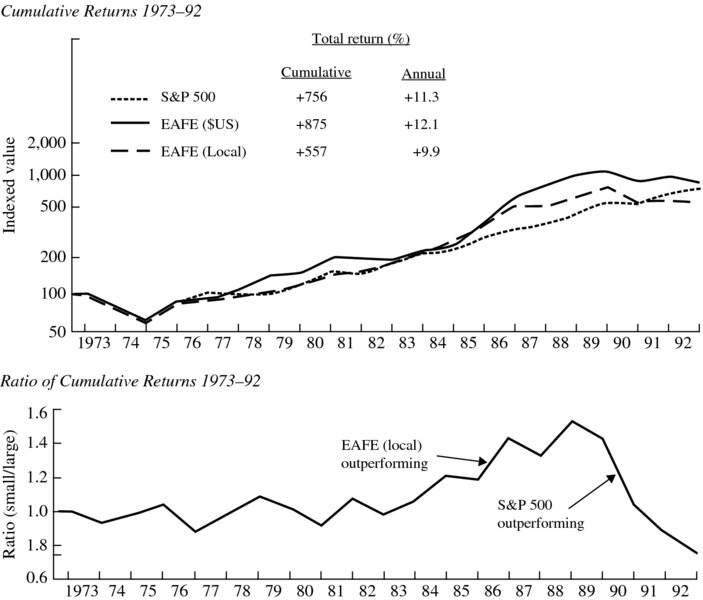
Figure 4.3 U.S. versus Foreign Markets
The upper chart shows that, measured in local currency, the U.S. market was a much better performer than the foreign markets in the aggregate, achieving an average annual return of +11.3% versus +9.9% for foreign stocks. However, the general weakness of the U.S. dollar increased foreign stock returns for the U.S. investor to +12.1% annually. In the lower chart, you can see that the foreign markets were relatively strong performers during most of the period from 1983 to 1988 but have lagged the U.S. market by a significant margin since then.
The fact that currency fluctuations have had a positive impact on the returns earned by U.S. investors in foreign markets over the full period does not mean that you should ignore currency risk. For example, from 1979 to 1984, foreign markets enjoyed a gain of +166% measured in local currencies, but a gain of just +75% in U.S. dollar terms. In my view, despite the currency reward illustrated in the upper chart in Figure 4.3, the best assumption you can make is that currency fluctuations will have a limited impact, either positive or negative, on the long-term returns earned by your foreign investments. If that is the case, you should evaluate your international fund holdings just as you would your U.S. fund holdings, in terms of their fundamental value.
It has become popular in financial circles to speak of investors owning the “entire world market.” The implied added diversification would justify a commitment of 57% of equities to non-U.S. stocks, since they comprised 57% of the world's total market capitalization at the end of 1992. The remaining 43% would comprise U.S. stocks. I do not believe such a posture makes sense. Given the incremental currency risk, not to mention the addition of sovereign risk (the risk that a nation will default on its financial obligations and the risk of political instability or even war), your exposure to mutual funds investing in foreign stocks should not exceed 20% of your equity portfolio.
Finally, a word about concentrated specialty funds. Some may have a role as part of your mutual fund portfolio. Others will not. In my view, among the more useful types may be gold and energy funds (seeking to provide a hedge against inflation), utility funds (seeking to provide a higher level of income than equity income funds), and technology and health care funds (enabling the investor to own segments of the U.S. economy that may provide above-average long-term capital growth). It is difficult to generalize as to the proportion of your equity portfolio you should allot to these concentrated funds. It might be as much as 25% in the case of utility funds (if you require more income) or 10% in health care or technology funds (if you are willing to incur the additional risk).
As noted earlier, selecting an equity mutual fund revolves around two essential questions: (1) Which mainstream fund(s) should represent the core portion of your investment portfolio? and (2) Which differentiated fund(s), if any, should represent the marginal portion of your investment portfolio? To address these questions, I shall first discuss mutual fund structural characteristics and then provide some standards for evaluating past mutual fund performance.
STRUCTURAL CHARACTERISTICS
Too many investors select a common stock fund based solely on its past performance record. The record provided by the fund sponsor is usually a chronicle of championship results for one or more of its funds, carefully selected and accompanied by braggadocio about being the top-performing fund for some particular period. Reports by the financial press typically lionize the portfolio managers who had the “best” records (i.e., achieved the largest gains) during the previous quarter or year or even longer. This myopic focus on past performance is not helpful. It is a flawed and counterproductive way to select a mutual fund.
There is, however, a place for the evaluation of past performance in the fund selection process. But it should come only after a review of the fund's principal structural characteristics. Before turning to the romance of performance evaluation, I shall examine some key structural characteristics of common stock funds. While these points are broad generalizations with many exceptions, they are still worthy of consideration.
Size of Fund
As a general rule, you should probably avoid funds with assets of less than $50 million simply because of the relatively higher expenses associated with small funds, along with the possibility that a small fund may not survive or may undergo a change in objectives in the search for greater acceptance in the marketplace. However, you might make an exception for a small fund that is part of a larger complex—say, $500 million or more in aggregate assets—or is managed by a large advisory firm. In both cases, the management should have the resources to manage the fund's affairs with reasonable efficiency.
On the other hand, if you are seeking an exceptional return—and are prepared to assume exceptional risk—you may wish to exclude funds with more than $1 billion of assets. This is not to say returns on larger funds will fall short of returns on smaller funds in the aggregate, for there is no evidence of this. Rather, it suggests that regression to the mean—a strong tendency for the gap between a fund with exceptional past returns and its peers to narrow—is a fact of life. Whether through asset growth or other factors, over time a fund's return tends to move toward the average.
Age of Fund
In most cases, a fund should prove its merit over a period of at least five to ten years. There are notable exceptions. A new fund introduced by an established investment management firm and modeled on its traditional investment philosophy should be considered. Another exception may be a new fund with specific investment objectives and characteristics that is part of a large complex. For example, if a fund complex offers a new balanced fund—and has provided good returns on its stock and bond funds over time—there would seem to be little hazard. Also, the inauguration of an index fund (and we shall see many of these in the coming years) poses few potential problems. But to invest in any fund without considering its heritage seems foolish.
Tenure of Portfolio Manager
Find out whether a portfolio manager has run the fund for a few months, a few years, or a few decades, and give this information whatever weight you deem appropriate. That said, many fine equity funds are run by teams of managers, with the advisory firm as an organization putting its corporate stamp on the funds' strategies and their implementation. Because of this diversity, such funds tend to be classic mainstream funds, and the tenure of a single manager should be relatively inconsequential.
Even when funds have individual portfolio managers, performance in a particular period can be due to much more—or less—than the manager's skill. For instance, a manager may be less important than the research and analytical support he receives. Or a manager may grow, or shrink, in capability. It is not unknown for a new manager to do better than a successful predecessor. A market environment in which a manager has been able to shine brightly may be replaced by a very different environment that does not favor the manager's investment style. Finally, good luck (always a factor in shaping fund returns) may turn to bad, and vice versa. Tenure is but one factor for you to consider. When managers change, a wait-and-see policy is usually appropriate.
Cost of Ownership
Chapter 10 is devoted to the extraordinary impact of costs on a fund's return. While cost may be less important in a stock fund than in a bond fund, balanced fund, or money market fund, you should always take into account front-end sales charges, redemption charges, and expense ratios. These costs are too often overlooked by investors. The cost factor may have seemed insignificant during the golden decade of the 1980s, when the stock market provided an average annual return of +17.6%. But if the market return in the 1990s is in the +10% range, costs will consume a much larger percentage of your return. It is worth emphasizing that, since market indexes exist only on paper, they are completely free of costs and so overstate the returns actually earned by real-world investors.
Portfolio Characteristics
Among the most important of the many factors that you should understand in a basic evaluation of an equity mutual fund are cash position, portfolio concentration, market capitalization, and portfolio turnover.
Cash position.
What percentage of the portfolio is held in cash reserves? Has the percentage varied? Has the cash position been effective in adding stability during market declines while not unduly retarding growth during market rises? Since there is no evidence stock managers have had any success in raising cash at market tops, nor in investing cash at market bottoms, with rare exceptions cash reserves should play only a limited role in an equity fund (say, 5% of the portfolio's total net assets). It does not seem sensible to pay high advisory fees for the privilege of owning the residual cash reserves held by most stock funds. Years ago, cash was supposedly held as a liquidity reserve to meet a possible run of redemptions on fund shares. Today the futures markets readily and inexpensively permit funds to remain effectively fully exposed to the stock market, while maintaining cash reserves for possible redemptions.
Portfolio concentration.
It is not enough to know how many stocks a fund owns, because many of them may represent a small percentage of net assets and have little impact on the fund's overall performance. The better test is the proportion of total assets the fund holds in its largest positions. One good measure is to check the fund's ten largest holdings. In the more concentrated funds, the ten largest holdings may comprise up to 50% of the portfolio; in the less concentrated funds, they may comprise as little as 15%. As a general rule, the greater the portfolio concentration, the greater the opportunity for the fund to provide differentiated performance. (The differentiation may be positive or negative.) It is also worthwhile to note the industry concentrations in a fund's portfolio as a further measure of its level of diversification.
Market capitalization.
A fund's market capitalization will indicate whether the fund emphasizes the stocks of blue-chip companies with large market capitalizations, emerging companies with small capitalizations, or something in between. You should know the difference. The average weighted market capitalization of the common stocks owned by equity funds may range from more than $15 billion to less than $500 million. An average market capitalization in the range of $5 billion to $8 billion is typical for a mainstream stock fund. There is no right or wrong average market capitalization. It is simply a good measure of a fund's investment emphasis and, to some degree, the risks that it assumes. Over the long term, surprises, while they occur in all types of stocks, are less likely among the large blue-chip issues. (However, surprises among the blue chips have been rife in the early 1990s.)
Portfolio turnover.
Turnover—the purchase and sale of securities in a fund's portfolio—is too often ignored by investors. But it is an important indicator of a fund's fundamental investment strategy. Low turnover tends to indicate a longer-term investment orientation, high turnover the reverse. Turnover has a significant influence on two aspects of investment performance: (1) the cost of managing the fund and (2) the realization of capital gains. Other things being equal, the higher the portfolio turnover, the higher the fund's transaction costs, and the higher the proportion of total return represented by realized (and thus taxable) capital gains. Both factors lower the return to the investor. I shall cover costs in more detail in Chapter 10 and taxes in Chapter 11.
Portfolio Statistics
In comparing total returns among funds, it is critical to always compare like with like. The three concepts of ExMark, Beta, and gross dividend yield may seem a bit complex, but you will want to understand them. Taken in combination, these statistical measures have proven to be a solid basis for comparing funds that are similar in their investment approaches. They help to ensure that a fund's record is judged only against those of other comparable funds.
ExMark.
I have coined this expression to define the extent to which a mutual fund's return is Explained by a particular financial Market. The usual designation for this concept is R-squared, a term that defines the relationship between a fund's return and some market index (for U.S. stocks, typically the S&P 500). While you will not find the term ExMark used elsewhere, it seems to me the term R-squared is too arcane.
For a typical mainstream equity fund, the ExMark runs from 80% to 90%, meaning that an exceedingly high proportion of its total return is explained by the performance of the overall stock market. Only the remaining 20% to 10% of return is explained by some combination of (1) the fund's basic strategy and (2) the tactics and investment selections of the fund's portfolio manager. An ExMark below 80% indicates significantly less predictability of relative performance. A figure of 95% or above means that a fund's return has been shaped predominantly by the action of the stock market itself. Such a fund may be a “closet” index fund, charging high advisory fees but providing little opportunity to add value over and above the market's return. An index fund, the return of which is entirely explained by the action of the stock market, would of course carry an ExMark of 100%.
Beta.
A Beta is a measure of risk that, when applied to investment portfolios (as distinct from individual stocks), provides useful statistical information. It indicates a fund's past price volatility relative to a particular stock market index. The term Beta, widely used by professional investors and academics, may seem esoteric. But I believe it will gain gradual, if grudging, acceptance by individual investors. Most mainstream equity funds have Betas in the range of .85 to 1.05 (fairly close to the 1.00 Beta represented by the market in the aggregate). Especially conservative stock funds may register Betas as low as .75, meaning that in a −10% market decline, their values might be expected to fall −7.5%. Aggressive funds with Betas of 1.25 might see their values fall by −12.5%. The same general dimension of relative volatility also prevails in rising markets. Conditions in each market cycle differ markedly, and Beta should be regarded only as a rough proxy for your volatility expectations.
Gross dividend yield.
The gross dividend yield is a significant indicator of mutual fund investment characteristics. Among stock funds, gross yields tend to be higher, for example, in value-oriented funds and lower in growth funds, hardly an unexpected result. However, most fund statistical services present yield improperly for comparative purposes. The reported net yield is after fund expenses, while a fund's investment characteristics are reflected by its gross yield before expenses. The dramatic difference is seen in the hypothetical illustration in Table 4.4.
Table 4.4 Yield Comparison
| Value fund A | Growth fund B | |
| Gross yield | 4.0% | 2.5% |
| Expenses | 2.0 | 0.5 |
| Net yield | 2.0% | 2.0% |
As you can see, the net yields of the two funds are precisely the same. But the 4.0% gross yield of the value fund is fully 60% higher than the 2.5% gross yield of the growth fund. This range is about what might be expected in a marketplace in which the average yield is 3.2%. Clearly, the gross yield is the more reliable differentiator of a fund's investment philosophy.
Taking these three significant evaluation statistics together, Table 4.5 shows how they work in differentiating the particular stock fund types. The mainstream funds—growth, value, and equity income—demonstrate predictably higher average ExMarks, a manifestation of their similarity to the stock market as a whole. The small company funds, on the other hand, have much higher Betas and much lower gross yields. In all, the table establishes a comparative framework in which to assess the principal investment characteristics of the various stock fund groups.
Table 4.5 Portfolio Statistics Analysis (December 31, 1992)
| Classification | ExMark | Beta | Gross yield |
| Growth funds | 83% | 1.01 | 2.3% |
| Value funds | 87 | 0.87 | 3.7 |
| Equity income funds | 87 | 0.76 | 5.0 |
| Aggressive growth funds | 68 | 1.19 | 2.4 |
| Small company funds | 69 | 1.16 | 1.5 |
| International funds | 38 | 0.65 | 3.0 |
| Gold funds | 0 | 0.00 | 2.6 |
| Standard & Poor's 500 Index | 100 | 1.00 | 2.8 |
Since there are variations in investment characteristics even among funds with the same investment objective, closer evaluation is required if you prefer to fine-tune the analysis. For example, if the value fund in which you are interested has a lower ExMark, a lower Beta, and a higher gross yield than the average for its group, fair comparison requires that you select a subset (or peer group) from among funds with investment characteristics that are more similar. Two examples may suffice to make this point, as shown in Table 4.6.
Table 4.6 Portfolio Statistics Analysis (December 31, 1992)
| Annual return | ||||
| five years ended | ||||
| ExMark | Beta | Gross yield | December 31, 1992 | |
| Selected value fund | 78% | 0.70 | 4.2% | +13.4% |
| Peer group average | 84 | 0.69 | 4.4 | +12.7 |
| Value fund average | 87 | 0.87 | 3.7 | +13.6 |
| Selected growth fund | 91 | 1.19 | 1.2 | +16.0 |
| Peer group average | 90 | 1.13 | 1.6 | +16.4 |
| Growth fund average | 83 | 1.01 | 2.3 | +14.7 |
Let's consider this table in two segments. The selected value fund appears to have provided a subpar return (+13.4% versus +13.6%). But the fund had less of its return explained by the market, took substantially less risk, and earned a higher income yield than its objective group. When compared to a peer group with comparable risk characteristics, the fund was actually a superior performer (+13.4% versus +12.7%). The selected growth fund, on the other hand, is clearly a winner when compared to its broad objective group. But, compared to a peer group of growth funds that also have been more diversified, assumed higher risk and earned somewhat lower yields, it is actually a slightly below-average performer.
These portfolio statistics, however scientific they may appear, should not be considered precise evaluators of differences among funds. Henry Clay was right when he warned “statistics are no substitute for judgment.” But these three factors, taken together, substantially narrow the parameters in which to evaluate a fund's relative performance. Thus, they provide useful information.
To perform the sort of analysis outlined in this section, you will need to gather all of the data I have discussed. Facts on fund asset size, age, manager tenure, and cost are readily available through prospectuses and major financial publications. While information on portfolio characteristics and portfolio statistics is more difficult to obtain, several statistical services provide it. Chapter 8 offers a full discussion of the sources and uses of mutual fund statistics and information.
In the final analysis, I cannot emphasize enough the importance of fairness (and common sense) in assuring that you compare only funds that have similar investment policies and characteristics. Sensible performance comparisons can be made only after establishing that fairness. Even then, as I shall now show, selecting equity funds on the basis of past performance is likely to be a futile effort on your part and virtually certain to be a futile effort for fund investors in the aggregate.
EVALUATING PAST PERFORMANCE
No matter how many cautions are expressed about picking mutual funds simply on the basis of their past performance, most investors still do exactly that. It seems so easy. Yet the record is crystal clear that past performance success is rarely the precursor of future success. Here are a few guidelines about what I mean by past performance and how to evaluate it.
To begin, evaluate the composition of a fund's return to determine if it will meet your needs for either income generation, capital growth, or some combination of the two. From that point, consider the fund's total returns in the aggregate. Since long periods of time are more meaningful in evaluating fund performance than short periods, it clearly is more relevant to observe a fund's returns over a decade than over a year.
As the time frame lengthens, it is critical that you observe not only the fund's average return over a period of years but also its performance from one year to the next to make sure there is some thread of consistency in annual returns. Consider two hypothetical funds in the same peer group: both have achieved identical +12% annual rates of return versus +11% for their peer group. Yet one has outpaced the group by +1% every year. (Such consistency, of course, does not occur in the real world.) The other underperformed by −1% in eight of the ten years but outperformed by +10% in two of the years. (This kind of inconsistency is anything but rare, especially among smaller or more specialized funds.) You should be wary of attributing too much meaning to the past returns in which top performance is concentrated in just a few short periods.
With that thought in mind, let's look at the record. Time and again, it has been demonstrated that the relative return achieved by an equity mutual fund yesterday has virtually no material predictive value for tomorrow. While you may intuitively suspect that this is the case, it is subject to testing in the laboratory of fund performance. The basic level of analysis is simply this: consider the actual past records of all broad-based general equity mutual funds, pick out the top 20 in a given period, and then observe the actual future relative returns they achieve. Let's begin on the short-term level. How did the one-year champions perform during the subsequent year?
To minimize the possibility of randomness in the one-year data, I compared fund rankings for each year in the past decade (i.e., where the top 20 mutual fund performers of 1982 ranked in 1983, and so on to where the top 20 of 1991 ranked in 1992). For simplicity, I then averaged the ten periods. Table 4.7 presents the results. Here are some of the significant conclusions:
- A top 20 fund's performance in one year has no systematic relationship to its ranking in the subsequent year. (A glance at Table 4.7 demonstrates this randomness.)
- A typical top 20 fund provided a phenomenal return of +42.3% in its leadership year, more than three times the all-fund average of +13.3%. In the second year, its return averaged +17.6%, compared to the all-fund average of +13.1%. (If this margin could be sustained by the fund in subsequent years, its performance would be outstanding.)
- Funds in the top 20 in a given year have, on average, ranked 284 of 681 funds in the subsequent year. While better than mere chance—which would suggest an average rank of 341—it can be described as regressing to the mean.
Table 4.7 One-Year Rank Order of Top 20 Equity Funds (1982–92)
| Average rank | Average rank | ||
| First year rank | in subsequent year | First year rank | in subsequent year |
| 1 | 100 | 11 | 310 |
| 2 | 383 | 12 | 262 |
| 3 | 231 | 13 | 271 |
| 4 | 343 | 14 | 207 |
| 5 | 358 | 15 | 271 |
| 6 | 239 | 16 | 287 |
| 7 | 220 | 17 | 332 |
| 8 | 417 | 18 | 348 |
| 9 | 242 | 19 | 310 |
| 10 | 330 | 20 | 226 |
| Average rank of top 20 in subsequent year = 284 | |||
| Average number of funds = 681 | |||
Concentrated specialty and international funds excluded.
Perhaps surprisingly, these general conclusions seem to be affirmed over longer holding periods. In our ten-year study (1972–82 versus 1982-92), the rankings were only marginally helpful. The average member of the top 20 provided a premium annual return of +8.3%(+17.3% versus +9.0% for the all-fund average) in the first decade. But the margin dropped to +1.2% (+14.3% versus +13.1%) in the subsequent decade. The evidence, as shown in Table 4.8, is really quite striking:
Table 4.8 Ten-Year Rank Order of Top 20 Equity Funds
| Rank 1972–82 | Rank 1982–92 | Rank 1972–82 | Rank 1982–92 |
| 1 | 128 | 11 | 222 |
| 2 | 34 | 12 | 5 |
| 3 | 148 | 13 | 118 |
| 4 | 220 | 14 | 228 |
| 5 | 16 | 15 | 205 |
| 6 | 2 | 16 | 78 |
| 7 | 199 | 17 | 209 |
| 8 | 15 | 18 | 237 |
| 9 | 177 | 19 | 119 |
| 10 | 245 | 20 | 242 |
| Average rank of top 20 in subsequent decade = 142 | |||
| Number of funds = 309 | |||
Concentrated specialty and international funds excluded.
- The average rank of the top 20 funds in the first decade fell to 142 of 309 funds in the second. While that is a slightly higher rank than the median rank of 155 that would be achieved at random, the difference is almost certainly statistical noise.
- Only four of the top 20 funds in the first period remained in the top 20 in the second.
- To add insult to injury, while the average total return of the top 20 funds during the second decade (+14.3%) was above the all-fund average (+13.1%), it fell well short of the return of +16.2% on the unmanaged S&P 500 Index.
In short, even when examined from the vantage of a long time period, investing in the winners of the past, solely in terms of highest relative return and irrespective of investment objective, does not appear to increase your chances of selecting the winners of the future.
This “bet on the winner” analysis, involving equity funds of all stripes, is simplistic. But the same general conclusions are affirmed when we take the analysis to a more sensible level. Table 4.9 compares the rankings of growth and value funds—essentially mainstream funds—by quartile for the decade ended December 31, 1987, with their rankings over the subsequent five-year period. I have used a slightly different time frame, grouped funds by quartiles rather than by rank, and limited my analysis to mainstream funds with generally comparable investment characteristics.
Table 4.9 Performance of Growth and Value Funds by Quartiles
| 1987–92 Ranking | Five-Year Average | |||||||
| First | Second | Third | Fourth | Gross | Expense | Net | ||
| quartile | quartile | quartile | quartile | return (%) | ratio (%) | return (%) | ||
| First quartile | 14 | 10 | 12 | 8 | 15.9 | 0.9 | 15.0 | |
| Second quartile | 8 | 13 | 11 | 12 | 14.8 | 0.9 | 13.9 | |
| Third quartile | 13 | 12 | 10 | 9 | 15.5 | 1.0 | 14.5 | |
| Fourth quartile | 9 | 9 | 11 | 15 | 14.6 | 1.7 | 12.9 | |
There were 176 such funds in operation throughout the entire period, and I examined the results of the funds in each quartile during both periods. I wanted to discover whether the rankings of the 44 funds in each quartile during the first period would predict their quartile rankings during the second period. Table 4.9 shows that performance predictability was virtually nonexistent. A completely random distribution of returns—an exercise in coin flipping, for example—would have placed about 11 funds in each box. With four exceptions, each of the 16 boxes had between 9 and 13 entrants.
In fairness, a very slight bias appears toward both first-quartile funds and fourth-quartile funds repeating their performance. The odds, rather than being the expected three out of four against a repeat, were “only” about two out of three at each extreme. Are these odds worth betting on? Probably not, for several reasons:
- The difference in returns is generally small. The average net return on the ten-year first-quartile funds, for example, was +15.0% during the subsequent five-year period, compared to +13.9% for the second quartile funds and +14.5% for the third. That, too, looks a lot like statistical noise.
- In terms of average return, the fourth-quartile funds appear to have remained poor performers. However, while the net returns of these funds were inferior, their gross returns (before being dragged down by inordinately high expenses) were about average. This discrepancy shows the tendency of the returns earned by fund portfolios to regress to the mean, while the expense ratios of the fund portfolios do not.
- On a gross return basis, the five-year results achieved in each quartile were remarkably similar. The first and third quartile funds were equal, for all intents and purposes, as were the second and fourth. Ironically, if you believe past ranking is an intelligent method of predicting future relative returns, you should not limit your selections to funds in the first quartile; the third-quartile funds provided nearly identical opportunities.
- The unmanaged S&P 500 Index provided a return of +15.9% for the five-year period. This was better even than the average net return for the first-quartile funds and arguably achieved with much better odds.
This test poses a question: Does comparing relative returns among generally similar funds over extended periods suggest skilled portfolio managers can be identified in advance? The answer seems clear: No. Even if evaluations of the past fairly compare only mainstream equity funds, and even if extended measurement periods are used, the record suggests that past performance has virtually no predictive value.
Of course, the test in Table 4.9 was based only on a theoretical, what-if analysis. But the conclusion that it is no easy task to preselect a top-performing equity fund is also demonstrated by a more sophisticated real-world test. Rather than simply picking the top performers in retrospect, let's actually select in advance what we might logically expect to be better fund performers, taking into account their total return over at least ten years, their relative performance in both rising and falling markets, and their continuity of portfolio management over at least seven years.
What I just described is the process of selecting funds for the Forbes Honor Roll. It is an eminently sensible and fair system of equity fund selection and has been consistently prepared by the magazine each year since 1974. It encompasses a diverse group of equity funds and an extended time period for evaluation.
How have the Honor Roll selections performed over time? Let's suppose you read the Honor Roll listing each year and purchase (or hold) an equal amount in each fund on the list, eliminating funds as they were dropped from the list. Such an approach avoids the inevitable bias of back-testing (massaging past numbers until they produce the desired result, or as is sometimes said, “applying different tortures to the data until it finally confesses”).
Let's now examine (1) whether the Honor Roll selections as a group provided better returns than other comparable funds and (2) whether they provided better returns than the stock market as a whole. The results are not especially encouraging to those who believe that what's past is prologue. The performance of the Honor Roll funds fell short of both standards. Table 4.10 shows the summary figures.
Table 4.10 Honor Roll Analysis (1974–92)
| Final value of | |||
| Average | Cumulative | initial investment | |
| annual return | return | of $10,000 | |
| Honor roll funds | +11.2% | +650% | $75,000 |
| Average equity fund | +12.5 | +843 | 94,300 |
| Total stock market* | +13.1 | +936 | 103,600 |
*Wilshire 5000 Index
The net result is that returns on equity mutual funds—whether selected carefully or aggregated—have fallen short of those of the total stock market during the Honor Roll's history. Cumulatively, through compounding, the initial $10,000 investment grew to $75,000 for the Honor Roll funds, $94,300 for the average equity fund, and $103,600 for the market index. As a whole, this maximum difference in return of $28,600 is equal to 290% of the amount initially invested. Figure 4.4 shows the cumulative results.
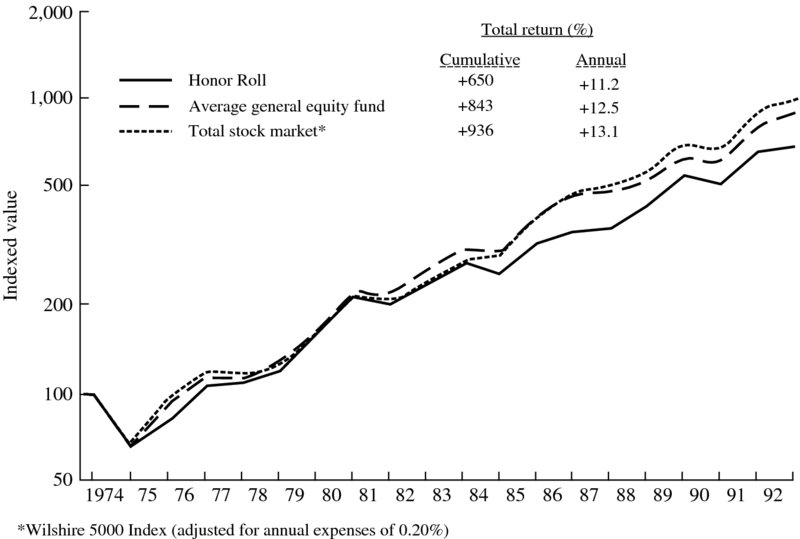
Figure 4.4 Relative Performance of the Honor Roll (1974–92)
A few words about costs: (1) The Honor Roll performance data have been adjusted to take into account any sales charges that would have been incurred on the annual fund purchases. (2) The average equity fund performance data have been reduced by an estimated sales charge of 4% paid only on the initial purchase. (3) The stock market return includes no sales charges but has been reduced by 0.2% annually to reflect expected real-world operating costs. If sales charges were ignored (although there is no reason for doing so), the return of the Honor Roll funds and the average equity fund would have been +13.0% and +12.8%, respectively.
The Honor Roll example makes it clear that picking the winners, even with thoughtfulness and judgment, is far too often a fruitless exercise. Another of Alfred E. Smith's memorable phrases might have been used to describe the hazards of placing too much reliance on a fund's past performance: “No matter how thin you slice it, it's still baloney.”
SUMMARY
The previous comments represent a tough, demanding approach toward equity fund comparison and an acknowledgment that even the most careful analysis provides no assurance of success. Nonetheless, decide you must. The following suggestions may be helpful:
- Invest principally in broadly based mainstream funds; diversification is usually widest in these funds. If current income is a major requirement, give special consideration to equity income funds.
- Select funds by comparing their investment characteristics with those in their objective category (growth, value, etc.) and with a peer group of other funds you may be considering. Comparing like with like is critical.
- Give important consideration to the technical factors of ExMark, Beta, and gross yield. Also consider the age and size of a fund, its portfolio turnover rate and, to the appropriate degree, the tenure of its portfolio manager.
- Consider carefully the cost of acquiring and holding the fund's shares (respectively, sales loads and expense ratios). In an unpredictable world, cost may be the only predictable element of fund performance.
- Focus primarily on a fund's returns for the previous ten years or, for a newer fund, its lifetime. Note year-to-year variations in returns relative to competitors.
- Avoid funds at the top of the performance deck with hot recent records. Particularly avoid funds that are bragging about it or whose managers are lionized in the press. Hot funds never fail to cool off (i.e., to regress toward the mean).
- Avoid as well funds that are persistently at the bottom of the performance deck. Success doesn't persist, but there is fragmentary evidence that failure, in part because of inordinately high expenses, does.
- Limit narrowly based funds (such as international and small company funds) to perhaps 20% of your equity assets in the aggregate. Do not try to beat the market by engaging in short-term trading among sector funds.
If following these rules of common stock mutual fund selection seems overly analytical, tedious, and time-consuming—and, based upon the record of the past, uncertain of success—there is a simpler way. It is called owning the entire market, and I shall discuss it in Chapter 9.