Measuring TV Brand Equity |
Now that we have looked at the various strategies to build television brand equity, we need to examine ways to measure and evaluate our work. In the branding game, it is unwise to simply guess what is going on in the minds of audiences and advertisers. Brand managers can become too close to their product and lose objectivity (just as proud parents refuse to believe that their child is just an ordinary kid). A better way to learn about the real needs, desires, and attitudes of an audience is to invest in well-designed audience research.
Rather than commissioning custom research to measure brand equity, a broadcaster may already have many of the necessary research tools to do a good equity assessment. The trick is to extract the right data from these existing studies. The first part of this chapter begins with an overview of some of the major factors that can hurt or help the accuracy of a brand research study. It is called “Garbage In, Garbage Out,” implying that what you get out of a research study is only as good as what you put in. The second part proposes various ways to measure television brand equity, including the use of Nielsen ratings.
10.1 PART I
10.1.1 GI/GO: Garbage In, Garbage Out
The consequences of poorly conducted research can be worse than the consequences of no research at all. Some brand managers become the gullible victims of bad science and therefore make bad business decisions. The GI/GO adage is appropriate for both consumer and audience research in that poor research procedures can lead to false or misleading results. The upcoming portion of this chapter examines briefly some of the research pitfalls that must be avoided.
10.1.2 The Attitude Versus Behavior Debate: What do You Want to Measure?
What people say does not always correspond to what they do. Although the ingredients of brand equity (awareness and images) reside ultimately in the mind of the consumer, straight “attitudinal” surveys are notoriously unreliable. Many brand researchers prefer indirect “behavioral” surveys because so many attitude studies have proven to be disappointing predictors of customer behavior in the marketplace. (If we believed many attitude surveys about television, we would be convinced that most Americans want to view documentaries and Masterpiece Theater on PBS. However, Nielsen surveys of actual tuning behavior tell a different story.)
Consumer behavior can offer circumstantial evidence of underlying audience attitudes. Let’s use an example of head-to-head late evening newscasts, for which each night of the week there is a different lead-in program. A researcher discovers that for one station, there is a strong correlation between the ratings of a particular newscast and the ratings of its lead-in; the bigger the lead-in audience, the bigger the newscast’s audience and vice versa. In other words, the program’s ratings performance seems to depend heavily on its lead-in. Without asking people’s attitudes, the researcher could conclude that this viewer behavior reveals circumstantial evidence of poor brand equity.
A research study that dwells too much on highly abstract psychological concepts is headed for trouble. The best advice for creating attitudes questions for a survey is to have some reference to a behavior. For example, instead of asking, “What do you consider important news?,” ask “When you choose to watch a local newscast, what type of news stories are you looking for?” The second question has a behavioral component (choosing to watch) that may offer more reliable results.
10.1.3 Bad Samples Produce Bad Data
Because it is impossible to survey everyone in the population, we are forced to acquire a representative sample of the desired population. Overzealous brand managers are sometimes reluctant to admit that the most insightful questions, coupled with the most sophisticated statistical analyses, are still worthless if the sample is biased. A biased sample is one in which certain persons within the population have a greater likelihood of being selected than do others. When dealing with sample-based audience research, a well-designed random sample is essential. Otherwise, a broadcaster cannot project confidently the research findings to the larger population.
Along these same lines, the most abused form of audience research is the focus group. Originally designed to be a device for generating ideas, television executives have mutated focus groups into what they believe is a shortcut substitute for a survey. Instead of going through the necessary steps of creating a large, randomly designed sample base, the manager sidesteps these requirements by inviting a dozen people to sit around a table and chat about the station’s programming. The consequences of this unscientific approach to audience research can be management decisions based on unreliable data.
Focus groups can help generate ideas, perspectives, and insights. But these smaller group gatherings should never be considered a reliable quantitative survey of the general population. In the proper setting, focus groups can be very useful in creating appropriate questions and hypotheses that will be used in a later survey.
Presuming the television broadcaster does elect to do a legitimate market survey by using a large random sample, there is still no guarantee that this sample is a perfect replica of the target population. As long as samples are used to represent a larger population—even perfectly random samples—the results will be estimates, not absolute measures.
Fortunately, this margin of error can be predicted mathematically. This margin will vary according to several factors, including the size of the sample and the variability of the answers provided. Professional researchers will use statistical jargon, such as standard error and confidence intervals, to gauge the probable error contained in a piece of data. These predictions are based on the laws of probability, which implies perfect randomness. If the study begins with a biased sample (i.e., one not random), these error calculations become meaningless. Broadcasters and media buyers often forget that even in the best of circumstances Nielsen and Arbitron ratings are filled with unavoidable sampling error.
10.1.4 Bad Questions Generate Bad Answers
Questionnaire design is a science unto itself. Here are just a handful of situations that researchers have found to be troublesome.
![]() The vocabulary and sentence structure of a question may cause a participant to provide different answers.
The vocabulary and sentence structure of a question may cause a participant to provide different answers.
![]() The order in which questions are presented may influence the way a survey participant thinks about a question.
The order in which questions are presented may influence the way a survey participant thinks about a question.
![]() In a multiple-choice format, the number and type of choices available can often force a participant to give a faulty response.
In a multiple-choice format, the number and type of choices available can often force a participant to give a faulty response.
![]() A questionnaire may not allow participants to express how strongly they feel about a stated opinion, thus exaggerating the interpretation of the results. Similarly, many surveys do not allow the participant to say, “I don’t know” to a question.
A questionnaire may not allow participants to express how strongly they feel about a stated opinion, thus exaggerating the interpretation of the results. Similarly, many surveys do not allow the participant to say, “I don’t know” to a question.
![]() A lack of anonymity or confidentiality may influence the credibility of a participant’s answers.
A lack of anonymity or confidentiality may influence the credibility of a participant’s answers.
![]() Revealing the identity of the company that is conducting the survey may distort a participant’s evaluation of a brand.
Revealing the identity of the company that is conducting the survey may distort a participant’s evaluation of a brand.
These and a score of other design factors can result in wrong conclusions about the target population. An antidote for many questionnaire problems is to “test drive” the survey with a small group of articulate people who can provide candid feedback. This is a situation in which a focus group is the perfect venue for correcting a faulty questionnaire.
10.1.5 Bad Methodology Leads to Bad Results
The proper measurement of brand equity involves “leveling the playing field” so that certain marketing mix factors do not distort the diagnostic process. Just as holding a couple of barbells while standing on a bathroom scale will distort your true weight, so the manipulation of key marketing mix factors can obscure accurate measurement of your television brand equity. The methodology of a brand study must somehow eliminate or neutralize the effects of these troublesome variables. For television, factors such as signal coverage, audience availability, lead-in, counter-programming, and promotional hype must be identified and then controlled (“leveled”) so that the true reputation of the brand name alone can be evaluated.
Let’s borrow an example from the soft drink industry and the cola wars.
Suppose you managed the soft drink concession at a sports stadium. You strike an exclusivity deal with Go-Go Cola that no other cola beverage can be sold within the stadium. The day of the Big Game arrives and thousands of thirsty fans ask for Coke or Pepsi but must settle for Go-Go. This little known brand captures a whopping 100 percent share of the beverage “market”! But is Go-Go Cola truly the preferred brand?
Suppose you allowed the distribution of Coke and Pepsi at the stadium but retained control over pricing. For example, you price a can of Go-Go at 50 cents and Coke and Pepsi at one dollar. Thirsty fans would rather have Coke, but the pricing is so advantageous that they opt for the discounted Go-Go brand. At the end of the day, Go-Go’s “market share” looks outstanding. But is Go-Go Cola truly the preferred brand?
Finally, you “level the playing field” by offering all three cola brands at the identical price. Now, measure Go-Go Cola’s share performance! Only within this controlled or price neutralized marketing mix context can we evaluate properly the inherent brand equity among the three competitors. The sales of Go-Go Cola plummet. Television brands can face the same challenge when any artificial or contrived advantages must be purged from competitive performance measures. Television brands need to be evaluated in an environment in which marketing mix factors are “leveled” statistically so that the only decisive factors influencing viewer choice are the media brand names.
10.1.6 Bad Data Interpretation Leads to Bad Management Decisions
Let’s presume an audience research study employs a good representative sample, a well-designed questionnaire, and a methodology that factors out unwanted variables. The final procedure is to analyze the results and make recommendations. Yet, even during this final step, there can be serious problems. First, there can be a statistical problem. Good quantitative analysis involves certain mathematical skills that may be beyond those of a typical brand manager. (We recommend a college-level night course in Statistics 101.) A second potential trouble area is in the interpretation and conclusions derived from the data analysis. That is, the mathematical calculations may be perfect, but there can be confusion as to what the numbers really mean.
The interpretation of statistical information can be a source of debate among managers. For example, many surveys generate statistical correlations in which two or more factors (variables) are analyzed to see how closely associated they are. A problem arises, however, when a close association is interpreted as causation. That is, one factor is presumed to cause the other to happen. Let’s take an example from nature. There is a strong correlation between the time when the sun rises and the first cries of a rooster in the morning. However, nobody should conclude that the early morning crowing causes the sun to rise. Although this example might appear silly, there are similar situations in media research in which the silliness is not as easily recognizable. For instance, a high correlation between a newscast’s ratings and the day of the week does not necessarily mean that audiences prefer the content of one night’s newscast over another. The genuine cause of one night’s exceptional ratings performance may be an unusual lead-in program or a “run-over” late start for a competing newscast.
Warning—Proof of a close association (correlation) between marketing factors does not necessarily prove causation. Only a controlled experiment can offer the proper insight concerning exact cause and effect relationships.
Another common problem in interpreting statistical results is the failure to recognize the statistical margin of error found in any sample-based research. Because small samples generate high sampling error, managers should not agonize over infinitesimal differences in comparative brand performance. This is particularly true with single-digit Nielsen ratings and shares. Nielsen provides some basic guidelines about applying standard error corrections to their estimates. (Yes, Nielsen admits to considerable sampling error in its own published reports.)
10.1.7 Recommended Quick Read
The National Association of Broadcasters (NAB) has published a short book entitled Troubleshooting Audience Research: How to Avoid Problems with Design, Execution, and Interpretation. Purposely written for broadcast executives who do not have a formal background in research methods but deal with research studies on a regular basis, this book provides simple warnings and recommendations.
10.1.8 Hire a Research Pro
The best solution to the GI/GO problem is to hire qualified professionals in the form of a reputable outside research firm or a properly trained in-house research manager. The consequences are too important to risk attempting do-it-yourself amateur brand research. As a cost-saving measure, many major group broadcasters have a corporate research staff that can assist individual stations. Regardless of who actually executes the research study, an astute television brand manager should understand thoroughly the basic principles guiding the measurement of media brand equity.
10.2 PART II
10.2.1 Ways to Measure TV Brand Equity
Earlier, we proposed a television equity model that consisted of two basic audience components: brand awareness and brand image. Now, we will take a brief look at several ways to measure these components.
10.2.2 Measuring TV Brand Awareness
Brand awareness relates to the likelihood that a brand will come to mind when given different types of clues. As mentioned earlier, brand awareness can be divided into recall and recognition components. We also discussed that in low-involvement purchase situations, top-of-mind awareness alone can drive brand choice.
For television broadcasters, this top-of-mind issue is critical for attracting occasional, or “soft core”, viewers of program genres. For many consumer brands, the difference in market share between the first- and second-ranked product lies in each brand’s capacity to lure infrequent users. For instance, a person may seldom watch a local newscast, but when he or she does desire some local news, the most familiar brand name will probably be chosen. From our discussion of “double jeopardy,” we know that light users tend to be exceptionally loyal. Therefore, a highly familiar station or program can monopolize these infrequent users, translating them into rating points!
Measuring brand recall can be a relatively simple procedure. Survey participants can be asked to recall from memory the names of programs, features, talent, and promotional slogans. The order and elapsed time for recalling different competitive brands can reveal the degree of top-of-mind recall. Measuring brand recognition, or aided recall, involves the participants receiving some information they can trace back to memory. For instance, a person would be asked if they recognize any on-air talent from a list of names and photographs.
In addition to tabulating correct answers, recording mistakes in recall and recognition can also be a revealing research experience. For instance, if names, faces, slogans, or channels are attributed to the wrong program, the researcher can assume there is significant ambiguity and confusion in the branding marketplace. Which is worse? A brand that cannot be identified at all or a brand that is wrongly identified? Either case presents some serious branding challenges. Poor recall can be overcome usually by increased advertising and promo exposure. However, mistaken identity implies a positioning problem in which competing brands are not differentiated enough by audiences.
10.2.3 Measuring TV Brand Images
Once the competitive awareness of a media brand is assessed, we can move into the far more complex arena of brand images. As discussed earlier, brand images address associations that can be divided into the three measurement areas of strength, favorability, and uniqueness. Below are several ways these items can be posed to a survey participant. The first is an open-ended qualitative format in which the person essentially “fills in the blank” by using his or her own words:
Strength: What are the strongest associations—thoughts and feelings—you have toward the brand? What comes to mind first when you think of the brand name?
Favorability: What is good or bad about the brand? What do you like or dislike about the brand’s performance? Does the brand stand for anything you care about? Would you call this brand one of your favorites?
Uniqueness: What makes the brand different from other competing brands? What features or characteristics does the brand have that others do not?
Remember that these brand associations can deal with emotional or intangible meanings, as well as the functional aspects of the product. For example, a participant may state that it is the warmth and friendliness of the television news anchors that makes one newscast truly unique among its competitors. Also, as a means of describing a unique branding factor, participants should be encouraged to talk about the intangible benefits derived from experiencing the brand. For instance, a viewer may feel more emotionally secure knowing that one station has a highly sophisticated piece of weather radar.
Rather than a qualitative open-ended format, a more structured approach would include a multiple-choice or what academics call a fixed alternative format coupled with numerical scales. This method fosters better statistical analysis of information than does the open-ended style of questioning. In addition, the participant can register the strength of the response. Table 10.1 is an example of a credibility evaluation of a television news program.
Unlike the open-ended questions, the results of this questionnaire can be analyzed by using statistics. Of course, in order to create such a multiple choice survey tool, the appropriate dimensions (brand associations) must be predetermined by the researcher. This may not be as easy as it seems. Focus groups can often provide help in coming up with possible brand association categories. Both qualitative and quantitative techniques have their place in branding research.
10.2.4 Measuring Relevancy and Importance
In a prior section we examined the issue of the relevancy and importance of image dimensions, concluding that in a purchase situation some factors are more important than others and that brand managers need to stay focused on those elements that will generate the most impact. There are several ways to incorporate this notion into an audience survey. A simple media example is shown in table 10.2.
Table 10-1. Newscast Credibility Survey

The results from this type of survey enable a television brand manager to have a sense of priorities. The results may not only indicate that the news set is not very good but also reveal that the set is not very important. Therefore, investing thousands of dollars in a new set may not be the most prudent branding strategy. A similar format can be used for sales promotion, whereby clients can be asked what elements of their relationship with a station are most important and how well the sales department performs on each dimension.
Another way to reveal these priorities is what we call a “take-away analysis,” in which the survey participant is given a list of perhaps a dozen attributes and benefits that probably influence viewer choice. The take-away is an exercise in subtraction in which the participant must take away these items one by one based on how crucial they are for the brand’s success. This process continues through several “rounds” until only a handful of priority characteristics remain that the participant considers the indivisible core of the brand. In other words: Take these items away and the brand’s true audience value is lost.
Too often in a crisis situation, the station managers invest in expensive promotion efforts that have a minimal payoff (“Quick, build a new set, replace the music, hire on new anchor!”). These ranking and take-away procedures permit the brand manager to see the true essence of the brand and weed out those product features and consumer benefits that are not considered crucial by the consumer for the brand’s survival. An abbreviated version of such an exercise is shown in Table 10.3.
Based on the above analysis, this station can not afford to lose its image dimensions involving weather coverage and anchor number three. These areas of the program are essential for its future success.

10.2.5 Behavior-based Measures of TV Brand Image
The examples presented so far have emphasized attitudinal measures of equity, but we know that consumer behavior can also reveal circumstantial evidence of the strength, favorability, and uniqueness of certain brand associations. Information about the purchase, usage, and loyalty to a brand can be acquired from various sources. For the television industry, the most common measures of audience behavior are Nielsen ratings. Below are a number of ways to use Nielsen ratings to measure various aspects of television program brand equity.
10.2.6 Market Share
The most rudimentary way to assess audience strength is to “count heads.” One can infer that in many cases the program or network that boasts the most people watching probably has a substantial number of brand loyalists. Earlier in our discussion of the double jeopardy effect, we found that the market leader tends to attract proportionately more loyalists than market losers.
Table 10-3. Take-Away Exercise

Because of fluctuations in homes using television (HUT) and persons using television (PUT) levels, we recommend that share figures, rather than ratings or totals, be the primary unit of measure. Share is a better indicator of competitive performance on a “level playing field.” For demographic analyses, which are normally not displayed as shares, this may require some calculations by the local management.
10.2.7 Stability over Time (Trending)
We have already ascertained that successful television brands tend to remain successful in that they deliver consistent audiences over time. Tracking Nielsen audience ratings over several sweep periods can offer evidence of the relative stability of a media brand.
10.2.8 Exclusive Viewing
Brand loyalty is the outcome of brand equity, meaning that a loyal consumer will exclusively use one brand. For a modest fee, Nielsen will extract exclusive viewing data from its diary or metered databases. This type of analysis is part of what Nielsen calls its Nielsen Station Index Plus (NSI Plus) client services.
10.2.9 Audience Turnover
Another indicator of audience loyalty is audience turnover, a calculation that incorporates cume ratings data. Cume is shorthand for “cumulative” and refers to the total number of unduplicated homes or people who watch a program over the course of a week. In other words, over several days a daily stripped program (such as a local newscast) will accumulate a weekly total audience that will be bigger than its daily average quarter hour (AQH) audience. For many years, radio stations have used Arbitron cume data to measure audience loyalty by dividing a program’s weekly cume audience by its AQH audience. This fraction is known as a turnover ratio. Divide the fraction, and the result is a number called a turnover index. A low turnover (or low “churn”) implies strong loyalty. Conversely, high turnover implies poor loyalty.
To date, television broadcasters rarely ask for cume audience information, so Nielsen has been reluctant to provide a great deal in its standard sweep reports. However, for a modest fee, Nielsen will generate additional cume and turnover statistics for a subscribing station.
10.2.10 Lead-In Analysis
We have already stated that taking advantage of a strong lead-in is a smart programming strategy, but the cursory results from these scheduling maneuvers should not be confused with brand equity. Television branding is about cultivating “appointment” programming, in which audiences are drawn to a program because of its content not its lead-in. Several research studies have confirmed that some television programs capitalize on their lead-in ratings better than do other programs. This occurrence can be analyzed from two points of view: audiences retained and audiences recruited. Audiences retained refers to the ability of a program to hold or retain its lead-in audience. Audiences recruited refers to a program’s ability to attract or recruit audiences from competing channels. Programs exhibiting strong brand equity outperform their competitors on both measures.
In addition to examining the standard rating and share performance of two adjacent programs, Nielsen NSI Plus offers several types of “audience flow” studies that will track these two dimensions and present the results in terms of proportions as well as raw numbers. Program equity can be assessed more accurately by using the proportional data. For example, a program may have a weak lead-in, but the proportion of viewers it retains may be larger than that of a competitor. Similarly, the proportion of viewers recruited from other channels may also be considerable, again indicating an “appointment” audience.
10.2.11 Heavy Versus Light Users
From toothpaste and laundry soap to newspapers and television programs, dozens of consumer behavior studies have found that heavy users of a product category often behave differently than do light users. Although frequent purchases contribute mightily to a brand’s overall market share, marketing professionals also know that heavy users tend to be less loyal. Conversely, occasional users tend to stick with one brand.
As a special request, known as a “qualifier,” Nielsen can break out viewer behavior by usage. For example, a station may wish to look at viewers who watch local news at least four times a week and compare these data to a second audience group that watches no more than two newscasts per week. In many cases, a large portion of the heavy users tends to “shop around” among several brands. Also, the top-ranked station often attracts a disproportionately higher share of the light users. Because it is usually impossible to stimulate more usage of a product (Watch more news!), the next best strategy is to find more customers. Looking at the preferences of heavy verses light users of a media product, such as news, can reveal some interesting branding opportunities.
In addition to Nielsen Media Research, other companies such as Marshall Marketing and Scarborough Research conduct audience behavior studies for individual markets. These data can be used to enhance a broadcaster’s understanding of target audience behavior and program brand equity.
10.3 PART III
10.3.1 Measuring the Competition
Although learning as much as possible about your own brand is indeed important, the art and science of branding is grounded in the notion of competition. Success (and your job security) is measured usually by how well your brand performs compared with the other guy’s down the block. The following is a brief overview of a few ways competitive performance can be analyzed.
10.3.2 Indexing
Indexing is an effective way to understand quickly the competitive landscape. An index is simply a unit of data expressed as a percentage of a base score. The base score is given the index value of 100 and often represents the average score of all the data entries. Let’s use IQ scores as an example. Informing a person of the number of correct answers on an intelligence test may be of little value without knowing how everyone else performed. Presenting the average score of the test group along with the individual test score may provide more insight, but if the goal is to determine quickly how well a person performed relative to the competition, a simple index is the better solution. An IQ of 120 means that that person scored 20 percent higher than the group average.
A television example of indexing would be a ratings analysis in which the base score (index of 100) becomes the average rating of all late evening newscasts in a market. The ratings of each competing newscast are compared to this base score and then converted into a proportion. Table 10.4 contains a simple example.
Rather than confounding the reader with a barrage of ratings data, the index scores give a quick evaluation of how competitive a brand is within the marketplace. In this case, Station A outperforms the market by 25 percent. Station B offers typical or average performance whereas Station C is struggling, achieving only 75 percent of the market average in ratings performance. This indexing operation becomes even more “user friendly” when a dozen or more demographic categories need to be analyzed among several competitors. A simple scan of an index column can provide a wealth of branding information.
Of course the market average does not have to be the only benchmark (statistical base). Instead, another standard could be used, such as the leading station. In the above case, Station A would be assigned an index of 100, and the other two stations’ performance indices would be calculated against the leader rather than the total market.
Audience attitudes can also be indexed. Let’s use a prior example of the News Credibility scales from earlier in this section. Here participants choose an answer between one and five. The next step for the researcher would be to calculate the average scores for all of the test phrases and then compare competing newscasts. As with our case with Nielsen ratings, the average score for all competitors could be given the benchmark index of 100. Now we have some quick competitive insight. A station may score high on a specific dimension, such as a 4.5 for “trustworthy,” but reveal an index of only 110, indicating that on average all the newscasts in the market are regarded as highly trustworthy. Referring to our brand association framework of strong, favorable, and unique, we see that “trustworthiness” is strong but not necessarily unique, and therefore, the concept should not be the centerpiece of a branding campaign intended to differentiate brand competitors.
Indexing is also a handy tool for combining research results from different types of studies. For example, suppose a television brand manager wanted to compare Nielsen ratings data with audience attitude scales. The answer is indexing. By standardizing these data into indices, the results from all kinds of audience studies can be incorporated in one presentation. A hypothetical example of one program in which (1) Nielsen household and demographic ratings (RT), (2) several five-point attitude scales, and (3) geographical coverage have been merged into one indexed presentation is covered in Table 10.5.
Station |
Household rating |
Index |
A |
15 |
125 |
B |
12 |
100 |
C |
9 |
75 |
Combined AVG |
12 |
100 |
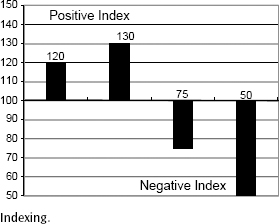
Comparing the original data creates an obvious “apples-to-oranges” (ratings to scales to populations) dilemma, but the indexing column resolves this mathematical problem and provides better insight into the program’s competitive performance. Ranking these attitude indices top to bottom on the presentation would allow the reader to understand the relative importance of each brand characteristic. In addition, index scores can be translated easily into bar graphs in which the base index of 100 becomes the base line for the graph. Indices greater than 100 are placed above the line (+), while indices less than 100 are placed below the line. Figure 10.1 is an example of a graphic presentation of indexing.
10.3.3 Positioning
Recall that positioning deals with the proximity of a brand to its market competitors in terms of strength, favorability, and uniqueness. As with indexing, positioning exercises are designed to detect competitive advantages and usually make use of graphic displays in which the relative positions of competing brands are plotted on grids. Several grid layouts can be used, depending on the researcher’s needs. Figure 10.2 is an example of one such grid using three stations positioned according to weather forecasts and sports coverage and a 10-point scale.
Positioning grids can accommodate easily indices as well as conventional data. Also, some high-end research companies may use sophisticated “multidimensional scaling” statistical software to reveal the “perceptual space” for different dimensions. Although the typical broadcaster would not be expected to be an expert on this type of complex analysis, he or she should understand the underlying theory and be able to talk intelligently with outside research firms.
Table 10-5. Index by Brand Dimension
Brand dimension |
Raw data |
Index |
Nielsen households (RT) |
17 |
120 |
Women 18–49 (RT) |
8 |
130 |
Men 18–49 (RT) |
10 |
75 |
Trustworthiness (1–5) |
4.5 |
100 |
Compassion (1–5) |
3.2 |
50 |
Impartial (1–5) |
2 |
75 |
Population of counties reached (000) |
65 |
100 |
Regardless of the level of sophistication, the essential concept of brand positioning remains fairly simple—it is the process of defining a brand relative to its competitors. The word positioning implies an observable location, a place on a psychological “map” where our brand resides.
10.3.4 “Blind” Experiments
The harsh reality for many consumer goods is that, in terms of actual product performance, consumers cannot distinguish important differences among competing brands. Marketing research literature is filled with examples of “blind” taste tests for soft drinks, beers, and cigarettes, revealing that when the brand labels are removed or rearranged, participants cannot tell the difference among brands. For example, one study found that the taste preferences between two leading soft drink brands varied radically depending on whether the test subjects were blindfolded or not. Medical researchers call this phenomenon a placebo effect, wherein a patient’s expectations of performance do not correspond with reality.
Other consumer products, including some media products, can experience the same confusion. In many cases, what truly distinguishes one consumer brand from another is not its functional performance (such as taste) but the intangible brand associations or images attached to the brand names. This type of blind experiment can be applied to television. Here is one television news example:
Recruit a sample of typical local news viewers who claim to have a definite preference in newscasts. Make sure you have an equal number of loyalists for each station. Divide the group randomly into three test groups. Each test group is exposed to a hypothetical news story in which the only difference in the presentation is the channel and name of the newscast (e.g., Channel 9 Eyewitness News, Channel 6 News Center Six, and Channel 13 Nightbeat). The reporter must be a person that nobody would recognize (a “ringer”).

After viewing the story, the test subjects were asked to fill out a questionnaire concerning the strength, favorability, and uniqueness of the news presentation. Brand equity researchers would predict that the true loyalists will be more generous in their evaluations when the news report is identified with their “preferred” newscast—even though the presentation content is identical in every other respect. This is the “added value” of brand equity.
Depending on the research needs of a station or network, different versions of the above experiment can be implemented. Perhaps sports, weather, and special features could be assessed in the same manner. The key to any “blind” experiment is to take away the brand name and see what happens.