
Basic Training: How To Read A Rating Book |
|
One of the things a television brand manager has to deal with every day is the ratings. But many people may either never learned how or have forgotten how to read a rating book, so here’s a refresher course.
The Nielsen Media Research company compiles diary ratings four times a year in most markets. (Larger markets have additional rating books in October and January, and four markets have an additional rating opportunity in March.) Nielsen is also responsible for overnight measurements in a growing number of markets.
Let’s look at a typical rating book containing data from diaries. The first, and most obvious place to start is the designated market area, or DMA. Your station serves these people. But it serves some better than others. The counties in white are your metro counties. This is the key segment of the market. The metro is surrounded by what are called your local DMA counties. The fringe DMA counties may also view signals from other markets but, in Nielsen’s opinion, they view your market the most. And the entire map gives you a general feeling for where you are in relation to other markets.
Now that you know where your station is, you want to find out about ratings and shares. You generally will be most concerned with your station’s ratings and shares in a given period.
What is a rating? According to Nielsen it is “the percentage of a population viewing a TV program during an average time slice.” That so-called time slice is anywhere between 15 minutes and half an hour, depending on the time of day.
The other important number is share. According to Nielsen, a share of audience is the percentage of television usage attributable to a program.
You also need to pay attention to the homes using television (HUT) column and the people using television (PUT) column. They tell you how big your universe is.

Figure B-1. A typical DMA map. Courtesy Nielsen Media Research.
Statistically minded brand managers can derive the share by dividing the rating by the HUT. Or get the rating by multiplying the share times the HUT. Or get the HUT by dividing the rating by the share. For your purposes, however, the most stable number of the three is the share of audience to provide a rough comparison of program popularity. But there are a lot more numbers on this page than rating, share, and HUTs.
What good are they? Your station sells these rating points to advertisers. A given advertiser may know that women between the ages of 18 and 34 are most likely to buy its product. So your sales department sells the advertiser a program that has a high particular demographic. How your station does in the desirable demos (demographics) can make or break a sales goal. Because the marketing department can be called the station’s chief advertiser, it’s your goal to attract as many of these desirable demos as possible. So, know your demos! Are your programs strong in men? Women? Children? A few moments studying the demographic column should give you a picture of where your station is relative to others in your market.
How often and how well you reach these people with your message is called “reach and frequency.” Reach and frequency data can’t be determined from standard ratings book. But you should know what the terms reach and frequency mean. Reach is the number of different homes or people exposed at least once to your message over a given time period. This is also called the cumulative or unduplicated audience. Even if homes or people are exposed more than once, they’re only counted once. Therefore, the maximum reach is 100 percent of the universe. (This is not to be confused with achieving a 100 GRP [gross rating points] schedule.)
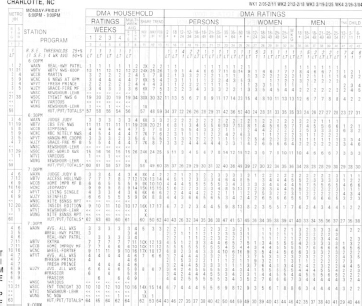
Figure B-2. A typical page from a diary-driven ratings book. Courtesy Nielsen Media Research.
So if reach is the number of different people, frequency is the average number of times your audience is exposed to your message.
A good rule of thumb is to make sure that your frequency is three or more, but no more than nine. After nine, you’re wasting your resources. To get a reach and frequency report, you’ll need to order special reports or have access to software. This is where you’ll get to know your station research director or the sales department’s designated research maven.
Another term you may run into is gross rating points or GRPs, or simply “Grips.” Grips are the sum of all rating points achieved in a given schedule. If you want to achieve a 100 GRP schedule for a week against a given program, simply add up the total audience rating points for each time you plan to air a spot for that program. Note that a 100 GRP schedule does not mean you have reached 100 percent of your audience.
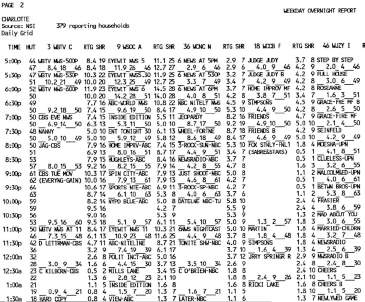
Figure B-3. A typical overnight rating sheet. Courtesy Nielsen Media Research.
The Nielsen rating book contains a snapshot of your market’s viewing patterns for the 4 weeks it covers. You will note significant viewing pattern changes among the November book, the May book, and the July book. This is usually owing to seasonal lifestyle changes. But, you want to know, or your boss wants to know, how many people does a rating point represent?
Here’s where you pull out the calculator, ruler, and the magnifying glass.
First, find the listing of the television households, which is usually on the first or second page of the book. In a given market, Nielsen estimated there were 978,100 households. Dividing that by the universe of 100 percent gives you one rating point equals 9,781 households. If you’re able to show a two-rating point increase, your station will have gained a potential of 19,562 households! And those are numbers your sales department should be able to merchandise to clients for increased sales!
So far, we’ve discussed the rating book. Many television markets are also metered. The metering process provides stations and advertisers with a way to check on how well they’re doing on an overnight time frame as the programs relate to households (not individual demographics). Rather than having someone in the household fill a diary with viewing information, the Nielsen company monitors every television tuner in a sample household. This includes the main television, televisions in the kitchen or bedrooms, the tuners in VCRs, and even a tuner in a personal computer video card, if one is in the household.
The good news is that these overnights, as they’re called, provide instant feedback on what a station—or a station’s competition—is doing. The bad news is they don’t provide demographic information. You, and your sales department, have no way of knowing if your 25 rating is made up of highly desirable adults 18 to 49 years of age or if you have somehow cornered the market in Latvian penguins.
The Nielsen rating system is the main way television stations gather audience research information, but not the only way. Other ways of gathering information include telephone surveys; face-to-face surveys, usually conducted in shopping malls; mail surveys, which can also be an effective way of driving viewing in addition to gathering information; newly emerging e-mail surveys; and focus groups.
This has been a basic look at the sometimes baffling world of ratings. Ratings are the key to understanding the effective use of on-air promotion and planning campaigns. Take some time to go over a rating book and see what else you can learn about your station and your competitors. Turn the ratings from unfamiliar territory to a useful tool.