
Long-Lived Capital With Embedded Tangible and Intangible Capital
The embodiment of innovation, ideas, and technology in capital investment—both tangible and intangible—has been among the most notable features of the four industrial revolutions. The nature of technological embodiment has been a source of periodic controversy in the economics literature. Putty-clay capital was studied in the 1960s, and received renewed attention in the 1990s and 2000s (see Hercowitz 1998, Cullenberg and Dasgupta 2001 and Gilchrist and Williams 2002).
With putty-clay capital, the ex ante production technology allows substitution between capital and labor. Ex post, however, productivity is determined by the embodied vintage technology and the fixed choice of capital intensity. In a putty-clay model, capital is replaced with capital that has greater capacity than the depreciated capital.1 The purchase of new capital only affects the productivity of the workers using the new capital. It leaves the productivity of workers using legacy capital unaffected. The new capital does not impact the productivity of existing capital.2
To understand the influences of growth, productivity, technology, and depreciation on investment spending, Lasky (2003) builds a model of investment spending in which the desired change in output capacity is a function of net additions to capacity, the growth in capacity from existing capital, and the difference in output from replacement capital and the capital replaced. The implication, by simple arithmetic, is that net additions to capacity—represented by an investment equation—equals the desired change in capacity minus both the increase in capacity from replacing depreciating capital with new capital and the gains in productive capacity from existing capital.
Let Ne,t be the units of expansion capital of each type put in place at time t. Let Rm,t,i be the units of capital of type m and age i depreciating at time t. Let yt be the average output during period t of workers using only capital existing before time t. Let yhm,t,i be the hypothetical output of a worker using a unit of capital of type m aged i years at time t had it not depreciated at time t.3
Let ym,t+i,i denote the output at time t+i of a worker using capital of type m aged i periods at time t+i.
![]()
where At+i is economywide technology, Ut+i is the effect of economy-wide intensity of usage, or effort, on productivity, Gt ( ) is the function aggregating different types of capital, km+t is the size of capital of type m in constant dollars used by worker n at time t, and a is capital’s coefficient in the production function. There are M types of capital.
Let yt be period t output of workers using only capital existing before time t. If new capital was the same size as existing capital, expansion capacity would be Ne,tyt. However, if new capital differs in size from existing capital, output will differ from that of existing capital. The output of expansion capital can be expressed as
![]()
In a putty-clay world, the output of replacement capital is generally larger than the output of a worker using depreciated capital. Let Rm,t,i be units of capital of type m and age i depreciating at time t and let Lm be the service life of capital of type m. The total replacement capital of type m:
![]()
At time t, the increase in capacity obtained by replacing depreciated capital of all types with new capital is:
![]()
Let A˙t be annualized growth of technology at time t. Then the rate of increase of capacity due to technology growth at time t is:
![]()
where Nt is the total capital of each type at time t. Let Y˙Et be the desired change in output at time t. Output per worker from new investment is:

Adding Rm,t ym,t,0, output of type m replacement capital, to both sides of equation (B.6), yields the output of new capital of type M:
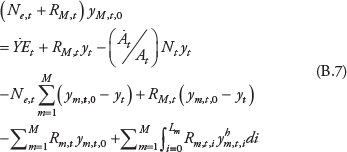
The first line of equation (B.7) to the right of the equal sign indicates the capacity of workers using new capital as the desired change in capacity plus the capacity of depreciated capital less the change in capacity from using improved technology with existing capital. The second line adjusts for the net output of new machines. The third line adjusts for the net output of existing machines.
To specify the investment equation, output per worker yM,t,o in equation (B.7) is replaced with the size of new capital of type M. Businesses choose the units of capital that maximize expected profits. The optimal units of capital depend on output per worker and the cost of capital.
The present discounted value of profits associated with a new unit of capital of type m purchased and put into service at time t is:
![]()
where pt is the price of output yt, F is the discount factor:
![]()
For the nominal rate of return rt+j at time t, qm,t is the purchase price of new capital of type m. Setting the derivative of the expected profit function (B.8) to zero and solving for qm,t yields:
![]()
where a circumflex over a variable indicates an expected value.
If ![]() is replaced with the elasticity of the capital aggregator, G, with respect to the change in the size of the i-year-old type m capital at time t+i
is replaced with the elasticity of the capital aggregator, G, with respect to the change in the size of the i-year-old type m capital at time t+i
![]()
then, the first-order condition is:
![]()
where atsm,t+i,l is the share of the present discounted value of the expected output to be produced by the work using the new capital that equates with the cost of new capital. If sm,t+i,l is constant over time:
![]()
Evaluating the integral and solving for km,t yields the optimal size of capital units:
![]()
where nm.t is the cost of capital:
![]()
For simplification, rewriting equation (B.7):
![]() (B.14)
(B.14)
where NONC is net output of new capital and NOEC is net output of existing capital. Investment in capital of type m at time t:
![]()
Substituting for km,t from equation (B.12), dividing by yt, and substituting for (Ne,t + RM,t) yields:
![]() (B.16)
(B.16)
Investment in capital of type m is a function of (1) the elasticity of output with respect to capital of type m, (2) the ratio of the output price to the cost of capital, (3) the increment of desired capacity growth from capital type m, (4) desired capacity growth, (5) replacement demand, (6) growth in technology, and (7) the net gain from net new and existing capital.
With (B.16), the impact of demand and productivity shocks on investment spending can be considered. Somewhat surprisingly, the model is explicit about the impact of technology on investment but treats the impact of changes in TFP indirectly. Technology, A, alters the output delivered per unit of capital. Similarly, improved technology can also reduce qm,t, the purchase price of capital. TFP, as is the standard definition, alters output as resources are collectively utilized in alternative configurations. Changes in technology and TFP do not, in principle, need to be associated or causally related.4
In (B.16), an increase in TFP could cause a proportionate rise in output and thus in investment. TFP could also affect the cost of capital relative to the output price. For example, if higher productivity leads to lower inflation and interest rates, real interest rates and the real cost of capital could decline. Similarly, improved TFP could increase the output of existing capital, reducing the need for investment. Conversely, if output falls sufficiently or the cost of capital increases, or both, a TFP decrease could reduce investment, possibility even in the face improving technology.
A demand shock is defined as a change in Y˙ E independent of other terms in (B.16) with an increase in demand resulting in an increase in capacity. Of course, in a dynamic context, the persistence of the demand-induced investment increase will depend on the response of prices, interest rates, and the cost of capital.
Applying the investment equation to the industrial revolution periods, the installation period, most recently 1975 to 2010, is characterized by (1) aging capital following substantial capital investment spending in the preceding deployment period, (2) a new technology, nascent at the outset of the period reaching maturity later in the period, and (3) focused business model innovation. Such conditions could suggest slower investment spending growth. One consequence is increased obsolescence of tangible and intangible capital as technology advances, driving heterogeneity in cross-sectional profitability and firm-level productivity. At the aggregate level, capital is reallocated with restructuring costs affecting the overall benefit of innovation.
Conversely, the deployment period, for example 1945 to 1975, is characterized by (1) a mature, low-cost technology and (2) rapid business model innovation. The combination of a demand shock and a productivity shock would result in substantial capital investment and, eventually, resulting in a younger capital stock.
Other evidence of the periodic de-linkage of technological innovation and increased TFP growth can be found in the economics literature. The influence of innovation on TFP—capturing, for example improved management practices, business model innovation and new product and service offerings—manifest over long periods. Over a 5- to 10-year horizon, the Kelly et al. innovation index is a strong predictor of TFP, for which a one-standard deviation increase in the index is associated with a 0.5 to 2 percentage point higher annual productivity growth.
In addition, Liu, Fernald and Basu, 2012 find that output, consumption, investment, and labor hours rise in response to improvements in consumer-goods technology but all decline following similar improvement in investment-goods technology. Basu, Fernald, and Liu show that the effects are consistent with the predictions of a two-sector dynamic stochastic general equilibrium (DSGE) model with sticky prices in each sector. The assumption that investment goods prices are costly to adjust helps fit the evidence that the relative price of investment goods adjusts slowly to shocks.
1 Originally introduced by Johansen (1959), putty-clay technology breaks the tight restriction on short-run production possibilities imposed by Cobb–Douglas technology and provides a natural framework for examining issues related to irreversible investment. However, an impediment to the adoption of the putty-clay framework has been the analytic difficulty associated with a model in which all existing vintages of capital are tracked.
2 In the neoclassical production function, output is a function of labor hours, and the capital stock. Any investment affects the marginal productivity of all labor and existing capital. Empirical investment behavior supports the assumption of ex post fixed proportions (clay) over the assumption of ex post variable proportions (putty). See Lasky (2003).
3 Lasky (2013) presents Ne,t and Rm.t.i as the number of machines for expansion and replacement. Also, km,t is the size of machine type m used by worker n at time t. The assumption is that every worker uses a similar, although not identical, mix of different types of plant and equipment. Lasky’s exclusion of intangible capital limits the model for current purposes. Here the assumption is that there is both tangible and intangible capital. Ne,t and Rm,t,i are units of capital for expansion and replacement and km,i is the size of capital of type m in constant dollars used by worker n at time t.
4 If TFP captures, for example, improved management practices or business model innovation, improved capital technology—for example, increased computing power or advances in software technology—may or may not result in output and investment increases depending on how resources are combined. The distinction between the success of management practices and information technology investment has been the focus of Bloom, Van Reenen and collaborators across a substantial body of work. See Bloom, Sadun, and Van Reenen (2012). Bloom and Van Reenen (2007) find measures of managerial practice are strongly associated with firm-level productivity, profitability, Tobin’s Q, sales growth, and survival rates. They calculate that product market competition and family firms account for about half of the gap in management practices between the United States and France and one-third of the gap between the United States and the United Kingdom.