
Superstar Firms, Knowledge Transfer, and Labor Income Share
Industrial revolutions are characterized by investment and depreciation of tangible and intangible capital that embodies new and legacy technology whose ability to add value is dependent on creative destruction across business organizations, worker cohorts, and governments as new products and services are launched, new business models are created, and existing business processes are transformed.
In this chapter, two critical features of industrial revolutions are examined—(1) knowledge transfers and absorptive capacity and (2) changing capital and labor income shares with a shifting income distribution. Both differ fundamentally over the course of each industrial revolution and define the dynamics of systemic change. In the installation period of each industrial revolution, high productivity, leading-edge firms absorb knowledge effectively and find new applications for the new technology, resulting in market share gains, increased industry concentration, and reduced labor expense as a percent of revenue. Income is skewed toward capital owners and away from labor. The high productivity, leading-edge firms are labeled superstar firms. But the star-lit nature of the leaders implies there are laggards. This chapter considers, in detail, the laggards and the opportunities they offer for productivity improvement as productivity performance is highly variable and widely disbursed across industry firms. While the determinants of productivity are unsettled, worker engagement has received less than needed attention, especially in a services-driven economy. So, the chapter explores the contribution of workers to productivity growth and the conditions under which labor effort is automated and, conversely, where capital—principally technology capital—augments workers’ efforts.
Recall that the trend in nonresidential tangible and nontangible investment growth slowed from 4 percent in 1967 to less than 2 percent in 2009 with only a short-lived bump during the 2000 dot.com bubble. Nonetheless, incomes continued to grow, most notably for those with great wealth and high incomes. Figure 4.1 shows the trend in nonresidential investment growth and the share of incomes of those in the top 1 percent as a percentage of total national income. After reaching a peak of 22 percent in the early 1940s, the income share of the top 1 percent of earners fell over the entire deployment period of the Third Industrial Revolution. As incomes grew, incomes of lower wage earners grew more rapidly than those at the top, resulting in a fall of the income share of the top 1 to 10 percent by the late 1970s. However, as growth slowed and real wages began to stagnate, the income of the top 1 percent began a 30-year march upward, continuing to 2010 and reaching 20 percent. The recent plateauing of high earners income share, if it is to be a peak, remains slightly below its previous 1920’s peak.
Income and wealth protection is not limited to the last quarter of the 20th century. It’s an innate human instinct. It happens that the data are now more readily available (see Appendix C). With stagnate real growth and income and wealth protection, the distribution of income has returned to proportions last realized in the 1920s and 1930s.
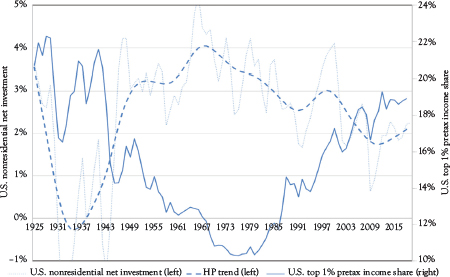
Figure 4.1 U.S. nonresidential investment as a percent of capital and U.S. top 1 percent pretax income share
Source: See Figure 2.3 and Saez and Zuckman (2020).
With legacy capital embodying the previous era’s mature technology and generating high income, the capital stock begins to experience increased deprecation, which over time slows its productive capacity and value creation. Simultaneously, a new technology appears that is, initially, expensive and limited in application. As the technology develops, costs decline, applications broaden, and the promise of income-generating opportunities expand with creative destruction showing the early signs of the transformation to follow. Nonetheless, excessive optimism inflates asset values that are corrected in a protracted global financial crisis.
In the aftermath of the crisis, cleansed balance sheets and available cash are positioned to invest in the now mature and inexpensive new technology with the replacement of then-aged tangible and intangible capital. However, even more intense creative destruction produces fundamental change, establishing a new order, cutting across labor and product markets with widespread adoption of new business models, processes, products, and services. Because such deep and profound change is resisted by entrenched interests—wealth holders, business organizations, workers, and governments—often major external events such as wars, depressions, and pandemics are required to cause new social and economic regimes to emerge. However, if creative destruction and the ensuing regime transformation are successful, robust output and productivity growth are expected in a low inflation environment.
If such broad-based macroeconomic benefits are to be realized, the move through an industrial revolution requires knowledge transfer (see Coyle 2021). The early technology and business model transformation leaders—for example, Facebook, Amazon, Apple, and Google—see their experience and knowledge transferred to newly launched firms and to productivity lagging firms. The rewards that these early leaders and their workers have reaped are shared with those who follow.
Knowledge Diffusion and Absorptive Capacity
If organizations are to fully benefit from the renewal of tangible and intangible capital, an ability to absorb knowledge is critical. Industry productivity leaders, by their nature and organizational culture, understand how to learn, transform, and grow. The absorptive capacity of organizations and the rate of knowledge diffusion—“two sides of the same coin”—depend on the nature and extent of capital and labor interaction. The diffusion of knowledge only creates economic value if organizations have the ability to absorb such knowledge and create productive improvements. Indeed, successful creative destruction—launching innovation, creating new firms, and finding new job roles—requires knowledge diffusion and absorptive capacity.
Cohen and Levinthal (1990), in a classic paper, define absorptive capacity as the ability of a firm to recognize the value of new, external information, assimilate such information, and create economic value. Importantly, innovative capabilities are a function of prior related knowledge and diversity, making the absorptive capacity path dependent with investment in tangible and intangible capital necessary for future success (see also Bessen 2015).
Using cross-sectional survey data on technological opportunities and appropriability conditions, Cohen and Levinthal model firm-level investment in research and development (R&D). The dependent variable is R&D intensity, defined as company-financed business-unit R&D expenditures as a percentage of business unit sales and transfers over the period 1975 through 1977. Technological opportunity is assessed with what are considered two critical sources of such opportunity—the science base of the industry and extra-industry sources of knowledge.1
Cohen and Levinthal’s findings point to the importance of the interaction between knowledge appropriability and the industry four-firm concentration ratio over the period of their data. Industry knowledge was more easily captured or shared when a larger proportion of industry sales were concentrated among the largest industry players. In addition, the percentage of an industry’s tangible capital installed within the preceding five years was positive and significant in the model. Industry leading firms who had recent experience growing their tangible and intangible capital were more likely to invest in new knowledge.
These findings suggest that when learning is difficult, an increase in the relevance and quantity of knowledge has a more positive effect on industry R&D intensity and absorptive capacity. Cohen and Levinthal suggest that under such circumstances, basic science is more important than applied science with targeted knowledge important in support of absorptive capacity. The importance of knowledge originating from universities exceeds that from government labs, which, in turn, is greater than that for material suppliers, which exceeds that for equipment suppliers.
As shown by Cohen and Levinthal, knowledge diffusion is required for knowledge absorption. Akcigit and Ates (2021) explore a theoretical and empirical treatment of a decline in knowledge diffusion between productivity leading and laggard firms in the 1980–2010 period. They suggest that a decline in knowledge diffusion emanating from productivity-leading firms implies higher markups and profits as well as a labor income share decrease. The dominant force is the shift to more concentrated sectors—consistent with Cohen–Levinthal findings—where more productive firms thrive with fewer workers. While the Akcigit and Ates (2021) model does not directly speak to the observed decline in the firm entry rate, the increase in market concentration implies that new entrants are likely to compete against dominant market players, which would discourage firm creation and knowledge diffusion.
Bessen and Nuvolari (2016) consider knowledge sharing from a historic perspective. They cite the work of Robert Allen as an illustration. Allen (1983) writes that the pig iron industry of Cleveland, UK, in 1850 to 1870—the deployment period of the First Industrial Revolution—observed “free exchange of information about new techniques and plant designs.” The knowledge exchange encouraged innovation building on previous advances. Bessen and Nuvolari conclude that knowledge sharing was not rare or marginal. Important technologies at the center of industrialization, such as steam engines, iron and steel production, steamboats, and textile production, were developed as a result of a collective effort.
Figure 4.2 expands the Akcigit and Ates view of business establishment formation from 1980 to 2010 to 1948 to 2018. After an increasing business formation rate from 1960 to 1978, the figure shows a decline in business formation from 1980 to 2010, similar to the decline shown in Figure 7 in the research by Akcigit and Ates (2021).
The 1948–1980 period approximately coincides with the years that have been identified as the deployment period of the Third Industrial Revolution. With the fossil-fuel, mass production era having reached maturity and tangible and intangible capital in a period of rapid accumulation, including government sector infrastructure and intellectual capital, business formation began a period of rapid increase. Interestingly, more than a decade was required for the formation rate improvement to begin. By the later portion of the period, business formation accelerated to a very high rate. Once underway, the formation rate remained elevated for three decades.
By contrast, the 1980–2018 period approximately aligns with the installation period of the Fourth Industrial Revolution. With the aging capital of the previous period and the nascent technology of the new electronics and IT era, business formation slowed. As Akcigit and Ates suggest, industry concentration increased. The leadership of IBM in the computer industry and later by Intel, Corp. in the semiconductor industry are examples of concentration in the newly formed technology industry. Eventually, of course, newly formed highly innovative industries, such as keyword search, social media, and browser software, also showed new business formation and high concentration.

Figure 4.2 U.S. net business establishment formation rate
Source: Historic Data Colonial Times to Present, Part 2, Business Enterprise, Series V 20–30 Business Formation and Business Failures 1857 to 1970; Statistical Abstract, Various Issues, 1980–1990; and U.S. Census Bureau, 2018 Business Dynamics Statistics 1979–2018.
Akcigit and Ates suggest that declining knowledge diffusion from productivity-leading firms results in a labor income share decrease with more productive firms thriving with fewer workers. The labor share decrease implies higher markups and profits along with a shift to more concentrated sectors.
The decline of labor’s income share across the industrialized economies is, by now, well-known and well-documented.2 As is also well-known, it was long understood that labor income was a constant share of GDP. Kaldor (1961) famously cited the stability of labor’s early 20th century income share as a “stylized fact.” The post-1980 fall in the U.S. labor income share, shown in Figure 4.3, has eliminated stable labor income share as a fact. Autor et al. (2020) find that labor’s income share fall is “real and significant” and not a result of mismeasurement. Autor et al. also assert that the cause of the share decline is not as a result of “rapid declines in quality-adjusted equipment prices, especially of information and communication technologies,” “social norms and labor market institutions, such as unions and the real value of the minimum wage” and “trade and international outsourcing.”3
Autor et al. analyze U.S. Economic Census data for six large sectors over three decades: 1982 to 2012.4 The covered employment makes up approximately 80 percent of U.S. employment and GDP with data for 676 industries of which 388 are in the manufacturing sector. They also draw on the 2012 release of the EU KLEMS database to measure international trends in the labor share and augment the measurement of the labor share in the U.S. Economic Census.

Figure 4.3 U.S. domestic income real factor income
Source: U.S. Bureau of Economic Analysis. National Income and Product Accounts. Table 1.13. National income by sector, legal form of organization, and type of income goods, rows 4, 5, 6, and 7 with author’s calculations.
At the detailed industry level, Autor et al. find there has been a “rise in sales concentration … across the vast bulk of the U.S. private sector, reflecting the increased specialization of leading firms on core competencies” (p. 650). Autor et al. label the industry-leading, high-productivity firms as “superstar firms,” calling to mind the current small set of well-known technology firms. However, their data cover 676 four-digit industries, suggesting that the phenomena are widespread across industry sectors.
The industries that have become more concentrated are those with faster productivity growth. Each industry’s productivity-leading firms—superstar firms—are not only more innovative but also are larger firms and getting larger while realizing higher markups. As a result, those industries with increased product market concentration, more rapid productivity growth, and enhanced innovation have experienced larger declines in the labor share. Innovation combined with economies of scale has reduced labor expense as a percent of revenue. Because labor shares tend to be lower in larger firms, reallocation of market share to larger firms has tended to depress aggregate labor share.
Importantly, Autor et al. also show that the share declines are largely due to the reallocation of sales and value added between firms rather than a fall in the labor share for the average firm. The reallocation-driven fall in the labor share is most pronounced in the industries exhibiting the largest increase in sales concentration. These same patterns are also present in other OECD countries.
To the extent that the advent of new technology increases automation, lowers marginal costs, and increases markups, labor’s income share rises at the firm level among productivity-leading firms. When “market toughness” increases—as defined by lower marginal cost—an aggregate labor income share decline requires between-firm reallocation—the shift of market share to more productive firms.
Finally, Autor et al. observe that a high level of concentration does not necessarily mean persistent dominance. In the spirit of creative destruction, one dominant firm could quickly replace another. If incumbents are more likely to innovate than entrants, incumbency could create advantages for firms with a high market share. Conversely, dominant but complacent firms could be replaced by more eager entrants. Rising industry concentration among productivity-leading firms is more prevalent in industries with quicker technology adoption and more rapid total factor productivity (TFP) growth. As has been experienced in the 1982–2021 period, the result is a reallocation of output toward high productivity and low labor share firms.
Shifting capital and labor income shares were also a dynamic element in the early industrial revolutions. Allen (2009) identifies “Engels’ Pause” as the period that aligns with the First Industrial Revolution’s installation period in which UK technology innovations revolutionized industries with Britain’s income shares remaining relatively constant, as is expected in the installation period of each industrial revolution.
Acemoglu (2002) argues that technological change in the late 18th and early 19th centuries may have been biased toward unskilled labor. Increased demand for those unskilled workers in the new factory system was the product of the “invention of a new method of invention.” Consequently, there was a large migration of unskilled workers to English cities and a large increase in population.5 Despite the bias toward unskilled labor and the expectation that wages would rise as a result, the increased labor supply put downward pressure on wages.
Both Allen (2009) and Crafts (2021a) simulate counterfactuals that eliminate the population explosion. Both find the population shocks undermined the First Industrial Revolution’s potential to raise real wages. Because labor’s income share is the product of the average wage rate, labor force participation, and population, migrating workers add to the available workforce, independent of population growth. Increased participation of unskilled labor can hold labor’s share constant, while the average wage rate is declining. Appendix D considers “Engels’ Pause” in more detail.
While industrial revolutions are characterized by investment and depreciation in tangible and intangible capital, it is also characterized by differential knowledge diffusion and changes in labor income share. The high-productivity firms—superstar firms—with leading-edge capabilities are able to capture the early benefits of the new technology in the industrial revolution’s installation period, resulting in declining labor income share as has been seen in the recent three decades. Lagging firms wait until the new technology is less expensive, well understood, and the extent and nature of the necessary creative destruction are clear in the deployment period.
As the deployment period progresses and knowledge diffusion is more readily available with increased absorptive capacity on the part of recipients, a broader cross-section of industry firms are able to (1) adopt the new technology, (2) creatively destruct their existing business models and processes, (3) innovate with lessons learned from industry leaders, and (4) profitably invest in new tangible and intangible capital. With such widespread adoption, macroeconomic benefits are likely with more rapid output and productivity growth and low inflation.
With superstar firms benefiting from innovation and strong productivity growth, the question is around the reason productivity lagging-firms lag. Profit and income opportunities are lost because of the inability to innovate, deploy technology, and transform. Presumably, there is an absence of both management and technical skill as well as the profit and income motivation to risk the attempt at transformation. However, history suggests the transformation eventually occurs. The issue for lagging firms is what are the considerations and forces that ultimately lead to the transformation and regime switching moving in the deployment era.
Persistent Productivity Differences
The existence of superstar firms as shown by Autor et al. follows a growing body of research and scholarship that has established “enormous and persistent productivity differences across producers even within naturally defined industries” (Syverson 2011). These differences are not fleeting with higher productivity firms more likely to survive over long periods (Foster, Haltiwanger, and Syverson 2008). While such persistence is often attributed to technological diffusion, the literature is quite clear that productivity differentials appear to be the result of investments in intangible capital—the business know-how embodied in capabilities across organizations.
Over the past decade, the developed-world productivity growth slowdown has been especially pronounced in the United States and the United Kingdom. Table 4.1 shows the well-recognized slowing across major regions with the sharpest falloff in the Anglo-Saxon nations. However, the aggregate-level productivity slowdown hides the slowdown even among the most productive, superstar firms and the deterioration of creative destruction and resource reallocation (Andrews, Criscuolo, and Gal 2016). As can be seen in Figure 4.4, not only is value added per worker growing more slowly in both the manufacturing and the services sector laggard firms, but growth has also slowed among the frontier firms. Even among more productive U.S. firms, Akcigit and Ates (2020) find that resource reallocation has been slowing since the 1980s with the slowdown even more striking since the 2000s.
While determinants of productivity at the firm level remain unsettled, much is known about a broad set of influences. Building on a growing body of work, Bloom, Brynjolfsson, Foster, Jarmin, Patnaik, Saporta, and Van Reenen (2019) find enormous dispersion of management practices across plants, with 40 percent of the variation across plants within the same firm. Management practices account for more than 20 percent of the productivity variation with a similar, or greater, percentage attributed to R&D, information and communications technology (ICT), or human capital. Two key drivers of improved management are right-to-work laws and learning spillovers.
Talent and human resource management, more generally, have also been shown to impact productivity. Mas (2008) shows the resale values of equipment made at plants and times where Caterpillar was experiencing labor strife during the 1990s, compared to otherwise identical products made at plants or times without unrest, had about 5 percent lower resale values. The productivity impact due to the implied reduction in the equipment’s quality-adjusted service flows totaled $400 million.
Table 4.1 Developed economies labor productivity
Labor Productivity Annual Growth | ||
| 1998–2010 | 2011–2017 |
UK | 1.5% | 0.3% |
United States | 2.3% | 0.4% |
EU11 | 1.1% | 0.8% |
Japan | 1.2% | 1.0% |
Source: World KLEMS Data, Release 2019. LP1_G Growth rate of value added per hour worked, %, log.
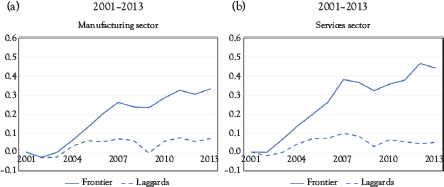
Figure 4.4 Value added per worker
Source: Andrews, Criscuolo, and Gal (2016).
Establishing causality for the role of talent and management practices remains a difficult issue. To explore the issue, Bloom, Eifert, Mahajan, McKenzie, and Roberts (2013) conducted a randomized field experiment with management consulting provided to a random set of Indian firms. Comparing productivity growth in the treatment group to a control group not receiving consulting support, average productivity rose by 11 percent and decentralized decision making increased, as did the use of ICT.
ICT also has a role to play in gaining a productivity advantage. van Ark, O’Mahony, and Timmer (2008) show the European Union’s sluggish productivity growth compared with that of the United States during the late 1990s and early 2000s can be explained in large part by the later emergence and smaller size of ICT investment across European economies. Bloom, Sadun, and Van Reenen (2012) show U.S.-based multinationals operating in the European Union are more productive than their EU counterparts with evidence pointing to a complementarity between ICT capital and human resources practices, explaining U.S. multinationals’ productivity advantage in the European Union.
Brynjolfsson, McAfee, Sorell, and Zhu (2008) provide case studies where ICT enhances the speed with which firms replicate practices across lines of business. Firms that successfully innovate are able to leverage productivity advantage, quickly displace less productive competitors, and increase the volatility of the performance of all firms.
Productivity divergence and the existence of superstar firms, by implication, suggest there are productivity laggards—those at the bottom of the productivity distribution, as shown in Figure 4.4. Berlingieri, Calligaris, Criscuolo, and Verlhac (2020) explore lagging firms across 13 OECD nations—Australia, Belgium, Canada, Denmark, Finland, France, Hungary, Ireland, Italy, Norway, Portugal, Sweden, and Switzerland—with a novel data set covering the period 1995 to 2014. Lagging firms are defined as those in the bottom 40 percent in each nation’s productivity distribution.
Berlingieri et al. are careful to point out that these low-productivity firms should not all be considered zombie firms. While there are some among the laggards who would typically exit a competitive market and would be considered zombies, there are also (1) SMEs who are likely to remain small and have limited scope for productivity improvement, for example dry cleaners, hair salons, fitness centers; (2) firms hit by temporary negative productivity shocks, for example extreme weather events; and (3) new entrants operating below their productivity potential in the early years of development—for example venture capital-funded firms. These bottom two-fifths, as measured by labor productivity, represent a nonnegligible 31 percent of employment, but only 12 percent of value added, and 14 percent of gross output.
Among the bottom quarter of these lagging firms (i.e., the bottom 10 percent of each nation’s productivity distribution), entry and exit plays an important role. Not surprisingly, exiting firms are less productive than surviving firms, while entrants are also less productive than survivors. With firms exiting their disappearance makes the most important positive contribution to productivity improvement among the bottom 10 percent. Among this bottom cohort, reallocation of employment and other resource to new and surviving firms matters most for productivity realization. For the remainder of the laggards (i.e., 10–40 percent of the productivity distribution), entry and exit are minor factors. The most significant contribution is from the typical surviving firm.
While productivity-lagging firms make a small contribution to productivity growth, if productivity improvement is possible, aggregate productivity gains could be substantial. A counterfactual simulation exercise by Berlingieri et al. finds remarkable potential gains from pushing the laggards to the median aggregate productivity level. Aggregate productivity would increase by 2 percent by raising the productivity of the bottom 10 percent to the median and by an even larger 6 percent if those in the 10 to 40 productivity cohorts increased to the median level. So, while resource reallocation is critical for meaningful productivity improvement, incenting and helping the typical surviving, but currently productivity lagging, firm improvement is just as important. There is tension between resource reallocation and resulting productivity improvement from firms that should exit and improvement from lagging but surviving firms. In the United States, aggregate productivity growth in the retail sector seems to be almost exclusively from new businesses, not from the improvement at surviving firms (Foster, Haltiwanger, and Krizan 2001).
Importantly, Berlingieri et al. look at the relationship between laggards’ productivity growth and their distance to their industries superstar firms—the top 10 percent of the productivity distribution—which they define as the productivity gap. They find a positive relationship between the productivity gap and productivity growth of laggards, indicating that firms that are further behind realize higher productivity growth rates. Also, younger laggards catch up to the productivity leaders faster. However, the speed of catch-up has decreased over time.
Berlingieri et al. find that the laggards are catching up at a slower speed in industries using digital technologies and digital skills more intensively, as well as in industries with higher general skill levels. These weak catch-up rates suggest obstacles to the transfer of technology and knowledge might also be a cause of the increase in productivity dispersion. The digital transformation and the increased importance of knowledge appear to have raised barriers to diffusion. Laggards are lagging because they lack the necessary absorptive capacity and do not face the necessary profit and income incentives and pressures to transform. As Landes (1969) observes, among British business leaders in the First Industrial Revolution, many lagging firms appear to misunderstand that the rules of the game have changed. With both demand and supply conditions changing, the leaders of many lagging firms assume that current and past conditions will continue and fail to see the risk ahead.
Worker Contribution to Productivity Gains
With productivity divergence and the existence of superstar firms, the global productivity slowdown reflects deterioration in productivity at the sector and industry levels. As Table 4.2 shows, across the developed economies, service providers deliver 70 percent or more of value creation. Consequently, productivity improvement is highly dependent on the performance of the services sector.
Andrews, Criscuolo, and Gal (2016) use harmonized cross-country data from 24 countries to show that among the top 5 percent of services sector firms—superstar firms—in each two-digit industry, labor productivity growth between 2001 and 2013 rose at an annual rate of 3.6 percent compared to just 0.4 percent for all remaining firms—laggards. Information services firms show an even more pronounced gap between superstar firms and productivity laggards. In addition, TFP—controlling for capital deepening and mark-up behavior—shows a similar divergence, which is even more pronounced for information services firms. In the manufacturing sector, over the same period and across the same set of national economies, the superstar firms have also become relatively more productive, but at a somewhat slower rate. The manufacturing sector superstar firm productivity increased at an average annual rate of 2.8 percent compared to annual productivity gains of just 0.6 percent for lagging firms.
Heskett, Sasser, and Schlesinger (2015) summarize a substantial, four-decades body of work detailing the economics of service delivery. Leading services firms focus on factors that drive profitability, including workforce investment, the technology supporting customer-facing workers, recruiting and worker training practices, and compensation linked to performance for employees at every level.
Table 4.2 Developed economies services sector value added
Services Sector Value Added % of Total | ||
| 1997 | 2018 |
UK | 72.2% | 79.7% |
United States | 74.6% | 79.8% |
EU11 | 68.8% | 73.4% |
Japan | 64.3% | 69.6% |
Source: National Accounts of OECD Countries.
Above-average productivity growth is achieved with high rates of repeat business that generate high-profit margins, requiring strong customer loyalty and sustained customer relationships. The important insight is that customer loyalty is earned with high internal service quality achieved with a focus on job and workplace design, employee selection and development, employee rewards and recognition, and the technology employees utilize to serve customers. The skill, quality, and satisfaction of the workforce, often referred to as worker engagement, is a critical element of service success. As a result, the economics of services requires innovative measurement.
While the economics of manufacturing has a much longer and more robust history with a much larger body of data in support, Betti, de Boer, and Giraud (2020) identify four recent business process transformations that 54 high-productivity manufacturing firms have successfully completed. These organizations have prioritized workforce development and engagement, transforming the nature of work through upskilling or reskilling with new ways of working.
Betti et al. find the gap between superstar manufacturing firms and others reflects four focus areas:
• Agility and customer centricity across end-to-end manufacturing and supply chains to facilitate faster recognition of customer preferences.
• Supply-chain resilience providing competitive advantage and requiring connected, reconfigurable n-tier supply ecosystems and regionalization.
• Speed and productivity attained through increased levels of automation and workforce augmentation coupled with upskilling and reskilling efforts.
• Environmental and global warming efficiency considered a requirement to remain in business and ensure compliance with an increasingly complex regulatory landscape.
A substantial literature shows the empirical link between worker engagement, customer loyalty, and profitability, especially for services sector firms (Allas and Schaninger 2020). Worker engagement is worker’s involvement, satisfaction, and enthusiasm for a job role. As shown in Table 4.3, worker satisfaction also appears to contribute directly to shareholder value.
Recent research by Bellet, de Neve, and Ward (2020) exploits a natural experiment to provide evidence on the relationship between employee happiness and productivity. The happiness of British Telecom call center workers is measured over a six-month period using a novel weekly survey instrument and administrative data on workplace behaviors and measures of employee performance.
Exploiting exogenous variation in employee happiness arising from weather shocks local to each of the 11 UK call centers, including Canterbury, Turo, Swansea, Dundee, and Lancaster, a strong causal effect of worker happiness on sales is found. The effect is driven by employees working more effectively on the intensive margin by making more calls per hour, adhering more closely to their work schedule, and converting more calls into sales. No effect was found on the extensive margin on various high-frequency labor supply measures such as attendance and break-taking. Workers’ weekly sales increased by 25 percent when their happiness increased by one point on a scale of one to five.
Using a regression discontinuity design, Ruffini (2020) shows that higher wages paid to low-income care-home workers increase the service quality provided to patients. A 10-percent increase in the minimum wage raises low-skilled care-home workers’ earnings by 1 to 2 percent, reduces employee separations, and increases stable hires. These earnings’ gains and the implied increase in firm-specific human capital translate into marked improvements in patient health and safety.
Table 4.3 Employee satisfaction and company performance, including shareholder value
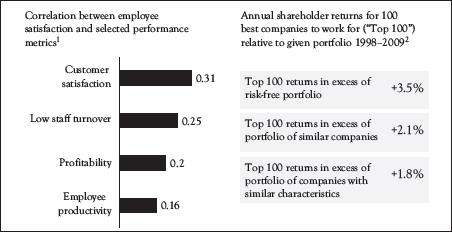
1Meta-analysis combining observations from >1.8 million employees and 82,000 business units.
2Risk adjusted; based on list compiled by Fortune for the United States.
Source: Allas and Schaninger (2020).
Across the United States, the minimum wage increase for care-home workers would prevent at least 15,000 deaths, lower the number of inspection violations by 1 to 2 percent, and reduce the cost of preventable care. Firms are able to fully offset higher labor costs by attracting patients with a greater ability to pay and increasing prices for these residents, resulting in no significant change in profitability. Considering costs elsewhere in the health system, savings from pressure ulcer treatment alone offset up to half the increased wage bill. If the social value of increased longevity for care-home residents is at least $21,000—well below existing estimates—higher wages are fully offset by improvements in care.
Kaur, Mullainathan, Oh, and Schilbach (2021) show that increasing cash-on-hand among poor Indian workers raised productivity. Asserting that financial concerns led to worry and stress, interfering with the ability to work effectively, a field experiment in a piece-rate manufacturing environment was conducted. The timing of piece-rate payments was randomized such that on a given day some workers had more cash-on-hand than others. Wages and piece rates, as well as human and physical capital, were held constant.
On days on which payment is received, average productivity increased by 6.2 percent and mistakes declined, with the increase concentrated among relatively poorer workers. Faster work with fewer errors suggests improved cognition. Kaur, Mullainathan, Oh, and Schilbach (2021) assert that with the alleviation of financial concerns, workers were more attentive and productive at work.
Gilchrist, Luca, and Malhotra (2016) find higher wages elicit reciprocity and led to increased productivity. In a field experiment with data entry contract workers engaged through an online labor market platform with its largest share of workers from India, higher wages, per se, in a context of no future employment commitment, did not have a discernible effect on productivity. However, structuring a portion of the wage as a clear and unexpected gift—offering a wage increase with no additional conditions after the employee accepted the contract—did lead to higher productivity for the duration of the job. Gifts were roughly as efficient as hiring more workers.6
Bryl (2018) finds companies with greater human capital orientation—higher salaries and benefits, more training, a transformational leadership style, and better equipment—perform better than their peers with less human capital-orientated strategy. Among 7,204 publicly listed U.S. companies, those listed as the “100 Best Companies to Work” provided superior performance. Over 2007 to 2017, a human capital orientation strategy provided high profitability and above-average financial performance with stronger equity growth and higher market valuation.
Harter, Hayes, and Schmidt (2002) conduct a large-scale meta-analysis and find that business units with top-quartile employee engagement achieved operating-profit margins that were 1 to 4 percentage points higher than those in the bottom quartile.
Finally, consistent with the importance of worker engagement, especially in the services sector, Berlingieri, Calligaris, and Criscuolo (2018) find that wages increase with productivity in both the manufacturing and the nonfinancial market services sectors. However, the correlation between wages and productivity is much stronger in the services sector, suggesting there is a measurable productivity-wage premium in the services sector.
Reversing Labor Income Share Decline
With technology embodied in capital investment, perhaps the most critical issue is whether capital investment and technological change substitute or complement the effort of human automation versus augmentation. Acemoglu (2002) and Acemoglu (2020) provides a framework to assess the direction of change, for example, whether technological change benefits all workers, specific worker groups, or the owners of capital. The direction and bias of changing technology are an endogenous response to expected profit opportunities.7
In the 1945–1975 period, the Third Industrial Revolution’s deployment period, U.S. real GDP growth averaged 4 percent per year and U.S. labor productivity grew 2.6 percent per year. In the 1975–2010 period, the Fourth Industrial Revolution’s installation period, real GDP grew
2.9 percent per year and labor productivity grew at 2 percent per year with little growth after 2000. With semiconductor, electronics, information, and communications technology in a nascent stage during the 1975–2010 installation period, early automation of standard business processes was found with the new technology only beginning to display signs of future potential. Business model innovation, fundamentally new management practices, and new products and services only began to appear at the end of the period (see McAfee and Brynjolfsson 2017).
The hypothesis is that as the nature of economic activity evolves from the deployment era to the installation era, regime switching occurs with labor moving from complementary to substitutability. As activity continues to evolve from the installation era to the next deployment era, regime switching occurs—again—workers’ effort, which were substituted with capital equipment, are now complementary to capital equipment in the deployment period. During the installation period, diminishing services provided by an aging capital stock coincides with emerging, innovative technology. After a disruptive major global financial crisis results in a transition of management practices and business models, the resulting regime switch impacts labor markets, just as it does other markets, resulting in moving labor from substituting to complementing capital.
Empirically, Allen (2009) identified “Engel’s Pause” during the First Industrial Revolution as a period when British income shares remained relatively constant. More recently, the Third Industrial Revolution’s deployment period and the Fourth Industrial Revolution’s installation period saw a labor income share reversal.
Another view of regime switching from capital and labor complementary to substitutability can be seen in the study by Acemoglu and Restrepo (2019). Acemoglu and Restrepo use a task-based framework to identify where and how labor appears to complement the deployment of new technology and where automation appears to substitute for labor in the automation of tasks. Acemoglu and Restrepo write:
New technologies not only increase the productivity of capital and labor at tasks they currently perform, but also impact the allocation of tasks to these factors of production—what we call the task content of production. Shifts in the task content of production can have major effects for how labor demand changes as well as for productivity.
A productivity effect results from increased value added created by automation while also displacing labor from automated tasks—a displacement effect in which labor and capital are gross substitutes. When the displacement effect exceeds the productivity effect, labor and capital are gross substitutes and labor share falls.
However, new technology can also create new tasks, expanding the tasks in which labor possesses a comparative advantage. The new tasks reinstate labor, improve productivity as new tasks exploit labor’s comparative advantage, and increase labor demand. Capital and labor are gross complements.
Acemoglu and Restrepo explore the evolution of U.S. labor demand in the post-1945 era. During the 1947–1987 period, rapid growth exploiting a then-mature technology increased labor demand, complementing the deployment of capital and the wage bill per capita growing by 2.5 percent per year.8 While on balance, changes in the task content of production were nearly zero percent, there was substantial displacement and reinstatement. Between 1947 and 1987, the displacement effect reduced labor demand by about 0.48 percent per year, while the reinstatement effect increased labor demand by 0.47 percent per year. As predicted in a deployment period, automation proceeded at pace and the introduction of new technology was accompanied by widespread task transformation, counterbalancing the adverse labor demand consequences of automation.
In the 1987–2017 period, the per capita wage bill grew by 1.33 percent per year over the period with little growth after 2000. The 1.2 percentage point slowdown in wage bill growth is in part accounted for by slower productivity growth that fell to 1.54 percent per year.
Slower wage bill growth resulted from a significant negative shift in the task content of production against labor. The change in task content was driven by an acceleration of displacing labor, reducing labor demand by 0.70 percent per year compared to 0.48 percent in the 1947–1987 period and a deceleration in the introduction of technologies reinstating labor, increasing labor demand only by 0.35 percent per year compared to 0.47 percent in the 1947–1987 period. Together, changes in the task content of production reduced labor demand by 10 percent over the period.
The shift from substitutability to complementary capital and labor, alongside the shift from automation to augmentation, impacts income distribution as shown in Figures 4.1 and 4.3. While automation occurs continuously, when conditions are ripe in the deployment period, increased aggregate demand, new task creation, and labor augmentation can reverse rising income inequality.
1 The relevance of 11 basic and applied fields of science and the importance of external sources of knowledge to technological progress in a line of business are included. Intra-industry R&D spillovers are represented with six measures used by firms to capture and protect the competitive advantages. These measures include patents to prevent duplication, patents to secure royalty income, secrecy, lead time, movement down the learning curve, and complementary sales and service efforts. A subset of these measures enter the model appropriately signed and are significantly different from zero.
2 See Autor, Dorn, Katz, Patterson, and Van Reenen (2020) for an empirical review of labor shares across 12 OECD and a literature review of the fall in labor share.
3 Autor et al. do not find manufacturing industries with greater exposure to trade shocks lose labor share relative to other manufacturing industries, but observe employment declines in such industries. They also find a decline in labor’s share in nontraded sectors, such as wholesale trade, retail trade, and utilities.
4 The six sectors are manufacturing, retail trade, wholesale trade, services, utilities and transportation, and finance.
5 From Chapter 3, the parable of Charles Dickens 1842 visit to Lowell, MA and his high praise for “the mills girls” also reflected the bias toward unskilled labor in the American textile industry.
6 Fisman and Luca (2021) cite three additional studies showing a positive relationship between wages and productivity.
7 The elasticity of substitution quantifies the relationship between labor’s income share and the capital–labor ratio. The elasticity of substitution measures the percentage change in the capital–labor ratio compared to the percentage change in the real wage–real interest rate ratio. Appendix E presents early evidence that the elasticity of substitution changes in the movement from the installation period to the deployment period.
8 The wage bill is divided by population, removing population growth as a confoundinginfluence.