

This chapter is about …
Completing the sales and budget forecasts for the illustration framework, setting necessary cash flow forecast adjustments, and adding charts, key indicators and ratios.
Note: All of the steps in this chapter have been completed in the downloaded spreadsheet Completed Illustration Framework.xls.
If you want to create Completed Illustration Framework.xls for yourself, make a copy of Chapter 6 Illustration Framework.xls, rename it as Completed Illustration Framework.xls and follow the steps in this chapter.
Making the sales forecast
In the case of Widget Makers Ltd there are only two products to consider – Widgets Mk1 and Widgets Mk2. All that is needed are entries for each product in each month of the sales forecast’s span: one year.
Entering the figures only takes a few minutes of course but what is more important is the experience and expertise of the company’s managers and salesforce, and the many factors that they have to take into account.
Spreadsheet forecasts and budgets enable us to instantly test the financial impact of any sales profile that may be imagined. And this can have the most profound effect on the way in which forecasting is carried out and sales targets are set. For instance, the individual and overall impact on profitability of various product sales volumes can be quickly tested, and this may result in a radically different sales policy and strategy compared with that based on minimal testing, or indeed wholly gut feeling.
All of this suggests that the forecasting process is one of reiteration, rather than a single run through from start to finish, and in fact, that is the case throughout. When we look at monitoring and reviewing later on we will see that these are also a process of reiteration.

Monitoring, comparing, reviewing and reforecasting are the essential and most prominent features of budget forecasts. It is worth repeating the truism that ‘there is only one certainty in a forecast – it is wrong’, and all concerned need to continually compare it with actual performance and refine it for the best possible accuracy.
The figures that we are about to enter should thus be considered a first stab at the forecast: it will almost certainly be modified several times once the rest of the budget is finalised and its effect seen.
Let’s assume that at least all of the following have been taken into account in deciding the first shot at the sales volumes for the year:
- economic factors;
- factors affecting the industry sector;
- seasonal factors;
- the company’s growth policy;
- capital investment plans;
- marketing strategy plans;
- production capability;
- financing arrangements;
- market sector competition.
And having considered them, we decide to first of all see how a flat profile will look, based on the average sales for each product for the previous year:
Average sales/month – Widgets Mk1: 200
Average sales/month – Widgets Mk2: 100.
The pricing policy must also be decided; should we increase, decrease or maintain the previous year’s prices. Many of the sales volume factors above will also have a bearing on the pricing decision, and as for sales volumes, the process of reiteration will be used before finalising it.
Let’s assume that Widgets Mk1 is the longer established of the two products, has less facility than Widgets Mk2, and is cheaper to produce. The selling price for the first run through the budget will be:
Sales price per unit of Widgets Mk1 : £275.00
Sales price per unit of Widgets Mk2 : £400.00.
These figures can now be entered on the Sales Forecast tab of the spreadsheet and the completed sales forecast is shown in Figure 7.1.
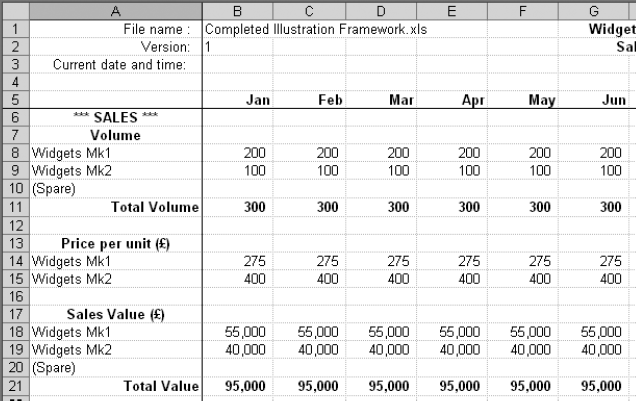
Figure 7.1 The completed sales forecast (Jan–June)
Right, that’s the sales forecast done; now we’ll move on to the budget.
Making the budget forecast
Bearing in mind that the process of making a budget is one of reiteration, should all of the costs be put in at this stage, or only those that affect trading profitability, and then add non-trading expenditure like capital and start up later? It really doesn’t matter at all, because it’s so easy to change things around, add and remove costs or alter prices and volumes as much as you want.
For Widget Makers Ltd we’ll put everything in to start with, and see how the budget and cash flow look before considering changes. Figure 7.2 shows the budget spreadsheet after entry of all of the figures.
It doesn’t matter in what order cost decisions and entries into the spreadsheet are made, but we’ll take them as they appear on the budget forecast model, in cost category order.
The detail of the entries given for each heading below are repeated in a summary for the whole budget at the end of the section.
Capital costs
These are items of expenditure that have a realisable value – they are assets of the company.
Factory machinery
A new widget manufacturing machine will be bought in March at a cost of £50,000. The new machine will enable widget production volumes to increase without the need for additional production staff once it has been brought into service in September. Until then, monthly production volumes cannot increase more than 10 per cent above those in January at the start of the year. Enter:
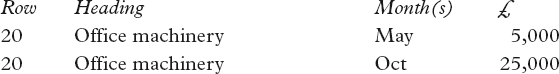
Office machinery
A replacement photocopier is needed, and will be bought in May at a cost of £5,000. In October a new computer system will be installed that will enable administration costs to be contained in the following years as the business grows. Enter:
Start up costs
These are ‘one-off’ items of expenditure incurred solely through the development or introduction of a new product.
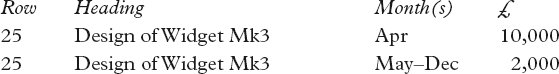
Design of Widget Mk3
In this case a new widget, the Mk3, is being developed. There is an initial cost of £10,000 for engineering design consultancy in April, then a monthly design development cost of £2,000 for the remainder of the year. Enter:
Variable direct costs/item
These are the costs per widget, which are multiplied by the widget volumes, to generate the variable direct costs. Remember that you put the formulae that carry out this calculation into the spreadsheet in Chapter 6.
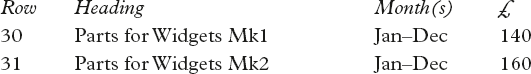
Parts for widgets
For now, you can assume a constant cost of parts throughout the year, although it’s possible that a change may have to be made later on. The cost of parts for Widgets Mk2 are higher than those for Mk1. Enter:
Diesel fuel (Deliveries)
This is the fuel used by the vehicles delivering widgets to customers. In a new business the cost per widget would at this stage be an estimate, but in an established business you can easily derive the figure by dividing the previous year’s total cost of diesel fuel by the number of widgets delivered during that year. Remember this is per widget.
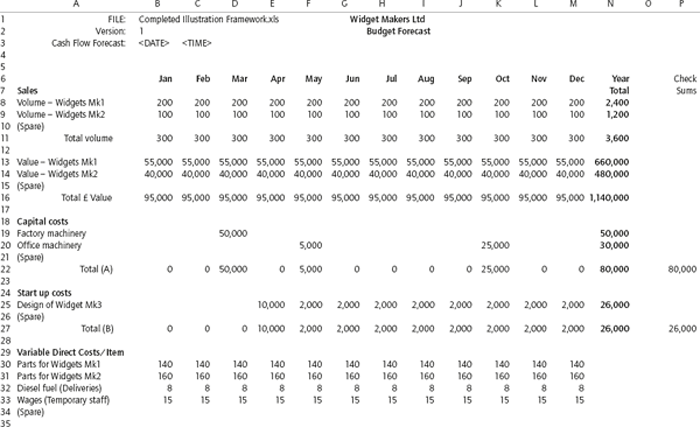
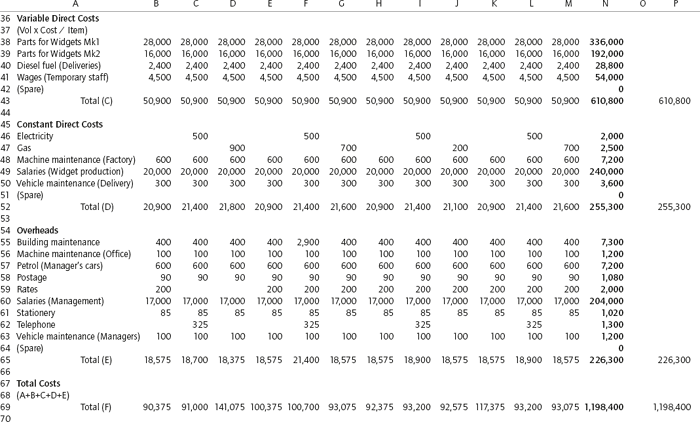
Figure 7.2 The completed budget forecast
Wages (Temporary staff)
These wages are for temporary staff taken on as and when required to assist with widget packing and delivery. Again, for a new business the figure per widget will be an estimate, or in an established business, calculated by dividing the previous year’s total cost of temporary staff’s wages by the widget volumes for that year. Remember this is per widget.
Enter:
Constant direct costs
These are the costs directly associated with the products, but not immediately affected by normal fluctuations in volume.
Electricity
This is used for lighting and machinery operation. Although the amount used is somewhat dependent upon production volumes, the swing is not that significant, and a value based on the annual production volumes is good enough for the purpose of the budget. Enter:
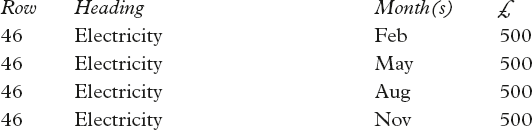
Note: It would be normal to show utility costs as an average amount for each month, especially where there is no significant seasonal variation, i.e. £2,000/12. But showing them quarterly here is useful for illustrative purposes.
Gas
Used predominantly for factory heating, the quarterly bills reflect seasonal requirements. Enter:
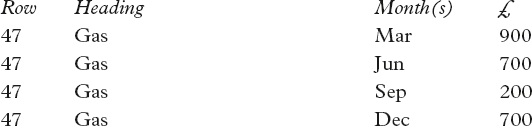
Note: Again it would be normal to show utility costs as an average amount for each month, in this case using a third of each quarter’s figure per month, but showing them quarterly here is useful for illustrative purposes.
Machine maintenance (Factory)
The factory machines are routinely maintained under a contract covering both parts and labour. The contract terms require a monthly payment. Enter:
Salaries (Widget production)
These are the salaries of all full-time staff directly involved in widget production. Enter:
Vehicle maintenance (Delivery)
Although regular mileage services can be forecast to specific months, there are also irregular breakdowns to allow for. One way of handling any expense where the value can be anticipated, but the ‘when’ is unknown, is to derive an annual figure and spread it evenly through the year. Then, each month when actual expenditure is monitored, you can either move forward any ‘unused’ portion of the figure to the next month, or once again spread it over what remains of the year. Using this method, enter:
Overhead costs
These are all trading costs not directly related to a product, and which are also neither capital nor start up.
Building maintenance
This consists principally of factory and office cleaning which is invoiced monthly but, in addition, external painting will be carried out in the early summer. Enter:
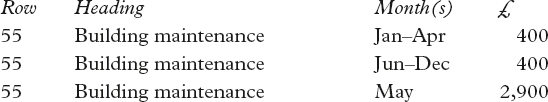
Put the May figures in as =400 + 2500 to act as a reminder that there are two components to the cost.
Machine maintenance (Office)
Photocopiers, computers and fax machines are all maintained under a maintenance contract that covers parts and labour for a monthly premium. Enter:
Petrol (Managers’ cars)
Although there will obviously be fluctuations in this expense from month to month, they are very difficult to predict, and in any case are small compared with the total overheads. An annual spread of the year’s total forecast expenditure on petrol is, therefore, fine. Enter:
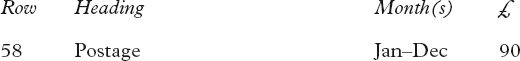
Postage
Like most other general administration costs, fluctuations in monthly costs are comparatively inconsequential and the year’s forecast total may be spread throughout the year. Enter:
Rates
Business rates are usually paid monthly for 10 months of the year, from April to January inclusive. Enter:
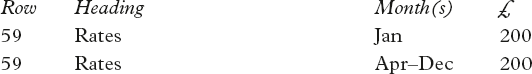
Note: It would be normal to show rates as an average amount for each month, but showing them over 10 months is useful for cash forecasting purposes.
Salaries (Management)
These are the salaries of managers and staff not directly involved in production. They include all additional costs such as National Insurance and pension contributions, although you may want to separately identify those components, as would also be the case for other extras such as bonus and productivity payments. Enter:
Stationery
For the same reasons as for postage, an even spread of the forecast annual cost is fine. Enter:
Telephone
The telephone bill is paid quarterly, and although there are minor seasonal fluctuations, the year’s forecast split equally into four payments is fine for our needs. Enter:
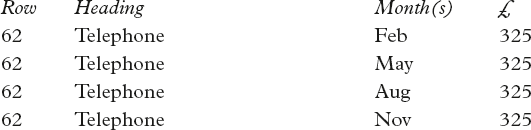
Note: It would be normal to show telephone and similar costs as an average amount for each month, but showing them here quarterly is useful for illustrative purposes.
Vehicle maintenance (Managers)
In exactly the same way as for the delivery vehicle maintenance, an estimate of the total annual cost spread throughout the year is fine, so long as any unsent ‘allocation’ is rolled on from month to month. Enter:
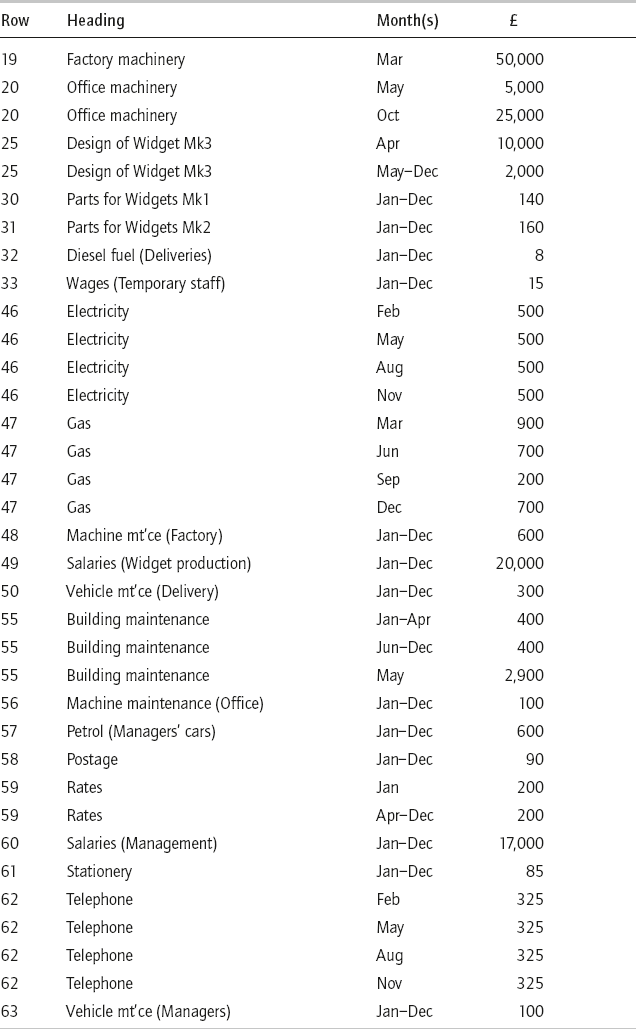
And that completes the data entry for the budget forecast. A summary table of all of them can be found in Table 7.1.
Cash flow forecast adjustments
The cash flow forecast is fully automatic in the sense that all of its data is drawn from the budget forecast. But because in the example there are no forecasts for the previous or following year, and because of the offsets that have been built into it, there are some gaps in the cash flow for January and December.
This can of course also happen in real forecasts; when, for instance, the first computer-based forecast is constructed, there will be no figures for the previous year. We need a way to deal with that situation, so that we maintain a forecast close to reality, without having to continually check and intervene.
Table 7.1 Summary of all budget data entries
A simple solution is to pick up the figures in the adjacent month, so that when they are changed during the reiterative process of forecasting, the dummy figures will also change. We might have to modify this principle if significant differences in adjacent months are expected for the heading in question. In the case of Widget Makers Ltd, the adjacent month method will work well enough for illustrative purposes.
The gaps, as the cash flow forecast currently stands, are:
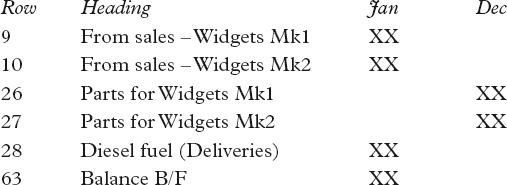
With the exception of the bank Balance B/F, which I’ve just invented for illustrative purposes, we need to link the others to their adjacent months. So, put these links and Balance B/F figure into the cash forecast:
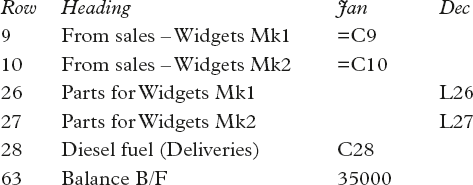
Figure 7.3 (pages 162–3) shows how the cash flow forecast looks now.
Charts and key indicators
One of the more obvious features of the complete budget layout in Figure 7.2, and the cash flow layout in Figure 7.3, is that they both have a lot of numbers! You’ll find that you have to study them for quite a while – especially the cash flow – to get an understanding of what’s going on. More significantly, once changes start to be made, and different scenarios are being tested, it really isn’t possible to absorb all of the relevant effects that are necessary for an overall view.
We have two main ways of overcoming this difficulty, charts and key indicators. With both of them, most advantage is obtained by minimising the amount of information presented, and ensuring that it is strictly appropriate to the view you are after. Both methods are extremely quick and easy to set up, and while there are a number of ‘standard’ charts and key indicators that you’ll want to retain in your spreadsheet, others will only be set up temporarily for a specific purpose. These you can discard once the job is done.

A key indicator is simply highlighting a feature of special interest. For example, when considering a plan for capital investment you may have to determine its effect on cash flow for a variety of proposals: will borrowing be necessary, if so, how much and when?
To see key indicators on the cash flow, scan along the closing balance row and find the lowest figure for each proposal. Have a quick look for the minimum balance on Figure 7.3.
A ‘minimum balance’ key indicator makes it much easier to immediately see the effect of different proposals. Here are examples of two ways of providing them:
- In B70, use the MINimum function like this:
=MIN(B66.M66)
- In row 67, column B, use this function:
=IF(B66=$B$70),"Min","")
and copy to December. This will compare the minimum value obtained above with each month’s closing balance, and display Min where they are the same.
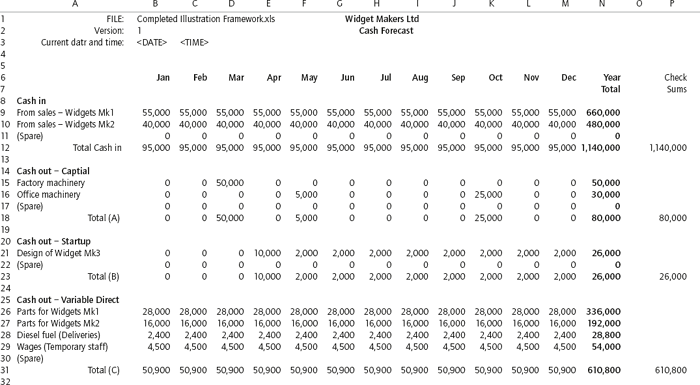
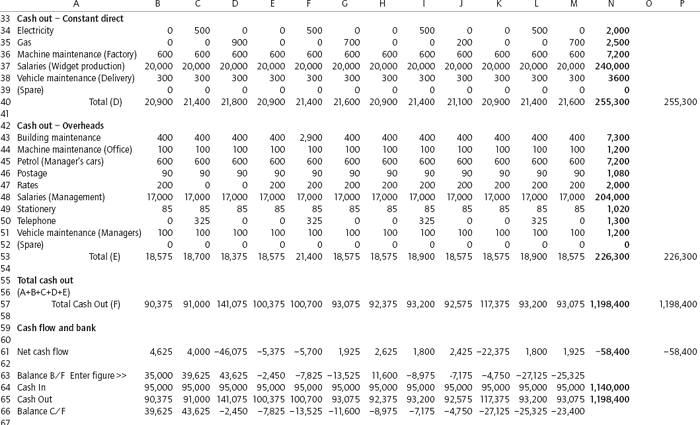
Figure 7.3 The completed cash flow forecast
The result of both of these is shown in Figure 7.4, which is part of the cash forecast. The minimum balance is shown at B70 (it could of course be put anywhere on the spreadsheet), and ‘Min’ is displayed in row 68 below where the minimum occurs.
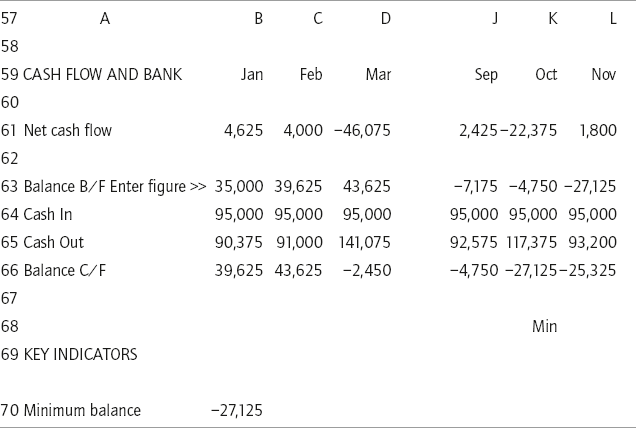
Figure 7.4 Minimum balance key indicator
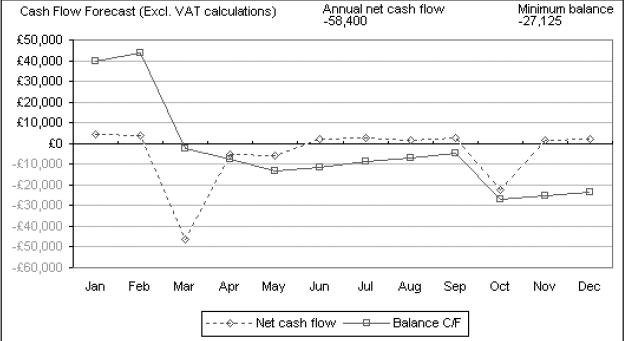
Charts are most useful for displaying trends and comparisons, but be careful not to put too much information on one chart, or it will become as difficult to interpret as rows of figures. Sometimes it’s also useful to include a key indicator on a chart.
Figure 7.5, which is a chart at the bottom of the cash flow spreadsheet, shows the closing balance and net cash flow for each month graphically. It also displays the minimum closing bank balance as a figure at the top right, and the annual net cash flow at the top centre.
Key ratios
A key ratio is usually the result of one figure divided by another, but the term can be used for any arithmetic operation carried out on a number of figures to produce a single meaningful result.
For example, monthly sales can be divided by the number of people employed to give £ Sales per employee, usually written as:
£ Sales/Employee
Or net profit divided by widget sales volumes, gives:
£ Net Profit/Widget
Direct cost/sale
Direct costs/direct employee
Direct costs/total costs
Gross profit/employee
Gross profit/sale
Net profit/employee
Net profit/sale
Overhead cost/sale
Overhead costs/employee
Overhead costs/direct costs
Overhead costs/total costs
Sales/direct employee
Total cost/sale
Key ratios may also be presented as percentage values, for example:
- Gross profit as a percentage of sales
- Net profit as a percentage of sales.
You might find percentage values easier to relate to than the raw ratio figure.
Averages can also provide figures that will help to isolate and highlight significant features of a company’s budget. They are most useful for smoothing the peaks and troughs that would otherwise obscure a clear view of performance trends. For example:
- average cash flow;
- average variable direct costs;
- average sales;
- average total cost;
- average overheads.
Charts, key indicators, key ratios, percentages and averages are the basic analytical tools of the budget forecaster’s trade. But they should only be used when necessary, often for a specific task, after which you can discard them. It is very easy to create large numbers of diverse analytical figures and ratios on a spreadsheet, but if there are too many, their significance is likely to be lost; instead of clarifying the spreadsheet, it will become even harder to interpret.
Summary
In this chapter we have:
- entered the first estimates of sales and budget forecast figures into the spreadsheet models;
- looked at the rationale behind how costs have been spread;
- adjusted the cash flow forecast with ‘intelligent dummy’ figures to generate a meaningful view of the year;
- seen the use of charts and key indicators;
- learned that key ratios and other analytical tools and figures provide valuable insight, but only if used sparingly and with caution.
The complete illustration framework is now assembled and is ready for closer examination and any necessary adjustments – the reiteration process.
Note: The downloaded version of the completed framework is the file ‘Completed Illustration Framework.xls’.