
3
Development of the BIM Model
3.1. Introduction
Several fields such as indoor navigation, cadastre, construction engineering, building management and energy efficiency require accurate and detailed 3D models of buildings. Other applications require, in addition, the consideration of the interactions between the building and its geographical environment. This is the case for real estate expertise, urban management and the broader concept of smart cities. Between these applications, the differences lie in the requirements in geometric and semantic precision and in the level of detail of the digital models.
With the concept of smart cities and the multiplicity of sustainable development applications, urban digital models must be rich enough to encapsulate several uses and respond to several urban issues. In addition to geometry, the semantics of the models are of major importance, allowing them to be used as real tools for urban management.
Many 3D modeling approaches have been proposed during the past few decades. However, despite the progress made in computer vision, photogrammetry and LiDAR technologies, the automatic reconstruction of 3D urban scenes is still a very active field of research, and some technical challenges still need to be solved.
This chapter presents the basis for the production of a BIM model and the main approaches developed for the 3D reconstruction of its objects, in particular, buildings.
3.2. Issues around 3D urban models
In the field of Earth sciences, a “geospatial” model is used to refer to models attached to the Earth’s surface. In its digital version, a model is a structure assembling several types of data: geometric and semantic that can be maintained and managed by a computer to perform a number of actions that can benefit from machine intelligence. A model does not only contain a collection of data and information, but also includes a number of implicit and/or explicit relationships, allowing the management of interactions between objects in a coherent and integrated way.
3D urban models are designed to respond to urban issues and help the various stakeholders in the decision-making process. These models are supposed to respond to several uses without representing the whole reality. The quality of a 3D model is hence evaluated in terms of its purpose and the forms of its use (Abdul-Rahman and Pilouk 2007).
Beyond the visualization aspect, urban models cover a number of uses and must be designed for intelligent management of the city and implementation of sustainable development actions, hence the need to opt for geometrically and semantically rich digital models that integrate the interrelationships between the different urban components. The literature review by Biljecki et al. (2015) identifies at least 29 uses and a hundred applications around 3D urban models, ranging from simple visualizations to more complex analytical systems. The applications either concern one of the components of the urban space (infrastructures and networks, buildings, land and cadastral parcels, etc.) or integrate several components into a single urban application. An example of this is a real estate appraisal, whose current research integrates indoor (BIM) and outdoor (CIM) aspects to study the impact of internal and external parameters on the real estate value of a property (El Yamani et al. 2019).
3.3. Semantics of 3D urban models
Several urban models have been developed in the literature to address a wide range of applications. The 3D urban models differ in the amount and granularity of geometric information represented, and in the adopted data structures. Due to the diversity of uses, the semantics of 3D urban models has been the subject of numerous works and publications. Virtual city models, used for urban planning, can be semantically enriched by methods of integration of several data sources (Döllner and Hagedorn 2007). Several approaches have been proposed for the semantization of 3D urban models. In particular, the extraction of semantics from 2D models, maps and MNTs, and the integration of data from several sources for the management of urban spaces.
The need to integrate city semantics into urban models was among the motivations behind the adoption of the CityGML standard (Kolbe 2009). Indeed, CityGML proposes a rich data model, allowing the integration of several urban themes around a geometric core model, in order to perform spatial and thematic analysis tasks. CityGML defines five levels of detail for buildings, ranging from the representation of the footprint (LoD0) to the representation of its detailed architecture containing internal elements, such as rooms and equipment (LoD4). By moving from one level of detail to a higher level, the representation is refined not only by increasing the geometric complexity, but also by the semantic richness. On the other hand, the AEC domain has developed the IFC standard, which proposes a very rich geometric and semantic architecture for the intelligent management of a building, covering all its structural and functional components.
The interconnection between several urban models allows for a better representation of reality and planning according to a global approach (Métral et al. 2009). With the integration of CityGML and IFC standards, digital mock-ups are extended to multi-scale applications, taking advantage of the richness of building modeling provided by IFC and the richness of their urban space provided by CityGML within the same application. However, this integration poses interoperability problems that have yet to be resolved.
3.4. From the point cloud to the 3D model
The sources of 3D data are numerous and continue to develop. However, lasergrammetry is well suited to the development of BIM models at the building scale and large urban scale (multi-scale BIM), while considering other sources such as photogrammetry, RGB-D sensors and tacheometric methods, which often remain as complementary methods.
3.4.1 Point cloud processing chain
With the evolution of lasergrammetry scanning technologies, point clouds are a potential source for the production of digital models. The point cloud has certain characteristics such as density, presence of noise, occlusions, etc., that must be taken into account in the processing.
The essential steps in the process leading from the cloud to a BIM model can be broken down into four phases: (1) consolidation and/or georeferencing; (2) pre-processing; (3) segmentation/classification; and (4) modeling (Figure 3.1).

Figure 3.1. Processing chain from a point cloud to a 3D model. For a color version of this figure, see www.iste.co.uk/hajji/BIM.zip
3.4.1.1. Consolidation and georeferencing
Point cloud registration begins with a consolidation step (also called 3D registration) to assign correspondences between two sets of points. This consolidation is done by identifying homologous points in the various clouds to be consolidated, which can either be targets or homologous geometric entities (planes, spheres, cylinders), or on the basis of specific algorithms such as the DARCES method: Data-Aligned Rigidity-Constrained Exhaustive Search based on RANSAC (RANdom SAmple Consensus) and ICP (Iterative Closest Point) (Landes et al. 2011).
To be able to link a point cloud to a national geographic reference frame, indirect georeferencing is required. In this case, topographic techniques such as tacheometry or GNSS surveys are used to link the clouds to the base geographic reference frame. As an alternative to this indirect solution, some scanners allow direct georeferencing on site through a polygonal path scan (Figure 3.2).
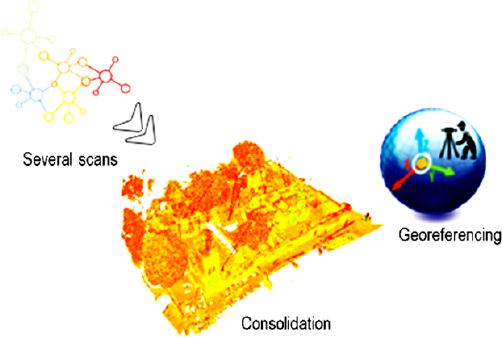
Figure 3.2. Consolidation and georeferencing of a point cloud. For a color version of this figure, see www.iste.co.uk/hajji/BIM.zip
3.4.1.2. Pre-treatment
Once the various point clouds have been assembled in the same frame and the results of the consolidation have been validated, a point cloud cleaning step is necessary to eliminate undesirable points that add noise to the measurements (Figure 3.3). This step is either done manually by using the tools available in point cloud processing software, or automatically using filters that allow the removal of isolated points based on the distance from their surroundings.
Cleaning can also be done with machine learning-based algorithms such as PointCleanNet (Rakotosaona and Polytechnique 2019). More recently, a part of this operation can be done by acquiring two scans one after the other to minimize the effect of objects moving during the survey (the double scan).
At the end of the pre-processing, the point cloud is consolidated, cleaned and sometimes georeferenced. It can then enter a process of segmentation and modeling to produce a BIM model.
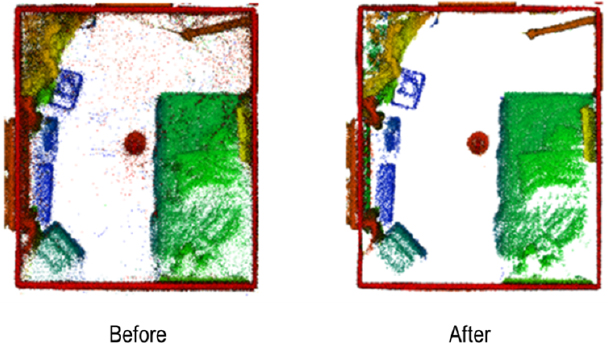
Figure 3.3. Pre-processing of point clouds by cleaning. For a color version of this figure, see www.iste.co.uk/hajji/BIM.zip
3.4.1.3. Segmentation
The 3D reconstruction of urban models from LiDAR data involves two fundamental steps: (1) segmentation and (2) 3D modeling of the resulting classes.
Segmentation is based on the homogeneous characteristics of the scene data with respect to a certain number of criteria in order to separate them into several regions (Deveau 2006). It involves decomposing a cloud into subsets based on similarity or dissimilarity criteria, (Figure 3.4). In the case of point clouds, the 3D position of points, curvature or flatness are criteria that are considered in the segmentation process (Boulaassal 2010). Other criteria concern geometric, spectral, semantic characteristics, etc.
The process of segmentation is well known in the field of image processing. The segmentation algorithms were originally developed and applied to images. Their extension to the case of point clouds by airborne LiDAR is argued by the fact that airborne LiDAR acquisitions are of the 2.5D type, and their transformation into images does not cause a loss of consistent information that could alter their accuracy. However, in the case of terrestrial LiDAR, the scene is acquired in 3D. Hence, the need to adapt the models and algorithms to take into account the 3D character of the scene.
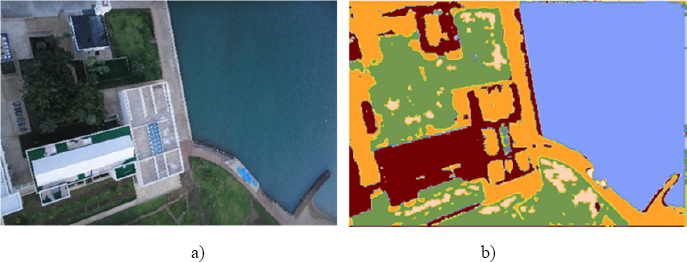
Figure 3.4. The principle of segmentation. For a color version of this figure, see www.iste.co.uk/hajji/BIM.zip
Segmentation approaches
Many segmentation approaches are reported in the literature with several classifications. A first classification allows the following main families of methods to be distinguished: (1) edge-based segmentation; (2) region growing segmentation; (3) model fitting segmentation; and (4) machine learning segmentation (Figure 3.5). A summary of these approaches was provided by Grilli et al. (2017).
Another classification classifies LiDAR data segmentation methods into three main families of approaches: (1) direct approaches based on the raw point cloud; (2) derived approaches based on a cloud-derived product; and (3) hybrid approaches combining several data sources (LiDAR, aerial images, 2D maps, etc.). A state of the art on these different approaches is reported by Ballouch et al. (2020).
The segmentation approaches developed in the literature are based on LiDAR data acquired from several platforms and concern both the interior and exterior of the building.
In the case of airborne LiDAR, we cite the example of Tarsha-Kurdi et al. (2008), who developed a semi-automated approach for the segmentation of point clouds on an urban scene, where a first distinction between the ground and aboveground is made through the generation of an DSM (Digital Surface Model) (Figure 3.6), and then an extraction of buildings from the ground segment is conducted by adopting a region growth algorithm.
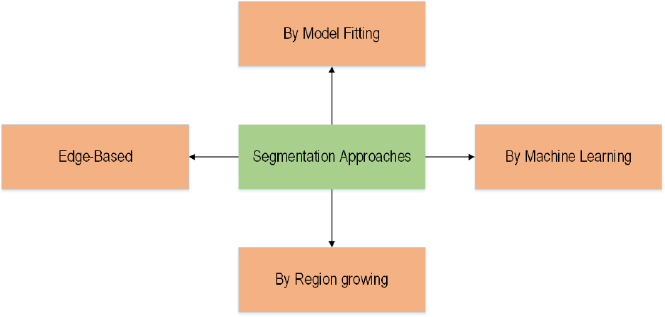
Figure 3.5. Segmentation approaches
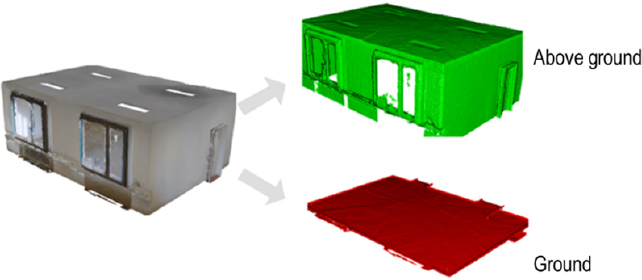
Figure 3.6. Ground/above ground segmentation. For a color version of this figure, see www.iste.co.uk/hajji/BIM.zip
In the case of terrestrial LiDAR, Boulaassal (2010) proposes a semi-automatic segmentation of building facades surveyed by a static terrestrial scanner. The planar segments corresponding to the building facades are extracted by the RANSAC algorithm, which has demonstrated its robustness, even in the presence of outliers in the point cloud.
For the case of indoor acquisitions, Anand et al. (2011) propose a segmentation approach based on the use of contextual data, such as local visual appearance, shape cues and geometric relationships, to semantically segment point clouds of building interiors.
Advances in segmentation methods are more notable in the image mode than in the point cloud mode, given the time lag in the development of the two acquisition methods. Thus, several studies attempt to exploit image-based approaches by projecting the point cloud onto images. One approach, proposed by Tabkha et al. (2019), uses the 360° panoramic image based on cylindrical projections to transform a point cloud into images and apply image-based segmentation processes to them.
Semantic segmentation (classification)
When the cloud segmentation approach is not controlled by prior knowledge, the segmentation results lack semantic information (Xie et al. 2019). Once the segmentation process is accomplished, each cluster of points can be semantically augmented by associating a semantic label with it. This is a semantization of the clouds that occurs after the segmentation process. This process is called semantic segmentation. Semantic segmentation is known as classification in the field of photogrammetry and remote sensing.
In computer vision, semantic segmentation is based on subdividing a point cloud into parts with a semantic assignment by associating semantic labels with each class (Lawin et al. 2017) (Figure 3.7). Semantic segmentation of 3D point clouds is a major challenge for understanding and extracting knowledge from urban scenes. This is one of the major challenges in the field of computer vision (Ballouch et al. 2020).

Figure 3.7. Semantic segmentation/classification of a scene. For a color version of this figure, see www.iste.co.uk/hajji/BIM.zip
Semantic segmentation approaches are distinguished into: (1) supervised approaches; (2) unsupervised approaches; and (3) interactive approaches. Supervised approaches use data sets or training models for semantic classification of the cloud. These approaches require massive training data to train the classification model. Unsupervised approaches are automatic methods based on user parameterization of the classification algorithm and can lead to imprecise results, while interactive approaches require user intervention to guide the segmentation process (Grilli et al. 2017).
Today, deep learning methods and Convolutional Neural Networks (CNN) allow us to solve many problems related to the thematic exploitation of massive point clouds (image classification and analysis, real-time object detection on videos, semantic segmentation, Natural Language Processing (NLP), audio recognition, etc.). The term Deep Learning (DL) refers to the training of neural networks. It is one of the most important forms of artificial intelligence derived from machine learning, whose basic architecture is inspired by the biological processes of connections between neurons in the brain, assembled together.
The advantage of a CNN is the preservation of the spatial information of the visual data, and also the considerable decrease of the weight and bias parameters, which allows a faster execution and more accurate predictions. The algorithm mainly relies on the detection of features (boundaries, shapes, texture, etc.) in the images through filters based on the convolution operation.
Several semantic segmentation approaches based on DL have been developed in the literature. A state of the art of these approaches is reported in Ballouch et al. (2020).
3.4.2 Geometric modeling
To overcome the limitations of traditional geometric representations, BIM offers an integrated data model that models both the elements of the building and the relationships between them. The BIM model centralizes all information about the building and/or other urban objects. This information includes geometric aspects concerning the elements of the model, as well as semantic aspects which can relate to different themes.
The BIM model adopts a parametric object-oriented modeling where each object of the model has a geometric definition and encapsulates parameters and functions. The scan-to-BIM process allows us to produce the model from a laser scan through a 3D reconstruction approach. The development of automatic approaches for the scan-to-BIM process is a very active research area.
3.4.2.1. Geometric modeling methods
3D geometric modeling methods are distinguished by the type of geometric primitives used and the relations of the combination adopted to associate them, in order to build a 3D shape. Their choice depends on the intended application: some models are efficient for 3D visualization, others perform well in spatial analysis and 3D simulation applications.
Many 3D geometric models have been proposed in the literature. A first classification of 3D modeling methods by Li (1994) distinguishes the methods into two main categories: (1) surface methods when the object is reconstructed based on surface primitives and (2) volume methods when the object is reconstructed based on solids. Another category classifies the models into: (1) models based on geometric primitives; (2) mesh models; and (3) hybrid models.
Surface methods
The main surface methods are: 2D grid mode, triangulations, NURBS (Non-Uniform Rational B-Splines) methods, B-REP (Boundary Representation) method, etc.
NURBS and B-Rep methods are well suited for modeling buildings and other urban objects. NURBS modeling is based on curves that are defined by control points and constraints imposed on a curve through a precise mathematical definition. The B-Rep method is a boundary-based modeling that describes a 3D shape by the surfaces composing its boundaries: nodes, edges and knots. This method integrates an implicit topological representation.
Volume methods
In this category of methods, we find the CSG (Constructive Solid Geometry) method, the SPR (Spatial Partitioning Representation) method, Primitive Instancing (PI), etc.
The CSG model is based on the combination of geometric primitives for the construction of complex objects through geometric transformations or Boolean operations (union, intersection, difference, etc.). This allows the construction of a good number of urban objects with complex geometry. The SPR method decomposes an object into a set of juxtaposed elementary solids that do not intersect and that can vary in terms of types, sizes, positions, parameters and orientations. In this category, we find the voxel model, which consists of splitting a solid into elementary cubes, and the Octree model, which is an improvement of the “Voxel” model. Octrees allow us to represent objects by a hierarchical succession of cubes of variable sizes. The Octree model allows a hierarchical representation of the object which adapts to a display at different resolutions.
The “Primitive Instancing” method uses complex parameterizable primitives to represent a 3D scene, which are usually stored in an object library.
Mesh modeling
The 3D mesh is one of the most popular representations of 3D shapes. A 3D mesh structure describes the geometry and appearance of the objects it represents with an associated texture. It consists of a set of polygons called faces, described by a diagram showing the location and connectivity of their vertices. The objects can be easily recognized by the human eye, but cannot be distinguished by computer systems (Willenborg et al. 2018). 3D meshes can also be presented as graphically structured data where the nodes of the graph correspond to the vertices of the mesh and the edges represent the connectivity between these vertices. This mode is usually combined with the point cloud mode where the points of the cloud form the vertices of the triangles which are calculated mathematically, in most cases, by Delaunay triangulation. Thus, the mesh, bringing no additional information, remains more easily interpretable than a point cloud with a good visual rendering and a realistic visualization quality. The object format (OBJ) is one of the most popular 3D formats for storing and exchanging 3D mesh models that defines a geometry suitable for 3D modeling and computer graphics (Willenborg et al. 2018).
Parametric modeling
BIM modeling is based on the definition of object classes containing instances whose appearance changes based on parameters associated with the class (common parameters) or object (object-specific parameters), and also the relationships they undertake with other objects. This is the principle of parametric modeling, where representation is made based on parameters and rules that determine the geometric and non-geometric properties of objects (Eastman et al. 2011).
Parametric modeling consists of associating a set of parameters (qualitative and/or quantitative) with an object, that can easily be modified (Figure 3.8). This modeling defines the relationships between the components of an object, which can, for example, be represented by mathematical equations. The set of rules assigned to the objects allows them to be automatically updated following a change of context.
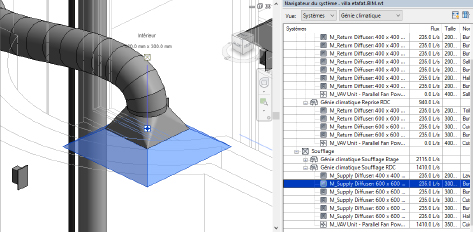
Figure 3.8. Parametric modeling of a BIM object. For a color version of this figure, see www.iste.co.uk/hajji/BIM.zip
With BIM tools, it is possible to create libraries of intelligent objects that can store and use information about the project. For example, a door, placed in a BIM model, is a simple assembly of lines and surfaces, but represents an object connected to a wall and contains information about materials, costs, suppliers, etc.
3.4.2.2. Selection criteria
The choice of a 3D geometric modeling must allow the representation of a large number of urban objects, a multi-level representation, a storage performance and a 3D spatial analysis (Koussa 2011). In addition, the adopted model must be able to be translated to the schema of a 3D standard, such as CityGML and IFC, to ensure interoperability of exchanges.
In the case of buildings, surface representations such as B-Rep and NURBS are the best known. The B-Rep method, by its intuitive character, allows us to cover a very large domain since most solids can be represented by surfaces. It is well adapted for multi-scale use and has a good topological potential. In terms of interoperability, it is compatible with the geometric primitives (Point, LineString, Polygon, MultiLineString, Multi Polygon, etc.) defined by the OGC specifications. In addition, the B-Rep method can allow 3D functions such as volume calculation in the case where the faces are oriented (Ramos 2003). However, the method is not very compact since the description of some objects requires a large number of surfaces to represent them.
In the urban environment, the use of hybrid methods combining the B-Rep method and other methods such as the CSG method allows the representation of buildings to be extended to model more complex geometries. Most of the methods use variants of hierarchical space partitioning structures, also called multi-resolution structures, such as k-d trees, octrees or quadtrees. Massive point clouds need to make use of suitable structures in order to optimize their management. One of the examples of these structures is the Modifiable Nested Octree (MNO).
3.5. 3D reconstruction of the BIM model
In this section, we focus on the 3D reconstruction of objects for a BIM model. We focus on recent developments in this area which are oriented towards the exploitation of point clouds from lasergrammetry or low-cost sensors for indoor reconstruction of buildings. We also refer to the reconstruction of multi-scale BIM models from large-scale acquisition techniques, such as drones or airborne LIDARs.
3.5.1 Scan-to-BIM process
3D scanning technologies have brought a very significant evolution to the methods of modeling geometric information and integrating it into a BIM model. The process of obtaining a BIM model from a point cloud (scan) is called “scan-to-BIM”. The point cloud resulting from a scan is the basis for the reconstruction of an “As-Built” BIM.
Currently, terrestrial lasergrammetry is a potential technique for the acquisition of large point clouds on buildings and other urban objects. The technique generates millions of points acquired in a short time with high resolution and geometric accuracy. Other mobile scanning techniques are also used in indoor (SLAM) or outdoor (MMS) environments. These optimize the acquisition time, but their quality is affected by the movement of the platform and thus present limitations in front of applications requiring high geometric accuracy (Thomson et al. 2013).
Currently, scan-to-BIM is a manual process conducted by “expert modelers” who rely on the point cloud to model the objects of the model (Bassier et al. 2020). The most common approach is to import the point cloud into a BIM modeling software (Revit, Bentley, Graphisoft, ArchiCAD, etc.) and create the model using the point cloud as a reference. However, this method is laborious, a source of errors and unsuitable for large projects generating large amounts of data, hence the interest of the research community in developing automatic approaches for the scan-to-BIM process.
The scan-to-BIM process is performed through several steps: segmentation, classification, clustering and finally, the creation of the model. The objects resulting from the segmentation/classification can then be converted into BIM objects by associating semantic descriptions with them (Figure 3.9).

Figure 3.9. Classification of a point cloud in an indoor environment. For a color version of this figure, see www.iste.co.uk/hajji/BIM.zip
The object modeling in a BIM model requires a preliminary step of segmentation and reconstruction of elements such as walls, openings (doors and windows), rooms, etc. This segmentation is practiced according to several approaches. The works in this context are interested in either the modeling of spaces or that of elements composing the building, such as walls (Macher et al. 2017).
3D space reconstruction
A simple but critical example of the difference between a geometric data model and a BIM model is the representation of the concept of space (Figure 3.10). This concept is not necessarily represented by a geometric definition stored in the model, but “space” in a BIM model has a semantic definition that relates to a domain and can be extracted by a simulation tool. This concept is used for certain applications such as energy simulations. Indeed, the open spaces that are required for the calculation of energy losses can be easily obtained from a BIM model.
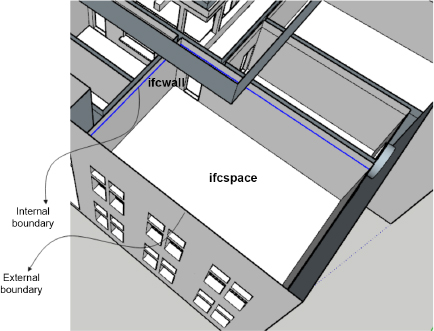
Figure 3.10. The notion of space in IFC. For a color version of this figure, see www.iste.co.uk/hajji/BIM.zip
Several approaches are developed to segment subspaces in a building. Some authors use histograms for a vertical segmentation of the point cloud (Macher et al. 2014). Díaz-Vilariño et al. (2015) use a histogram of point distribution along the Z-axis to identify the different floors of a building. Ochmann et al. (2014) propose a segmentation into rooms and a location of openings by determining the probability that each point has of belonging to a room. Mura et al. (2014) propose a modeling of rooms as polyhedra by starting with the location of walls and their projection in the X–Y plane, and then a decomposition into cells is performed by the intersection of lines.
Reconstruction of elements
Among the approaches that have been developed for wall segmentation, we mention the one proposed by Hong et al. (2015) that segments walls based on 2D raster image creation for the roofs and floors of the building. Wang et al. (2015) use machine learning methods and neural networks for wall segmentation. Thomson and Boehm (2015) propose an approach based on horizontal plane segmentation for floor/ceiling separation, followed by vertical plane segmentation for wall identification.
In the literature, several authors have developed semi-automatic or automatic approaches for BIM model reconstruction, including Xiong et al. (2013), Ochmann (2019) and Bassier et al. (2020). A review of the literature on scan-to-BIM automation techniques is reported by Tang et al. (2010) and Pătrăucean et al. (2015).
Recently, other authors such as Li et al. (2020) have addressed the use of low-cost sensors such as RGB-D cameras for automatic as-built BIM generation. Bassier et al. (2019) developed an unsupervised method for wall reconstruction from laser scans and the generation of BIM objects within Revit after the segmentation of the cloud by machine learning algorithms. However, very few works have exploited the radiometric values of the clouds. Notably, Zhan et al. (2009) propose a method of contour extraction based on the colorimetric differences in a point cloud colored from RGB information.
Research for BIM reconstruction approaches from point clouds is still relevant. However, the quality assessment of the generated models does not require the same order of interest by the researches. Only a few researchers have addressed the issue of model quality evaluation (Previtali et al. 2014; Tran et al. 2019). Recently, Bassier et al. (2020) proposed a comparison of the reconstructed objects to the initial point cloud in terms of LoA (Level of Accuracy) and LoD (Level of Development).
3.5.2 Scan versus BIM process
In contrast to the scan-to-BIM process, which transforms discrete information from a point cloud into modeled information in the form of BIM objects, scans can also be used to control a BIM model. Among the uses of scans versus BIM, we cite the superposition between periodic scans and the BIM model to calculate the progress of operations in relation to an existing schedule (BIM 4D) (Son et al. 2017), and to verify possible discrepancies through a geometric quality control, allowing us to control the progress of operations and take corrective measures in case of problems. Some software offer functionalities and plugins allowing a geometric registration of scans and a dimensional analysis that can be performed for a gap analysis between a scan, and a reference surface for the inspection of building facades, for example, or between several scans for a spatio-temporal analysis of movements of a structure.
3.6. Conclusion
Today, the production of 3D digital models, whether on a building scale (BIM model) or on a large scale (multi-scale BIM), is a major challenge in order to respond to several urban management and smart city development issues.
The point clouds produced from different sources offer an important database for the elaboration of digital models with high geometric and semantic accuracy. The scan-to-BIM processes still need to be developed to ensure sufficient automation in the production of models. Despite the developments, the semantization of point clouds is still a very active field of research that takes advantage of the development of DL algorithms.
3.7. References
Abdul-Rahman, A. and Pilouk, M. (2007). Spatial Data Modelling for 3D GIS. Springer Science & Business Media, Berlin.
Anand, A., Koppula, H.S., Joachims, T., Saxena, A. (2012). Contextually guided semantic labeling and search for three-dimensional point clouds. The International Journal of Robotics Research, 32(1), 19-34.
Ballouch, Z., Hajji, R., Ettarid, M. (2020). The contribution of deep learning to the semantic segmentation of 3D point-clouds in urban areas. 2020 IEEE International Conference of Moroccan Geomatics, IEEE, Morgeo, 1–6.
Bassier, M., Mattheuwsen, L., Vergauwen, M. (2019). Bim reconstruction: Automated procedural modeling from point cloud data. The International Archives of Photogrammetry, Remote Sensing and Spatial Information Sciences, 42, 53–60.
Bassier, M., Yousefzadeh, M., Vergauwen, M. (2020). Comparison of 2D and 3D wall reconstruction algorithms from point cloud data for as-built BIM. Journal of Information Technology in Construction, ITcon, 25(11), 173–192.
Biljecki, F., Stoter, J., Ledoux, H., Zlatanova, S., Çöltekin, A. (2015). Applications of 3D city models: State of the art review. ISPRS International Journal of Geo-Information, 4(4), 2842–2889.
Boulaassal, H. (2010). Segmentation et modélisation géométriques de façades de bâtiments à partir de relevés laser terrestres. Doctoral Dissertation, University of Strasbourg.
Deveau, M. (2006). Utilisation conjointe de données image et laser pour la segmentation et la modélisation 3D. Doctoral Dissertation, Paris Descartes University.
Díaz-Vilariño, L., Conde, B., Lagüela, S., Lorenzo, H. (2015). Automatic detection and segmentation of columns in as-built buildings from point clouds. Remote Sensing, 7(11), 15651–15667.
Döllner, J. and Hagedorn, B. (2007). Integrating urban GIS, CAD, and BIM data by service-based virtual 3D city-models. In 26th Urban and Regional Data Management: UDMS 2007 Annual, Rumor, M., Coors, V., Fendel, E.M., Zlatanova, S. (eds). Taylor & Francis Ltd., Stuttgart.
Eastman, C.M., Eastman, C., Teicholz, P., Sacks, R., Liston, K. (2011). BIM Handbook: A Guide to Building Information Modeling for Owners, Managers, Designers, Engineers and Contractors. John Wiley & Sons Inc, Hoboken, NJ.
El Yamani, S., Ettarid, M., Hajji, R. (2019). BIM potential for an enhanced real estate valuation approach based on the hedonic method [Online]. Available at: http://hdl.handle.net/2268/250013.
Grilli, E., Menna, F., Remondino, F. (2017). A review of point clouds segmentation and classification algorithms. Proceedings of the International Archives of the Photogrammetry, Remote Sensing and Spatial Information Sciences – ISPRS Archives, 42, 339–344.
Hong, S., Jung, J., Kim, S., Cho, H., Lee, J., Heo, J. (2015). Semi-automated approach to indoor mapping for 3D as-built building information modeling. Computers, Environment and Urban Systems, 51, 34–46.
Kolbe, T.H. (2009). Representing and exchanging 3D city models with CityGML. 3D Geo-Information Sciences. Springer, Berlin, Heidelberg.
Koussa, C. (2011). Implantation d’un système d’information géographique 3D sur Internet pour la gestion des modèles urbains. Doctoral Dissertation, University of Strasbourg.
Landes, T., Grussenmeyer, P., Boulaassal, H. (2011). Les principes fondamentaux de la lasergrammétrie terrestre : acquisition, traitement des données et applications, article XYZ (partie 2/2), 25–38.
Lawin, J.-L., Danelljan, M., Tosteberg, P., Bhat, G., Khan, F.S., Felsberg, M. (2017). Deep projective 3D semantic segmentation. In Computer Analysis of Images and Patterns: 17th International Conference, CAIP 2017, Felsberg, M., Heyden, A., Krüger, N. (eds). Springer, Cham.
Li, R. (1994). Data structures and application issues in 3-D geographic information systems. Geomatica, 48(3), 209–224.
Li, Y., Li, W., Tang, S., Darwish, W., Hu, Y., Chen, W. (2020). Automatic indoor as-built building information models generation by using low-cost RGB-D sensors. Sensors, 20(1), 293.
Macher, H., Landes, T., Grussenmeyer, P., Alby, E. (2014). Boundaries extraction from segmented point clouds as input for historical building information modelling. International Journal of Heritage in the Digital Era, 3(4), 669–682.
Macher, H., Landes, T., Grussenmeyer, P. (2017). From point clouds to building information models: 3D semi-automatic reconstruction of indoors of existing buildings. Applied Sciences, 7(10), 1030.
Métral, C., Falquet, G., Cutting-Decelle, A. (2009). Towards semantically enriched 3D city models: An ontology-based approach. International Archives of Photogrammetry, Remote Sensing and Spatial Information Sciences, 38, (Parts 3–4/C3) (on CD–ROM).
Mura, C., Mattausch, O., Villanueva, A.J., Gobbetti, E., Pajarola, R. (2014). Automatic room detection and reconstruction in cluttered indoor environments with complex room layouts. Computers & Graphics, 44, 20–32.
Ochmann, S.K. (2019). Automatic reconstruction of parametric, volumetric building models from 3D point clouds. Doctoral Dissertation, Universitäts-und Landesbibliothek Bonn.
Ochmann, S.K., Vock, R., Wessel, R., Tamke, M., Klein, R. (2014). Automatic generation of structural building descriptions from 3D point cloud scans. 2014 International Conference on Computer Graphics Theory and Applications (GRAPP), IEEE, 1–8.
Pătrăucean, V., Armeni, I., Nahangi, M., Yeung, J., Brilakis, I., Haas, C. (2015). State of research in automatic as-built modelling. Advanced Engineering Informatics, 29(2), 162–171.
Previtali, M., Scaioni, M., Barazzetti, L., Brumana, R. (2014). A flexible methodology for outdoor/indoor building reconstruction from occluded point clouds. ISPRS Annals of the Photogrammetry, Remote Sensing and Spatial Information Sciences, 2(3), 119.
Rakotosaona, M.J., La Barbera, V., Guerrero, P., Mitra, N.J., Ovsjanikov, M. (2020). PointCleanNet: Learning to denoise and remove outliers from dense point clouds. Computer Graphics Forum, 39(1), 185–203.
Ramos, F. (2003). Modélisation et validation d’un système d’information géographique 3D opérationnel. Doctoral Dissertation, Université de Marne-la-Vallée.
Son, H., Kim, C., Kwon Cho, Y. (2017). Automated schedule updates using as-built data and a 4D building information model. Journal of Management in Engineering, 33(4), 04017012.
Tabkha, A., Hajji, R., Billen, R., Poux, F. (2019). Semantic enrichment of point cloud by automatic extraction and enhancement of 360° panoramas. International Archives of the Photogrammetry, Remote Sensing and Spatial Information Sciences, XLII-2/W17, 355–362 [Online]. Available at: https://doi.org/10.5194/isprs-archives-XLII-2-W17-355-2019.
Tang, P., Huber, D., Akinci, B., Lipman, R., Lytle, A. (2010). Automatic reconstruction of as-built building information models from laser-scanned point clouds: A review of related techniques. Automation in Construction, 19(7), 829–843.
Tarsha-Kurdi, F., Landes, T., Grussenmeyer, P. (2008). Extended RANSAC algorithm for automatic detection of building roof planes from LIDAR data. The Photogrammetric Journal of Finland, 21(1), 97–109.
Thomson, C. and Boehm, J. (2015). Automatic geometry generation from point clouds for BIM. Remote Sensing, 7(9), 11753–11775.
Thomson, C., Apostolopoulos, G., Backes, D., Boehm, J. (2013). Mobile laser scanning for indoor modelling. ISPRS Annals of the Photogrammetry, Remote Sensing and Spatial Information Sciences, 5(W2), 66.
Tran, H., Khoshelham, K., Kealy, A. (2019). Geometric comparison and quality evaluation of 3D models of indoor environments. ISPRS Journal of Photogrammetry and Remote Sensing, 149, 29–39.
Wang, X., Fouhey, D., Gupta, A. (2015). Designing deep networks for surface normal estimation. Proceedings of the IEEE Conference on Computer Vision and Pattern Recognition, 539–547.
Willenborg, B., Pültz, M., Kolbe, T.H. (2018). Integration of semantic 3D city models and 3D mesh models for accuracy improvements of solar potential analyses. International Archives of the Photogrammetry, Remote Sensing & Spatial Information Sciences, Volume XLII-4/W10, 1–2 October, Delft.
Xie, Y., Tian, J., Zhu, X.X. (2020). Linking points with labels in 3D: A review of point cloud semantic segmentation. IEEE Geoscience and Remote Sensing Magazine, 8(4), 38–59.
Xiong, X., Adan, A., Akinci, B., Huber, D. (2013). Automatic creation of semantically rich 3D building models from laser scanner data. Automation in Construction, 31, 325–337.
Zhan, Q., Liang, Y., Xiao, Y. (2009). Color-based segmentation of point clouds. Laser Scanning, 38(3), 155–161.
- Chapter written by Rafika HAJJI and Hassane JARAR OULIDI.