Business Analytics at a Glance
Chapter Highlights
- •Introduction to Business Analytics—What Is It?
- •Analytics and Business Analytics
- •Business Analytics and Its Importance in Modern Business Decisions
- •Types of Business Analytics
Introduction to Business Analytics—What Is It?
This book deals with business analytics (BA)—an emerging area in modern business decision making. This chapter provides an overview of analytics and BA used as decision-making tools in businesses today. These terms are used interchangeably, but there are slight differences in the terms of tools and the methods they use. BA uses a number of tools and algorithms ranging from statistics and data analysis, management science, information systems to computer science that are used in data-driven decision making in companies. This chapter also discusses the broad meaning of the terms—analytics, BA, different types of analytics, the tools of analytics—and how they are used in business decision making. Today, companies collect and analyze massive amounts of data. Because of the huge volume, these data are referred to as big data. Data mining is a way to extract information from big data. We discuss data mining and the techniques data mining use to extract useful information from massive amounts of data in subsequent sections and chapters.. Currently, the emerging field of analytics uses machine learning, artificial intelligence, neural networks, and deep learning techniques. These areas are becoming an essential part of analytics and are extensively used in developing algorithms and models to draw conclusions from big data.
Analytics and Business Analytics
Analytics [18] is the science of analysis—the processes by which we analyze data, draw conclusions, and make decisions. Business analytics (BA) goes well beyond simply presenting data and creating visuals, crunching numbers, and computing statistics. The essence of analytics lies in the application—making sense from the data using prescribed methods of statistical analysis, mathematical and statistical models, and logic to draw meaningful conclusion from the data. It uses methods, logic, intelligence, algorithms, and models that enable us to reason, plan, organize, analyze, solve problems, understand, innovate, and make data-driven decisions, including the decisions from dynamic real-time data.
BA covers a vast area. It is a complex field that encompasses visualization, statistics and modeling, optimization, simulation-based modeling, and statistical analysis. It uses descriptive, predictive, and prescriptive analytics, including text and speech analytics, web analytics, and other application-based analytics and much more. The following explanation of business analytics shows the vast area it covers.
Business analytics is a data-driven decision-making approach that uses statistical and quantitative analysis, information technology, management science (mathematical modeling, simulation), along with data mining and fact-based data to measure past business performance to guide an organization in business planning and effective decision making.
BA has three broad categories—descriptive, predictive, and prescriptive analytics. Each type of analytics uses a number of tools that may overlap depending on the applications and problems being solved. The descriptive analytics tools are used to visualize and explore the patterns and trends in the data. Predictive analytics uses the information from descriptive analytics to model and predict future business outcomes with the help of regression, forecasting, and predictive modeling.
In this age of technology, companies collect massive amount of data. Successful companies use their data as an asset and use them for competitive advantage. Most businesses collect and analyze massive amounts of data referred to as big data using specially designed big data software and data analytics. Big data analysis is now becoming an integral part of BA. The organizations use BA as an organizational commitment to data-driven decision making. BA helps businesses in making informed business decisions and in automating and optimizing business processes.
To understand the business performance, BA makes extensive use of data and descriptive statistics, statistical analysis, mathematical and statistical modeling, and data mining to explore, investigate, draw conclusions, and predict and optimize business outcomes. Through data, BA helps to gain insight and drive business planning and decisions. The tools of BA focus on understanding business performance using data. It uses a number of models derived from statistics, management science, and operations research areas. BA also uses statistical, mathematical, optimization, and quantitative tools for explanatory and predictive modeling [15].
Predictive modeling uses different types of regression models to predict outcomes [1] and is synonymous with the field of data mining and machine learning. It is also referred to as predictive analytics. We will provide more details and tools of predictive analytics in subsequent sections.
Business Analytics and Its Importance in Modern Business Decision
Business analytics (BA) helps to address, explore, and answer a number of questions that are critical in driving business decisions. It tries to answer the following questions:
What is happening and why did something happen?
Will it happen again?
What will happen if we make changes to some of the inputs?
What the data is telling us that we were not able to see before?
BA uses statistical analysis and predictive modeling to establish trends, figuring out why things are happening, and making a prediction about how things will turn out in the future. It combines advanced statistical analysis and predictive modeling to give us an idea of what to expect so that one can anticipate developments or make changes now to improve outcomes.
BA is more about anticipated future trends of the key performance indicators, and is about using the past data and models to learn from the existing data (descriptive analytics) and make predictions. It is different from reporting in business intelligence (BI). Analytics models use the data with a view to drawing out new, useful insights to improve business planning and boost future performance. BA helps the company adapt to the changes and take advantage of future developments.
One of the major tools of analytics is data mining, which is a part of predictive analytics. In business, data mining is used to analyze huge amount of business data. Business transaction data, along with other customer and product-related data, are continuously stored in the databases. The data mining software is used to analyze the vast amount of customer data to reveal hidden patterns, trends, and other customer behavior. Businesses use data mining to perform market analysis to identify and develop new products, analyze their supply chain, find the root cause of manufacturing problems, study the customer behavior for product promotion, improve sales by understanding the needs and requirements of their customer, prevent customer attrition, and acquire new customers. For example, Wal-Mart collects and processes over 20 million point-of-sale transactions every day. These data are stored in a centralized database and are analyzed using data mining software to understand and determine customer behavior, needs, and requirements. These data are analyzed to determine sales trends and forecasts, develop marketing strategies, and predict customer-buying habits (http://www.laits.utexas.edu/~anorman/BUS.FOR/course.mat/Alex/).
A large amount of data and information about products, companies, and individuals are available through Google, Facebook, Amazon, and several other sources. Data mining and analytics tools are used to extract meaningful information and pattern to learn customer behavior. Financial institutions analyze data of millions of customers to assess risk and customer behavior. Data mining techniques are also used widely in the areas of science and engineering, such as bioinformatics, genetics, medicine, education, and electrical power engineering.
BA, data analytics, and advanced analytics are growing areas. They all come under the broad umbrella of business intelligence (BI). There is going to be an increasing demand of professionals trained in these areas. Many of the tools of data analysis and statistics discussed here are prerequisite to understanding data mining and BA. We will describe the analytics tools, including data analytics, and advanced analytics later in this chapter.
Types of Business Analytics
The BA area is divided into different categories depending upon the types of analytics and tools being used. The major categories of BA are:
- •Descriptive analytics
- •Predictive analytics
- •Prescriptive analytics
Each of the above mentioned categories uses different tools, and the use of these analytics depends on the type of business and the operations a company is involved in. For example, one organization may use only descriptive analytics tools or a combination of descriptive and predictive modeling and analytics to predict future business performance to drive business decisions. Other companies may use prescriptive analytics to optimize business processes.
Tools of Business Analytics
The different types of analytics and the tools used in each type of analytics are detailed below.
Descriptive Analytics: Graphical, Numerical Methods, and Tools of Business Analytics
Descriptive analytics involves the use of descriptive statistics, including the graphical and numerical methods to describe the data. Descriptive analytics tools are used to understand the occurrence of certain business phenomenon or outcomes and explain these outcomes through graphical, quantitative, and numerical analysis. Through the visual and simple analysis, using the collected data we can visualize and explore what has been happening and the possible reasons for the occurrence of certain phenomenon. Many of the hidden patterns and features not apparent through mere examination of data can be exposed through graphical and numerical analyses. Descriptive analytics uses simple tools to uncover many of the problems quickly and easily. The results enable us question many of the outcomes so that corrective actions can be taken.
Successful use and implementation of descriptive analytics requires the understanding of different types of data (structured vs. unstructured data), graphical/visual representation of data, and graphical techniques using specialized computer software capable of handling big data. Big data analysis is an integral part of BA. Businesses now collect and analyze massive amounts of data referred to as big data. Recently, interconnections of the devices in IOT (Internet of Things) generate huge amounts of data providing opportunities for big data applications. An overview of graphical and visual techniques is discussed in Chapter 3. The descriptive analytics tools include the commonly used graphs and charts along with some newly developed graphical tools such as bullet graphs, tree maps, and data dashboards. Dashboards are now becoming very popular with big data. They are used to display the multiple views of the business data graphically.
The other aspect of descriptive analytics is an understanding of numerical methods, including the measures of central tendency, measures of position, measures of variation, measures of shape, and how different measures and statistics are used to draw conclusions and make decision from the data. Some other topics of interest are the understanding of empirical rule and the relationship between two variables—the covariance and correlation coefficient. The tools of descriptive analytics are helpful in understanding the data, identifying the trend or patterns in the data, and making sense from the data contained in the databases of companies. The understanding of databases, data warehouse, web search and query, and big data concepts are important in extracting and applying descriptive analytics tools. A number of statistical software are used for statistical analysis. Widely used software are SAS, MINITAB, and R—programming language for statistical computing. Volume I of this book is about descriptive analytics that deals with a number of applications and a detailed case to explain and implement the applications.
Tools of descriptive analytics: Figure 1.1 outlines the tools and methods used in descriptive analytics. These tools are explained in subsequent chapters.
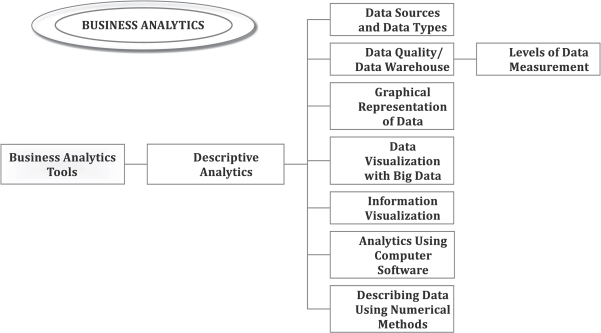
Figure 1.1 Tools of descriptive analytics
A detailed treatment of the topics in Figure 1.1 are provided in Volume I of this book.
Predictive Analytics
As the name suggests, predictive analytics is the application of predictive models to predict future business outcomes and trends.
Most Widely Used Predictive Analytics Models
The most widely used predictive analytics models are regression, forecasting, and data mining techniques. These are briefly explained below.
Data mining techniques are used to extract useful information from huge amounts of data using predictive analytics, computer algorithms, software, and mathematical and statistical tools. Regression models are used for predicting the future outcomes. Variations of regression models include (a) simple regression models; (b) multiple regression models; (c) nonlinear regression models including the quadratic or second-order models, and polynomial regression models; (d) regression models with indicator or qualitative independent variables; and (e) regression models with interaction terms or interaction models. Regression models are one of the most widely used models in various types of applications. These models explain the relationship between a response variable and one or more independent variables. The relationship may be linear or curvilinear. The objective of these regression models is to predict the response variable using one or more independent variables or predictors.
Forecasting techniques are widely used predictive models that involve a class of time series analysis and forecasting models. The commonly used forecasting models are regression-based models that use regression analysis to forecast future trend. Other time series forecasting models are simple moving average, moving average with trend, exponential smoothing, exponential smoothing with trend, and forecasting seasonal data. All these predictive models are used to forecast the future trend. Figure 1.2 shows the widely used tools of predictive analytics.
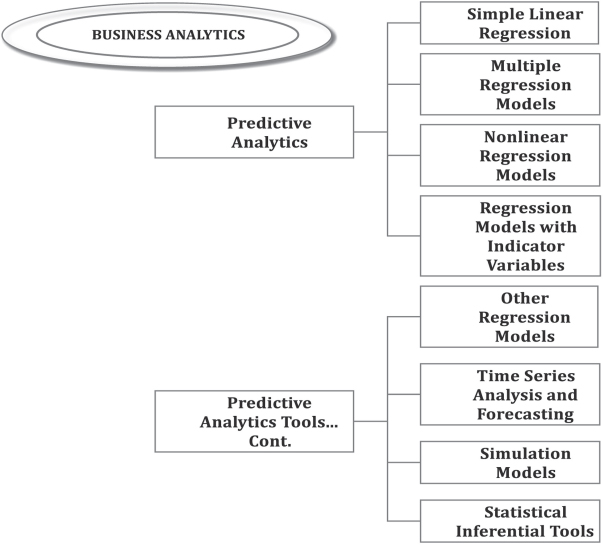
Figure 1.2 Tools of predictive analytics
Background and Prerequisites to Predictive Analytics Tools
Besides the tools described in Figure 1.2, an understanding of a number of other analytics tools is critical in describing and drawing meaningful conclusions from the data. These include (a) probability theory, probability distributions, and their role in decision making; (b) sampling and inference procedures; (c) estimation and confidence intervals; (d) hypothesis testing/inference procedures for one and two population parameters; and (e) analysis of variance (ANOVA) and experimental designs. The understanding of these tools is critical in understanding and applying inferential statistics tools in BA. They play an important role in data analysis and decision making. These tools are outlined in Figure 1.3.
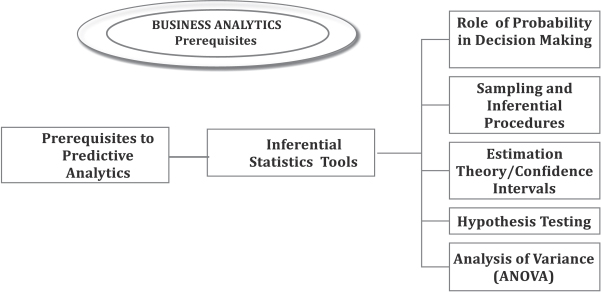
Figure 1.3 Prerequisite to predictive analytics
Other Areas Associated with Predictive Analytics
Figure 1.4 outlines recent applications and tools of predictive analytics and modeling. The tools outlined in Figure 1.4 are briefly explained below. Extensive applications have emerged in recent years using these methods, which are hot topics of research. A number of applications in business, engineering, manufacturing, medicine, signal processing, and computer engineering using machine learning, neural networks, and deep learning [25] are being reported.
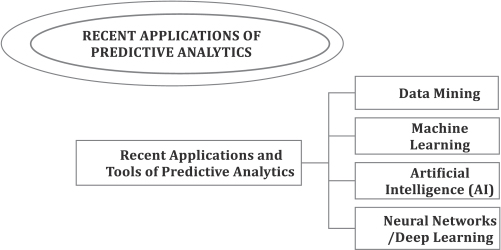
Figure 1.4 Recent applications and tools of predictive modeling
Recent Applications and Tools of Predictive Modeling
Machine Learning, Data Mining, and Neural Networks [5]
In the broad area of data and predictive analytics, machine learning is a method used to develop complex models and algorithms that are used to make predictions. The analytical models in machine learning allow the analysts to make predictions by learning from the trends, patterns, and relationships in the historical data. Machine learning automates model building. The algorithms in machine learning are designed to learn iteratively from data without being programmed.
According to Arthur Samuel, machine learning gives “computers the ability to learn without being explicitly programmed.”[2, 3] Samuel, an American pioneer in the field of computer gaming and artificial intelligence, coined the term “machine learning” in 1959 while at IBM.
Machine learning algorithms are extensively used for data-driven predictions and in decision making. Some applications where machine learning has been used are e-mail filtering, detection of network intruders or detecting a data breach, optical character recognition (OCR), learning to rank, computer vision, and a wide range of engineering and business applications. Machine learning is employed in a range of computing tasks. Often designing and programming explicit algorithms that are reproducible and have repeatability with good performance is difficult or infeasible.
Machine Learning and Data Mining
Machine learning and data mining are similar in some ways and often overlap in applications. Machine learning is used for prediction based on known properties learned from the training data, whereas data mining algorithms are used for discovery of (previously) unknown patterns. Data mining is concerned with knowledge discovery in databases (or KDD).
Data mining uses many machine learning methods. On the other hand, machine learning also employs data mining methods as “unsupervised learning” or as a preprocessing step to improve learner accuracy. The goals are somewhat different. The performance of machine learning is usually evaluated with respect to the ability to reproduce known knowledge. Data mining, which is knowledge discovery from the data (KDD), the key task is the discovery of previously unknown knowledge. Unlike machine learning, which is evaluated with respect to known knowledge, data mining uses uninformed or unsupervised methods that often outperform compared with other supervised methods. In a typical KDD task, supervised methods cannot be used due to the unavailability of training data.
Machine Learning Tasks
Machine learning tasks are typically classified into following three broad categories, depending on the nature of the learning “signal” or “feedback” available to a learning system. These are as follows [20]:
- •Supervised learning: The computer is presented with example inputs and their desired outputs given by the analyst, and the goal is to learn a general rule that maps inputs to outputs.
- •Unsupervised learning: As the name suggests, in unsupervised learning no labels are given to the program. The learning algorithm is expected to find the structure in its input. The goals of unsupervised learning may be finding hidden pattern in the large data. Thus, unsupervised learning process are not based on general rule of training the algorithms.
- •Reinforcement learning: In this type of learning, the designed computer program interacts with a dynamic environment in which it has a specific goal to perform. This differs from standard supervised learning as no input/output pairs are provided, which involves finding a balance between exploration (of uncharted territory) and exploitation (of current knowledge) [6]. Examples of reinforced learning are playing a game against an opponent. In this type of learning, the computer program is provided feedback in terms of rewards and punishments as it navigates its problem space.
Another application of machine learning is in the area of deep learning, which is based on artificial neural networks. In these applications, the learning tasks may contain more than one hidden layer or task that contains a single hidden layer known as shallow learning.
The other categorization of machine learning tasks arises when one considers the desired output of a machine-learned system [5]. Some of these are classification, clustering, and regression.
- •In classification, inputs are divided into two or more classes, and the learner must produce a model that assigns unseen inputs to one or more multilabel classification of these classes. This is typically tackled in a supervised way. Spam filtering is an example of classification, where the inputs are e-mail (or other) messages and the classes are “spam” and “not spam.”
- •In regression, also a supervised problem, the outputs are continuous rather than discrete. Various types of regression models are used based on the objectives.
- •In clustering, a set of inputs is to be divided into groups. Unlike classification, the groups are not known beforehand, making this typically an unsupervised task.
- •Machine learning and statistics are closely related fields.
Artificial Neural Networks [7]
An artificial neural network (ANN) learning algorithm, usually called “neural network” (NN), is a learning algorithm that is inspired by the structure and functional aspects of biological neural networks. Computations are structured in terms of an interconnected group of artificial neurons, processing information using a connectionist approach to computation. Modern NNs are nonlinear statistical data modeling tools. They are usually used to model complex relationships between inputs and outputs, to find patterns in data, or to capture the statistical structure in an unknown joint probability distribution between observed variables.
Deep Learning [7]
Falling hardware prices and the development of graphics processing units (GPUs) for personal use in the last few years have contributed to the development of the concept of deep learning, which consists of multiple hidden layers in an ANN. This approach tries to model the way the human brain processes light and sound into vision and hearing. Some successful applications of deep learning are computer vision and speech recognition.
Note: Neural networks use machine learning algorithms extensively, whereas machine learning is an application of artificial intelligence that automates analytical model building by using algorithms that iteratively learn from data without being explicitly programmed [1].
Prescriptive Analytics and Tools of Prescriptive Analytics
Prescriptive analytics tools are used to optimize certain business process and use a number of different tools that depend on specific application area. Some of these tools are explained here.
Prescriptive analytics is concerned with optimal allocation of resources in an organization. A number of operations research and management science tools have been applied for allocating the limited resources in the most effective way. The operations management tools that are derived from management science and industrial engineering including the simulation tools and have also been used to study different types of manufacturing and service organizations. These are proven tools and techniques in studying and understanding the operations and processes of organizations. In addition, operations management has wide applications in analytics. The tools of operations management can be divided into mainly three areas: (a) planning, (b) analysis, and (c) control tools. The analysis part is the prescriptive analysis part that uses the operations research, management science, and simulation. The control part is used to monitor and control the product and service quality. The prescriptive analytics models are shown in Figure 1.5.
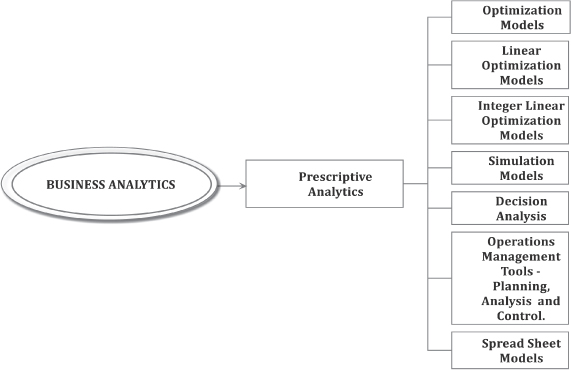
Figure 1.5 Prescriptive analytics tools
Figure 1.6 outlines the tools of descriptive, predictive, and prescriptive analytics tools together. This flow chart is helpful in outlining the difference and details of the tools for each type of analytics. The flow chart in Figure 1.6 shows the vast areas of business analytics (BA) that come under the umbrella of business intelligence (BI).
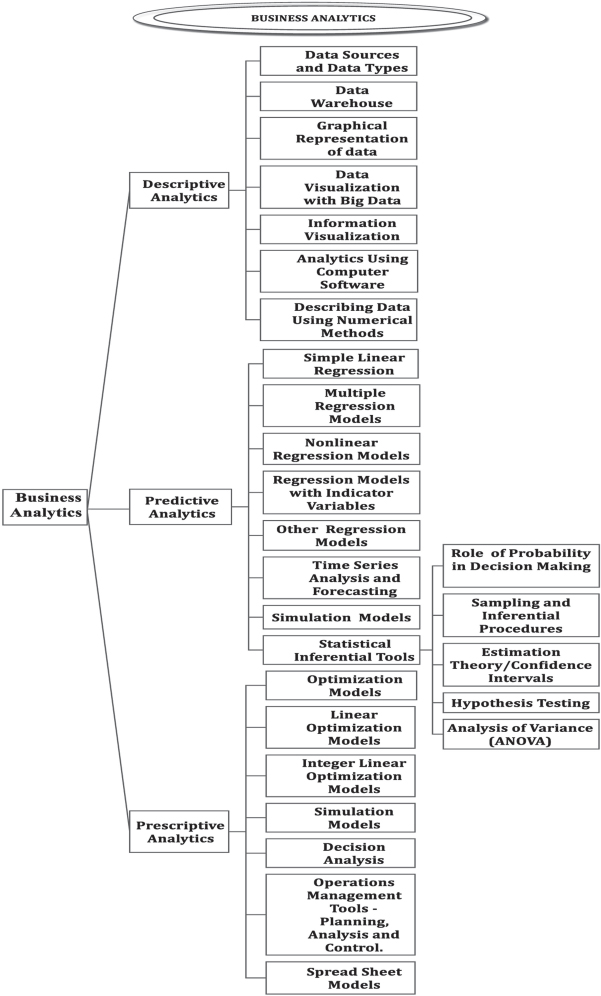
Figure 1.6 Descriptive, predictive, and prescriptive analytics tools
Analytical Models and Decision Making Using Models
A major part of analytics is about solving problems using different types of models. The following are the most commonly used models and are parts of descriptive, predictive, or prescriptive analytics models. Some of these models are listed below and will be discussed later.
Types of Models
(i) Graphical models, (ii) quantitative models, (iii) algebraic models, (iv) spreadsheet models, (v) simulation models, (vi) process optimization models, and (vii) other—predictive and prescriptive models.
Applications and Implementation of Analytics
Business analytics (BA) practice deals with extraction, exploration, and analysis of a company’s information in order to make effective and timely decisions. The information to make decisions is contained in the data. The companies collect enormous amounts of data that must be processed and analyzed using appropriate means to draw meaningful conclusions.
Much of the analysis using data and information can be attributed to statistical analysis. In addition to the statistical tools, BA uses predictive modeling tools. Predictive modeling uses data mining techniques, including anomaly or outlier detection, techniques of classification and clustering, and different types of regression and forecasting models to predict future business outcomes. Another set of powerful tools in analytics is prescriptive modeling tools. These include optimization and simulation tools to optimize business processes.
Although the major objective of BA is to empower companies to make data-driven decisions, it also helps companies to automate and optimize business processes and operations.
Summary and Application of Business Analytics Tools
- •Descriptive analytics tools uses statistical, graphical, and numerical methods to understand the occurrence of certain business phenomenon. These simple tools of descriptive analytics are very helpful in explaining the vast amount of data collected by businesses. The quantitative, graphical, and visual tools along with simple numerical methods provide insights that are very helpful in data-driven fact-based decisions.
- •Predictive modeling or predictive analytics tools are used to predict future business phenomenon. Predictive models have many applications in business. Some examples include the spam detection in messages and fraud detection. It has been used in outlier detection in the data that can point toward fraud detection. Other areas where predictive modeling tools have been used or being used are customer relationship management (CRM) and predicting customer behavior and buying patterns. Other applications are in the areas of engineering, management, capacity planning, change management, disaster recovery, digital security management, and city planning. One of the major applications of predictive modeling is data mining. Data mining involves exploring new patterns and relationships from the collected data.
- •Data mining is a part of predictive analytics. It involves analyzing massive amount of data. In this age of technology, businesses collect and store massive amount of data at enormous speed every day. It has become increasingly important to process and analyze the huge amount of data to extract useful information and patterns hidden in the data. The overall goal of data mining is knowledge discovery from the data. Data mining involves (i) extracting previously unknown and potential useful knowledge or patterns from massive amount of data collected and stored and (ii) exploring and analyzing these large quantities of data to discover meaningful pattern and transforming data into an understandable structure for further use. The field of data mining is rapidly growing and statistics plays a major role in it. Data mining is also known as knowledge discovery in databases (KDD), pattern analysis, information harvesting, business intelligence, business analytics, and so on. Besides statistics, data mining uses artificial intelligence, machine learning, database systems and advanced statistical tools, and pattern recognition.
- •Prescriptive analytics tools have applications in optimizing and automating business processes. Prescriptive analytics is concerned with optimal allocation of resources in an organization. A number of operations research and management science tools are used for allocating limited resources in the most effective way. The common prescriptive analytics tools are linear and nonlinear optimization model, including linear programming, integer programming, transportation, assignment, scheduling problems, 0-1 programming, simulation problems, and many others. Many of the operations management tools that are derived from management science and industrial engineering, including the simulation tools, are also part of prescriptive analytics.
Descriptive, Predictive, and Prescriptive Modeling
The first volume of this book provided the details of descriptive analytics and outlined the tools of predictive and prescriptive analytics. The predictive analytics is about predicting the future business outcomes. The second volume of this book is about predictive modeling which provides the background and the models used in predictive modeling with applications and cases. We have explained the distinction between descriptive, predictive, and prescriptive analytics. The prescriptive analytics is about optimizing certain business activities. A complete treatment of the topics used in predictive and prescriptive analytics is not possible in one brief volume of analytics book; therefore, this volume II focuses on predictive modeling.
Summary
Business analytics (BA) uses data, statistical analysis, mathematical and statistical modeling, data mining, and advanced analytics tools, including forecasting and simulation, to explore, investigate, and understand the business performance. Through data, BA helps to gain insight and drive business planning and decisions. The tools of BA focus on understanding business performance based on the data and a number of models derived from statistics, management science, and different types of analytics tools.
BA helps companies to make informed business decisions and can be used to automate and optimize business processes. Data-driven companies treat their data as a corporate asset and leverage it for competitive advantage. Successful business analytics depends on data quality and skilled analysts who understand the technologies. BA is an organizational commitment to data-driven decision making.
This chapter provided an overview of the field of BA. The tools of BA, including the descriptive, predictive, and prescriptive analytics along with advanced analytics tools were discussed. This chapter also introduced a number of terms related to and used in conjunction with BA. Flow diagrams outlining the tools of each of the descriptive, predictive, and prescriptive analytics were presented. This second volume of business analytics book is a continuation of the first volume. A preview of this second volume entitled Business Analytics: A Data-Driven Decision-Making Approach for Business: Volume II is provided in this chapter.
Glossary of Terms Related to Analytics
Big Data A collection of data sets so large and complex that it becomes difficult to process using on-hand database management tools or traditional data processing application [Wikipedia]. Most businesses collect and analyze massive amounts of data referred to as big data using specially designed big data software and data analytics. Big data analysis is an integral part of business analytics.
Big Data Definition (As per O’Reilly media): Big data is data that exceeds the processing capacity of conventional database systems. The data is too big, moves too fast, or does not fit the structures of your database architectures. To gain value from these data, one must choose an alternative way to process it.
Gartner was credited with the three “Vs” of big data. Gartner’s definition of big data is as follows: high-volume, high-velocity, and high-variety information assets that demand cost-effective, innovative forms of information processing that enable enhanced insight, decision making, and process automation.
Gartner is referring to the size of data (large volume), speed with which the data is being generated (velocity), and the different types of data (variety), and this seemed to align with the combined definition of Wikipedia and O’Reilly media.
Mike Gualtieri of Forrester said that the three “Vs” mentioned by Gartner are just measures of data. He insisted that following definition is more actionable and can be seen as follows:
Big data is the frontier of a firm’s ability to store, process, and access (SPA) all the data it need to operate effectively, make decisions, reduce risks, and serve customers.
Algorithm A mathematical formula or statistical process used to analyze data.
Analytics Involves drawing insights from the data, including big data. Analytics uses simple to advanced tools depending upon the objectives. Analytics may involve visual display of data (charts and graphs), descriptive statistics, making predictions, forecasting future outcomes, or optimizing business processes. The more recent terms is Big Data Analytics that involves making inferences using very large sets of data. Thus, analytics can take different form depending on the objectives and the decisions to be made. They may be descriptive, predictive, or prescriptive analytics. These are briefly described here.
Descriptive Analytics If you are using charts and graphs or time series plots to study the demand or the sales patters, or the trend for the stock market, you are using descriptive analytics. Also, calculating statistics from the data such as the mean, variance, median, or percentiles are all examples of descriptive analytics. Some of the recent software are designed to create dashboards that are useful in analyzing business outcomes. The dashboards are examples of descriptive analytics. Of course, a lot more details can be created from the data by plotting and performing simple analyses.
Predictive Analytics As the name suggests, predictive analytics is about predicting the future business outcomes. It also involves forecasting demand, sales, and profits for a company. The commonly used techniques for predictive analytics are different types of regression and forecasting models. Some advanced techniques are data mining, machine learning, neural networks, and advanced statistical models. We will discuss the regression and forecasting techniques as well as the related terms later in this book.
Prescriptive Analytics Prescriptive analytics involves analyzing the results of the predictive analytics and “prescribes” the best category to target and minimize or maximize the objective(s). It builds on predictive analytics and often suggests the best course of action, leading to best possible solution. It is about optimizing (maximizing or minimizing) an objective function. The tools of prescriptive analytics are now used with big data to make data-driven decisions by selecting the best course of actions involving multicriteria decision variables. Some examples of prescriptive analytics models are linear and nonlinear optimization models, different types of simulations, and others.
Data Mining Data mining involves finding meaningful patterns and deriving insights from large data sets. It is closely related to analytics. Data mining uses statistics, machine learning, and artificial intelligence techniques to derive meaningful patterns.
Analytical Models The most commonly used models that are parts of descriptive, predictive, or prescriptive analytics are graphical models, quantitative models, algebraic models, spreadsheet models, simulation models, process models, and other analytic models—predictive and prescriptive models.
IoT Stands for Internet of Things or IOT. It means the interconnection of computing devices in embedded objects (sensors, cars, fridges, etc.) via Internet with capabilities of sending or receiving data. The devices in IOT generate huge amounts of data providing opportunities for big data applications and data analytics opportunities.
Machine Learning Machine learning is a method of designing systems that can learn, adjust, and improve based on the data fed to them. Machine learning works based on predictive and statistical algorithms that are provided to these machines. The algorithms are designed to learn and improve as more data flow through the system. Fraud detection, e-mail spam, and GPS systems are some examples of machine learning applications.
R “R” is a programming language for statistical computing. It is one of the popular languages in data science.
Structured vs. Unstructured Data Refer to the “volume” and “variety”—the “Vs” of big data. Structured data is the data that can be stored in the relational databases. This type of data can be analyzed and organized in such a way that can be related to other data via tables. Unstructured data cannot be directly put in the databases or analyzed or organized directly. Some examples are e-mail/text messages, social media posts, and recorded human speech, etc.