
We will assume at this point that you have made the selection of some BI technology and have performed a decent user survey, have completed a POC, and have a support plan in place. You are now a “quadruple threat” in the BI space. Implementation of any BI solution will have its variances depending on the technology selected and the platforms you are using.
However, there are some general rules that should be used to minimize the time required to go from early experimentation to efficient production. It is in your best interest, whether you are part of IT or an end user, to take a logical, orderly approach to implementation.
One way to set a course and remain on it is to establish a standard project management time line with critical success factors and dates to adhere to. BI should be done in phases, and all pertinent elements should be tested, such as user certification, backup and recovery procedures, and all the steps that you know are necessary.
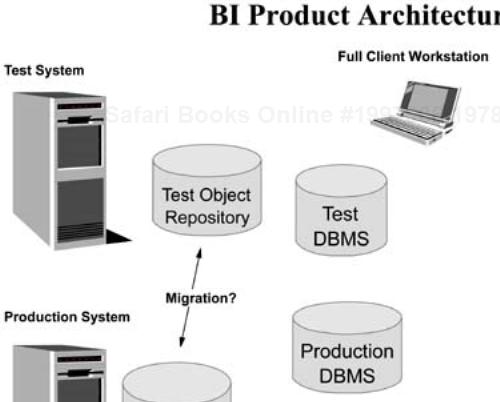
Figure 12-1 illustrates a typical minimum configuration for a BI query and reporting solution. The database server(s) could reside on the same server as the product(s) or on separate ones. The web server(s) typically are not co-resident with the other BI components, although it's been done.
It is beneficial to create a diagram of your proposed BI environment and walk through what steps you will take and when. In Chapter 2, we proposed that you draw a diagram of your existing BI environment (refer to Figure 2-5). If you diagram what you have today and what you will implement, do they look alike?
You may not provide a test system option for BI products. It is to your distinct advantage if you do so. It is also recommended that the test and production systems not be wildly disparate in size, speed, and system levels, so that there is an apples-to-apples comparison capability.
For the sake of argument, let's assume that you have done a quality POC and that the results have pleased all parties involved. You have actually created some objects (reports, queries, charts, etc.) that are “keepers” in your estimation. What should you do now?
You may have installed a trial copy of the software on a convenient server or a site where you will not run the production version(s). If the users have created any useful items (reports, queries, etc.) that would immediately work in a production environment, then back them up to restore to the production system. This also provides an excellent means of testing the methodologies and steps required to perform backup and restore functions, so you get one of the thankless tasks tested and out of the way early in the cycle.
Backup and recovery activities are a bit like putting a new roof on your home or installing a new water heater—they are no fun, but they are necessary evils. When something breaks or leaks, then you have a problem. Preemptive mode is best.
This will also provide a ready-made set of objects to launch in the new, pristine environment. During this phase, you need to look for the following user-based attributes of the saved work. If there are “holes” in the program (no naming conventions, etc.), then you need to plug them now.
What naming conventions will you use? If you have not established one as yet, this is a good time to do so. You want to nip in the bud right now the creation of loosely defined and managed objects. Suppose that Fred created Query99 and has now moved on to a competitor. What does that query do?
What descriptive information and comments did they add to the saved objects? If there is no standard set for these attributes, this is also an excellent time to put standards in place. One customer I worked with finally told the end users that they would be able to test for a description field being filled in, and if no description were in place, they would delete the objects from the catalog. He told his users, “We have identified several queries that were created during the last month that we think provide some in-depth sales analysis. They are all similar, and the guy who created and used them is gone.”
What disk storage was required for the saved objects? The tool may provide the ability to not only save queries, reports, charts, etc., but may also allow the storing of intermediate result sets. If you have been closely monitoring users during the POC, you should be able to extrapolate the activities and associated storage used with requirements on the production system. You'll need to know these things:
Average size of a report
Average size of a query
Average, High, and Low size of stored result sets
What was your experience with vendor support, if it was used? If you did not have any reason to use vendor support during the POC, then you still have not validated its effectiveness.
It would be in your best interest to collect this information and have a post-POC meeting to discuss and plan the production environment. If you have any significant gaps such as lack of naming conventions, it would be wise to set standards now before you have hundreds or thousands of objects in-house.
Because most BI tools allow the users to create objects on their own and store them, you not only have to provide some sanity and guidelines for storing such items, but you also need to track the amount of disk space as well.
Do you have plans in place for how you will measure and monitor system resources such as disk, cycles, etc.? How will you know if one user or one group is taking far more resources than others and far more than you anticipated? Some vendor offerings provide powerful management tools to assist in such endeavors. Some, however, do not, and it is up to you to provide this information.
As BI usage grows within the enterprise, there is a tendency for at least one significant application or user to become reliant upon some of these tools in a “stealth” manner. That is to say, these users just happened to create significant output that no one “officially” knows about. Such usage comes to light only when the system goes down or when a severe error occurs.
I have seen situations in which one or two users can delay, if not kill, an entire product replacement strategy because the proposed replacement tool could not provide the same function. I have also seen a similar situation in which a company is held hostage because a vendor initiates a dramatic price increase, knowing full well that there are no easy alternatives to the solution.
Document your known sizing and estimated sizing values. You should be able to define a profile of a user by type and activity. From this, you should create a user profile sheet on which you log the amount of resources utilized by the users. This isn't intended to be an intense activity, but one that should be periodically reviewed. (Hint: You may want to include measurement and usage capabilities as part of the selection process for the tool you select.)
The value that the enterprise will receive from BI will far outweigh the investment in hardware and software, if properly managed. Product and vendor selection should always favor the user's requirements. However, if we see a major gap in the tool's abilities or functions, such as lack of a measuring and tracking function, we should provide an alternative. If not, we should agree that we will periodically check to see how loaded and efficient the BI system is so we don't hit a wall unexpectedly.
There should be a target set of users with specific goals in mind. Even if you do not wish to set up a formal structure for BI support, it would behoove you to set up at least a temporary project office with an assigned project leader for early usage and tracking.
The initial end users should be required to submit a list of activities that they are going to perform in the early stages. This list should include the following:
Training schedule: No novice user should be allowed to participate in experimentation and learning at this point. That is, the creation of new queries and so on should not be permitted for novices with the new tool.
The users' documentation and sharing strategies: This includes naming conventions, shared access, and so on. You need to know how they will manage their work and ensure that someone else within the enterprise is able to take over and easily understand their work.
A list of the specific, initial output: You need to know what they will be setting up and what the goals are. For example, perhaps we hope to create a new series of sales reports. We should know what the reports are going to be, who will use them, the start and stop dates for the reports, and their criteria for success.
The most difficult part of the anticipated project: To ensure success and acceptance, this part has to be completed early. It will probably take the greatest amount of time because you are new to the product and will use more features, functions, and creativity to get it completed. If you put this off until later, the tool will never get the acceptance you desire nor deliver the ROI you need.
The support structure and the processes in place: Do the users fully understand the processes that we have agreed to if an issue about support arises? Do they agree to adhere to this and not engage in “quick-fix” or “sneaker-net” solutions?
The plan for possible failure: If the users cannot complete the tasks they hope to, what actions will be taken to correct the situation? If you don't want to wind up in the perpetual search for BI solutions, it's highly advantageous to have a fall-back plan.
If you are an IT person, think of this in terms of how you would implement new technology in your shop. When all the web-based hoopla occurred, did you just guess that you would use Java or some other technology to deliver web solutions? Would you let individuals just play at building an Internet, intranet, or extranet solution?
It will be beneficial to create a matrix of the tasks and measurements for Phase I to provide before and after views of the project as shown in Table 12-1. This is obviously a simplified view of a BI implementation project.
Table 12-1. Phase I of the BI implementation task matrix
Task | Start | End | Estimated Cost/Actual Cost |
|---|---|---|---|
Installation of hardware | |||
Installation of software | |||
Testing and validation of tool(s) | |||
Database access and testing | |||
Testing and validation of backup/restore capabilities | |||
Training for expert users | |||
Training for novice users | |||
Report 1 | |||
Report 2 | |||
Disk storage utilized survey | |||
System impact measurements | |||
Other |
Such a matrix may require many more columns or a different format. The reporting information should include number of users, storage and sizing, time to create, time to execute, and perhaps more. When you are finished, you should know where you started and what you expected. You also should know what it really took and how you feel about the project now.
I know that this seems like Implementation 101. I must tell you that I seldom see BI treated in a formal, understandable IT manner, and this causes problems. If this were a project in which a new set of reports or output had to be produced by the IT staff, there would be an accountable set of steps and goals. This “BI stuff” is not just a bunch of users taking random potshots at data, although many have taken that approach.
One customer I worked with predicated all its BI work on one vendor's OLAP tool and delivered a significant amount of critical, new information to users throughout the enterprise. They have had such stellar success that it has resulted in a “BI backlog.” The customer has been unhappy with its server platform, which has proven to be extremely unstable. The customer's executives have been pressing for new applications and to deliver critical new business information at their level within the company. This customer never thought BI would become a cornerstone of information to the extent that it has.
The dilemma the customer now faces, and you may as well, is that it has just stumbled into its current BI environment. The company has produced an unexpected windfall and is ill-equipped to expand on its success. The users want to know why things have gone from an accelerated pace to a crawl.
If you have identified all elements and created a matrix, post it for the participants to see. When you arrive at critical checkpoint dates, you must be sure that you follow through and verify the results. If you have delayed or missed the proposed targets, then adjust the schedule. And, if you do make adjustments, document why you have done so.
Completing the most difficult portion of your work is paramount to success. One POC with which I was involved during 2002 was a replacement of Tool X with Tool Y. The users had a series of difficult charts that they had managed to figure out with the old tool. They told us coming in that the replication of these charts was an absolute requirement, or we were wasting our time.
The proposed new tool was from a leading IBM Partner and had so much more to offer than the old tool, but that was a moot point with the users until the hardest part of their BI initiative was proven. Our partner brought in one of its very best technicians to address these issues, and it required all his knowledge to deliver the goods—but he did.
Such efforts are contrary to the “normal” POC as I have indicated, but sometimes you have to do such things to gain the user's confidence. The good news is that the most difficult hurdle had been overcome early. There was no doubt in the customer's thoughts that the new tool could handle any known BI requirement it currently had.
The bad side of this exercise is that the users had been placed in an observer-only role. You had to be a maven of this tool to get the results required. User confidence had been shaken because they watched a master ply his craft and felt that they would have to attain this level of expertise just to get meaningful output on their own.
Now that you have an accurate and meaningful assessment of the effort and resources needed to work with the selected tools, it's time to pause and collect your thoughts. You had an initial plan (I hope), and now you have executed the first part of it. Even if you bought a substantial amount of a tool and have not deployed it well, you have an excellent point of reference as to how to do deployment well, or at least how not to deploy it. You now have a baseline of the effort required to do things thoroughly.
I have worked with a large auto manufacturer for several years, and it's been interesting to watch this company's BI environment grow. The greatest area of change has been in its corporate attitude toward BI. The company has gone from the “loosey-goosey” approach to a very user-centric model. One thing I find fascinating is this company's periodic user and IT brainstorming sessions.
The customer convenes a meeting that is comprised of its major BI users and some IT folk who support BI at the functional and executive levels. They spend a day and sometimes longer behind closed doors discussing where they are, what have they done, and most importantly, where they need to go now. Many discussions revolve around how they might use existing data more effectively or how they need to implement changes or new data to support new initiatives. They identify what doesn't work as much as they identify the things that do work.
One of the most positive elements of this meeting is their emergence with a list of new, key business reports/charts they need to deliver and why. They define who the users are, how the users will interact, who will support them, and what data will be required to deliver. This is an ego-free, heart-to-heart session and is totally based on the needs of the business and how to deliver new information.
Another powerful occurrence is the interaction of key users from different business units. One of the meetings I attended resulted in a two-department cross-training session. One group had the database and SQL hotshots; the other had significantly more expertise in the BI tool that they both used. The cross-pollination and escalation of skills alone were worth significant internal real dollars.
One of the more difficult yet most rewarding technologies to implement is an OLAP solution. There are many “LAPS” such a ROLAP, MOLAP, HOLAP, etc. No matter which technology you have opted for, you will need to address some issues regarding the form of the source data and the required form for delivering or usage within an OLAP application.
If the technology selected is a pure OLAP solution, you will be working with a multi-dimensional and proprietary product. That is not a problem per se. However, you will usually discover that getting data into the OLAP model will require work, and sometimes lot of it.
The good news about OLAP (depending on what you have selected) is that the users do the majority of the work, and an IT concern such as performance is typically not an issue after the application is in place. One OLAP form that is widely installed stores its data in a multi-dimensional, proprietary format that is just blindingly fast in execution.
The challenge with a tool of this nature is getting the data into the proper form to feed to the model and then the time required to calculate its values. Calculations are normally done in batches. The users' access to the OLAP “cubes” is extremely fast. Performance issues are handled at the model definition layer, not at the database level.
The one exception to this is if you decide to implement a drill-through capability (see Chapter 7). When you permit an OLAP user to drill out past the cube to the underlying database, then the normal database performance issues apply.
Using an example of an OLAP tool that requires four basic steps, we can form an implementation schedule quite simply:
Define the model.
Format or transform the data to match the model.
Access the data and load to the OLAP model.
Calculate the OLAP database(s).
The model definition takes place in a whiteboard-like environment. Hopefully, the OLAP technology selected has a GUI that permits the users and support individuals to visually map out the business math. One thing to watch out for is an OLAP tool that isolates the business users from the building process due to the nature of the model definition process.
If your chosen OLAP technology supports a graphical building process, then the users usually can work through all the permutations and IF-THEN-ELSE independently of the data and in an understandable manner.
Given this type of approach, we can decide how far our OLAP model building and usage goes before we deliver to the end users. In many cases, we can decide to create a subset of the OLAP database and get this into the hands of our users quickly.
End-user training for OLAP is usually simple and cost effective. The degree of interaction with the OLAP source and complexity of usage is determined by the front-end tools selected. If you have chosen your BI tools wisely, the same tool used for query and reporting may be used to access your OLAP data as well. The learning curve for the users is minimal, and the overall cost is reduced.
Some OLAP technologies offer an easy-to-use spreadsheet interface. Most competent BI tools vendors offer access from their tools to several OLAP databases. If such tools are new and a bit complex at first, then you have the same learning curve involved as you would in a traditional query and reporting environment, with one exception. The “math” is already done in the OLAP database, and there should be far fewer calculations required, if any. Regardless of the tools you use to navigate and exploit OLAP, make sure that all users are capable of finding the same values and are accessing/interpreting the same data in the same manner.
In an OLAP environment, it is more important to track and measure the time required to load and calculate databases than any other issue. If you are implementing drill-through capabilities, then the back-end database must be clearly thought out. This adds a layer of complexity to your OLAP solution that must not be taken lightly.
If we use the matrix approach to OLAP implementation, then we should be able to define our OLAP support and growth requirements quite easily. Using a table like the one shown in Table 12-2, you should be able to quickly implement and track an OLAP project.
Table 12-2. OLAP implementation steps
Task | Start | End | Estimated Cost/Actual Cost |
|---|---|---|---|
Installation of hardware | |||
Installation of software | |||
Test of sample OLAP database (if provided) | |||
First model definition | |||
Data access and transformation steps | |||
First load and calculation of model | |||
Set up data for drill-through (if applicable) | |||
Test of drill-through capability | |||
Test and validation of backup/restore capabilities | |||
Measure sizing and load/calculation results of initial model |
Again, this list is just an example and does not contain everything you might wish to track. It is most important to have checkpoint meetings with the users and support staff. Here are some things to look for as you refine your OLAP environment.
Are performance and tuning tools or functions available that we have not used? It is important that we learn how to measure and adjust our data, because any additional dimension immediately doubles the size of the database.
Are the end users taking the OLAP results and adding calculations to it? Often, we will see a spreadsheet user tweak OLAP information external to the model. If this is justified, fine. If the only reason for doing so is a shortfall of calculations in the model, then we should address this issue.
Are we taking advantage of the capabilities of our chosen OLAP technology? Some products allow you to create separate databases (cubes) and link them or partition them. We may be able to build smaller “cubes” in a shorter amount of time, thus delivering less information for the end users to slog through. Even though OLAP databases tend to be very fast, why make every end user go surfing through multi-gigabytes of information that is not germane to them?
Are we using our OLAP products effectively to deliver data to executives? Remember that OLAP sources have the math within them as a fait accompli, so we should be able to deliver powerful and sophisticated analytics to executives without extensive additional training. In many cases, a support individual (administrative assistant or other) may be the individual responsible for querying the OLAP data and delivering a report to an executive.
If you are taking an orderly, manageable approach to BI implementation, your ability to expand usage of BI technology from a departmental or functional area level to a broader population may succeed. “Global deployment” is a term that makes me shudder a bit. There is no way that you can acquire a massive volume of product and deploy it with the assurance that wholesale anarchy may not reign.
One very large customer performed a survey of the usage of software on personal computers within the organization. This organization had developed a very elaborate infrastructure of support and deployment from a technology perspective. It could upgrade a huge number of users in a very short time frame. Someone finally asked, “Do we know what people are doing with all this stuff?” The customer set out to find an answer to this question. The survey results indicated that the number of active users doing anything meaningful with data at all was less than 5 percent of the population. One of the survey summary items indicated that “The average task being performed within our spreadsheets is the tracking and management of wedding invitation lists!”
The customer was being a bit flippant, but this was a task that came up frequently in the results of the user polls. A key problem that the organization identified was that many users had a fervent desire for more data and analysis, but they had no idea where to go to get it. Many were very savvy business people, but they were weak in computer technology. There was no central site for performing business-related calculations and analytics, but one could get an image of the supported PC system environment loaded and ready in no time at all. It was easy to get all dressed up with nowhere to go.
If you have a set of data provided within a controlled and managed BI project as described earlier, you are far beyond where many of your peers and competitors lie with their BI efforts. But if you do not have such a setup, can you do anything about it?
A few years ago, knowledge management (KM) was all anyone wanted to talk about. Every corporation was concerned about the exponential increase in information, including data, text, web-based information, reporting, audio, video, and more. New roles emerged, such as CKO (Chief Knowledge Officer) and others. The concern over handling all this information was to be addressed by new software, portals, personnel, and corporate standards.
One of the major contributors to this glut of information was the internal spewing out of data from analytics tools such as spreadsheets. Many hours and tons of money were invested into trying to get a handle on all this “stuff.” Sometimes, it's impossible to turn off the flow because people aren't quite sure what purpose it serves but don't wish to risk not having it.
Each item (report, spreadsheet, news article, etc.) fell into either a textual context or data context from a KM perspective. Databases needed to be scanned to discover certain values, terms, and more. Free-form text columns needed to be indexed and referenced. Text storage and searching of text were massive undertakings.
Meanwhile, most organizations were dabbling in data warehouse initiatives or similar activities. There were few, if any, BI-specific roles assumed within most enterprises.
The Director of Data Warehousing or equivalent might have loosely covered the Information Centers or other such permutations of the past.
He had enough to do to get data-related issues resolved. He may have asked himself questions like “How will we combine all this disparate data?” and “How on earth am I going to create an ongoing, reliable data-cleansing environment?” The tasks were daunting and formidable, and they still are.
You will have concerns and considerations for the creation of data and how you are going to store and manage it after you have it in place. You have executives assigned to these imposing tasks, but few operations include a core function that oversees the analytics performed and how you go about producing them.
In response to this requirement, some organizations have established a BI Competency Center. Because I am not listing specific external references, I suggest that you spend an hour or so with your favorite search engine and do a little homework. Use the term “BI Competency Center” as your search argument. If you have not heard this term before, you may be surprised at some of the results.
The roles provided by such a facility typically span the IT organization and the end-user community. If nothing else, it would be extremely valuable to have this role covered by a full-time individual who has the mission to identify and work with all BI-related initiatives within the enterprise. This person needs to have the blessing and backing of executive management such that she cannot be arbitrarily held at arm's length by someone with an axe to grind or is irrationally protective of her turf.
The first step is to do some research and build awareness among the IT and user populations that such an entity exists. It is helpful to see what others have done, but do not assume that you can use the same model and obtain the same results. You may surpass others by providing a more solid and viable environment. Think out of the box, and think big.
What are the activities an organization or group of this nature would perform? Obviously, it would depend upon the staffing and commitment of the organization to its BI infrastructure and importance. The more meaningful and high priority actions would include the following:
Corporate-wide inventory of BI tools utilized
Estimated cost of BI hardware, software, and support
Estimated cost of end-user efforts in attaining results with BI tools
Significant applications and uses of BI tools within the enterprise
Executive view of the value and ROI of BI within the enterprise
Linkages among business areas with cooperative BI ventures
Recommended linkages if not in place, and potential advantages to the business for creating such links
Setting standards for BI activities if none exist
Critical business requirements that might be addressed with BI tools but are not currently in the corporate plan
If we had an actual competency center with staff, they should follow the model of their ancient predecessor, the Information Center. One critical aspect to this is the BICC must not have any vendor or platform agenda. An ancillary requirement is that they should not believe all the “hype” they encounter about what is hot and new and could save the world. The primary goals of a BICC would be the following:
Minimize the TCO (total cost of ownership) for BI enterprise-wide.
Maximize the impact and ROI of BI initiatives in the enterprise.
Provide a focal point for best practices of BI tools and usage.
When goals are set, measurements and purpose tend to come along with them. I firmly believe that when you form a team of individuals who are responsible for creating and defending an enterprise BI plan, the result includes all the critical sections and tasks outlined in this book.
It behooves you to set a positive and sustainable course of action. The world of BI is going to increase in complexity, the number of options available, and radical technologies not available today. I suggest that a corporate philosophy regarding BI is more important than anything you have implemented today.
If you have been stimulated by what you have read so far and believe in BI as a major force to create positive changes in the business, where are you in relation to the topics we've discussed so far? Putting a partial infrastructure in place simply prolongs the agony for those pieces that do not work well.
Many enterprises have been in “perpetual reaction mode” for engaging in e-business and other web-based actions. We have all been reeling from the changes in technology, changes in the business environment, changes in the economy…change…change… change. There are always changes in the wind. What might some of these changes be for BI? What does the future hold for this ever-moving target?