
Now that we have covered a high-level overview of data science, we move on to talk about data strategy. This is key for any business that wants to generate value from its data, and it is just as important as hiring the right person.
There are many varying definitions of a data strategy on the Internet, but a good definition would be the following:
A data strategy is a living document that defines how the business is setting itself up, both from a technical and organizational perspective, to proactively manage and leverage data towards the long-term business strategy.
This definition is made up of several key components:
A data strategy is a living document … —A data strategy should not be a document that takes months to develop and then is put to one side, gathering dust for no one to read again. By all means, the data strategy can be a document, a presentation, or whatever other medium you choose, but above all, it should be a living document—meaning that it is constantly updated and refreshed as the business evolves.
… defines how the business is setting itself up, both from a technical and organizational perspective… —A good data strategy should ideally cover both the engineering and infrastructure approach and how you plan to structure the organization and teams to make the most of your data.
… to proactively manage and leverage data … —By creating a data strategy, you make sure that you take proactive measures to make the business as resilient as possible and give it as much of a competitive advantage as early as possible.
… toward the long-term business strategy—Last but certainly not the least, a data strategy should not exist in isolation from the rest of the business. Instead, a good data strategy will have the business strategy as its north star, and all of the plans should stem from this.
Why Is a Data Strategy Important?
Have you ever wondered what happens every minute on the Internet? Google processes 3.8 million search queries, 4.5 million videos are watched on YouTube, 188 million e-mails are sent, and approximately 700,000 hours are watched on Netflix. As our lives have become increasingly digital, the interactions we have with products and services can be recorded and observed like never before.
What do Nike, L’Oreal, Vodafone, and Transport for London have in common? On the face of it, all of these businesses operate in different markets and offer completely different products. However, they are all data-driven businesses.
In recent decades, data has transformed from being a side effect of products to one of the most valuable assets in a business. Data is multifaceted in the way it can add value. Still, one can broadly categorize the areas where data adds value as operational improvements, customer insights, and data as a product.
1. Operational Improvements:
• Data can improve or even fully automate processes within our businesses. For example, Verizon uses data to triage customer service calls and thus optimize their call centers. In addition, data-rich business areas such as supply chain logistics are prime targets to be automated.
• Another example of this is how Netflix has invested large sums into optimizing the production process so they can create original content at scale (Kumar, Misra, Walraven, Sharan, Azarnoush, Chen, and Govind 2018).
2. Customer Insights:
• Many of today’s most popular services use data as a tool to deliver a better product experience for the customer. For example, LinkedIn uses your past interactions to recommend posts you may be interested in. Spotify’s Discover Weekly is another fantastic example of using data and ML to generate recommendations and increase user engagement.
3. Data as a Product:
• Finally, data in and of itself can add immense value to the business as a new revenue stream. Typically, this area of value will only be relevant once a company has scaled to thousands of users and is generating significant amounts of data, but it should not be underestimated.
• Owning large amounts of user data can greatly increase the value of a company in the eyes of an acquirer. IBM acquired Weather Underground as part of a deal that was valued at approximately $2 billion by The Wall Street Journal, demonstrating the value of the data they possessed to IBM. While IBM didn’t disclose how the data would be used, it is clear that there are integrations of weather data within many other aspects of the business (e.g., IoT) since weather data can affect device failure. Sometimes, even data that does not seem valuable can hide a wealth of information.
Keep these areas in mind as we explore how to build a good data strategy, as they will help guide your thinking.
Even the European Union has acknowledged the importance of data in the future, outlining their own data strategy. The goal is to create a single data marketplace to level the playing field in competing against the big tech companies that own vast amounts of valuable data (“European Data Strategy” n.d.).
Now that you are convinced that every business is a data business, it becomes clearer that a company needs an effective strategy to extract as much value as possible from the data it collects. Oftentimes, especially at the earliest stages of a business, data collection can be expensive in terms of time and money. A well-thought-out data strategy helps to zoom in on which data will unlock the most value and hopefully kick off the data flywheel.
Throughout my work, I have often seen these two types of situations, as shown in Table 3.1.
So, what do these two cases have in common? In both cases, a data strategy can save the day. In the first case, a data strategy would have provided the company with tons of additional revenue. In the second case, a correctly implemented data strategy could provide the start-up with a competitive advantage in addition to increased revenues.
Table 3.1 Data strategy situations
| Situation 1 | Situation 2 |
Use Case | A company wants to conduct a statistical analysis. As the problem is investigated, it becomes clear that data could have been collected to improve the analysis, but it is not available. | A start-up requires some sort of data science service. As the discussion about the system progresses, it becomes clear that the requested service depends on many different kinds of data. The collection and storage of this data expose new avenues for monetization that can help improve the start-up’s revenue strategy. |
Explanation | This is an example of what I like to call data debt, where the lack of planning for future projects has led to the company not collecting all of the necessary data. As we will see in the following, a good data strategy will describe the projects a company wishes to aim for in the coming 12–24 months, along with the data required to deliver good results on those projects. Having a data scientist as part of the planning process will help make sure that you are covering your bases on all the data you should be collecting for the project. | In this particular situation, the impact of planning for a specific data science project is that more opportunities are discovered to leverage the data in the overall revenue strategy. Often, the brainstorming around a data strategy can go backward and forward. While thinking of the data required for one project, you may discover other projects and opportunities open up using that same data. |
Example | A car rental company wants to forecast demand for the upcoming months to create customized deals for each client. The company is not keeping information regarding the marital status and the age of its users. This information could have been very easily collected on its platform throughout all these years of operation. However, since this was not done, the company has to settle for a suboptimal model with reduced performance. | A common case is a recommender system. A recommender system can benefit from all kinds of information about the users: age, gender, purchases, and possibly other things. Designing the platform to improve information collected from its users results in an extensive and comprehensive database that can boost the recommender system’s effectiveness and can also be used for other purposes. For example, this information could be used to better manage discount deals, improve advertising, or even enhance the user experience. |
However, a data science strategy is less effective if it is not implemented from the early stages. This is why it is important to consider it as an integral plan of the product roadmap and the business plan. One of my favorite sayings is “failing to plan is planning to fail,” which couldn’t be more true for a data strategy.
How to Define a Data Strategy
Now that we’ve introduced the importance of having a data strategy, you must be wondering what the best process is to build a data strategy. There are many approaches that people favor online, each with its own pros and cons. The approach described as follows is one that we’ve had success with when working with small- to medium-sized businesses looking to build a roadmap for working with data.
Start With Your Business Strategy
A data strategy cannot exist in isolation of a coherent business strategy. The type of work you undertake will largely depend on objectives your business is looking to meet in the short- to medium term.
For example, imagine Company A (a B2C company) has just launched—or is about to launch—its first product to market. Presumably, one of their strategic priorities for the following year might be to rapidly acquire users and ensure that retention and engagement are high. Given these priorities, the data team must focus on building the right foundation to collect and analyze the necessary data to make rapid iterations on the product if necessary. In this example, this would form a core part of the data strategy.
Note that the business strategy will change from time to time, and so it is important that the data strategy also adapts to meet any new objectives or priorities.
If you have a clear idea of your strategic priorities as a business, then feel free to skip to the section on data use cases. Otherwise, in the following section, we will describe an exercise that should help you focus on what is most important for the business right now.
Exercise 1: Defining Your Strategic Priorities
First, a company needs to identify why it exists—what we’ll call its vision. This vision is the North Star for the company, and it should answer the question, “What will the world look like in 10 years with our company?” It should be bold, grand, and aspirational because, even if you never get there, it gives everyone in your company a sense of direction and purpose.
Following the vision statement, you should create your mission statement. This is a more short-term-focused description of why the organization does what it does, what it does, who it does it for, and how it does it. The mission statement should feel as if it’s within your grasp and is something you are clearly working toward in the present.
Lastly, from the mission statement, one can derive their strategic priorities. The whole point of defining the vision and mission is that you should start seeing a path from the organization’s current state to reach that North Star and this path is your strategy! All that’s left is defining the strategy into concrete priorities.
When going through this exercise with business owners in the past, we like to break down the business into its parts and get a feeling for where the areas for improvement are. The components we use to define a business are:
• Product
• Growth Marketing/Sales
• Internal Operations (People and processes)
• Business Model/Finance
These components will vary slightly depending on the type of business you’re building, so change those as you see fit.
Once we’ve defined these components, the next step is to brainstorm some areas of work or improvement for each component (using a whiteboard tool or similar). It should come as no surprise that the more people that are involved from different parts of the business, the better the perspective you’ll gain on each component.
However, keep in mind that each additional person will make the brainstorming session longer, making it more difficult to dive deeper into each employee’s opinions.
The output of this brainstorming exercise will be a set of ideas and suggestions for areas of work for the business going forward. You should begin to see certain themes emerging within each of the components or even across components. Take some time with the group to cluster all the thoughts and ideas into logical groups and decide which ones likely deserve the most attention in the coming year. These should form the foundation of your business strategy.
Build Your Data Use Cases
From your strategic priorities, you can start to ideate what the data use cases could be to support the delivery of that strategy. A data use case is a well-contained and well-defined project that relates to completing one of your strategic objectives. The data use cases that you define will form your key priorities for the year ahead, and from these data use cases, you can begin to formulate a plan of your data activities.
Some examples of data use cases are:
• Build a self-serve analytics capability in the company;
• Reduce the cost of delivery of service for a particular product;
• Deliver a more personalized customer experience;
• Reduce customer churn.
A good number of data use cases would be 3 to 5 for a year, including 1 to 2 quick wins. A quick win data use case serves several purposes, namely that you can demonstrate near-immediate value from the data side of the business to get more buy-in from the rest of the business. Also, delivering a project end-to-end can help to uncover any unexpected issues before beginning work on any bigger projects.
Once you have identified your data use cases, you can start to break down what will be required to deliver each of them and what considerations to make before embarking on any of them. The areas you need to think about for each data use case are:
• Data requirements: Do you require any specific data to deliver the project? A data scientist will be able to guide you regarding the type of data that may be required for a project and the quantity.
• Key project resources: Think about the roles that will be required to deliver on your project—this could cover not only data engineers, data scientists, and data analysts but also any business owners, project/product managers, and so on. Also, think about which people in the business may be impacted by this project and need to be involved as stakeholders.
• Technology: Are there any technical dependencies before the project can be successfully implemented? Will the data architecture/infrastructure have to be modified to get all the required data?
It is useful to think of these areas for all data use cases together, so you can spot overlapping requirements across projects and better coordinate resources.
Data Architecture
Having a clear idea of how your data is architected is imperative for long-term success and continuous innovation. As your organization scales, the amount of data in your organization will scale, and often in a nonlinear manner since each new user could potentially be creating more data than previous users as your product grows and improves.
In the early stages of a company, the cost of switching from one database or architecture type to another is manageable. It can often be done without too much service downtime. Compare that with an organization like Slack, which spent three years (from 2017 to 2020) migrating their data architecture from active–active clusters to a tool called Vitess (Ganguli, Iaquinti, Zhou, and Chacon 2020). Clearly, the amount of due diligence, thought, and work put into this migration is eons above one that a start-up with fewer than a thousand users would have to make to move from NoSQL to a SQL database, for example.
The lesson here is that putting some careful consideration into your data and systems architecture early on can pay great dividends in the future. There are countless stories of organizations spending millions of dollars trying to fix data silos and merging data from countless sources to get a single version of the truth. Not to mention the potential sum in lost opportunities because of how difficult it was to quickly prototype and test new ideas.
The business case for putting some serious thought into the data architecture is irrefutable. However, in reality, there is a fine balancing act between spending endless hours designing the perfect architecture and implementing your best idea at the moment to move quickly.
If one follows the thinking of agile methodology, one can only make decisions under existing knowledge, and any assumption about what the future holds is just that, an assumption. Therefore, don’t obsess over the perfect architecture, especially if there is still a lack of clarity around the product’s future. Instead, it’s more important to move quickly, test your assumptions, and keep iterating toward product-market fit.
Data Governance
Managing data across the organization is more than a technical or infrastructure challenge. It also relies heavily on the kind of governance a company puts in place to ensure that data is traceable, clearly defined, and accessible to only the people who need it. As with data architecture discussed previously, the scale of a data governance program should be proportional to the scale of data a business holds, meaning don’t weigh down the business with too much process early on.
A good place to start on data governance early is building a companywide data dictionary. A data dictionary is a living document where all the raw and derived data that exists in an organization should be defined clearly. For any derived data, there should be an explanation of the original source of the data and any transformations applied to it. Building a data dictionary should highlight any areas of confusion or misunderstanding about the data and serve to align everyone in the company on where to search for data to create reports or metrics. It is also recommended to assign someone responsible for each data source. Those people can be contacted if any issues arise with the data or if people have questions or concerns.
Another crucial aspect of data governance is the processes required by law under regulations such as the General Data Protection Regulation (GDPR) or the California Consumer Privacy Act (CCPA). Again, a data dictionary will help massively in identifying what kind of personal data you hold about users and you can record the answers to questions such as:
• Why is this personal data necessary?
• How long is this data archived for after a user becomes inactive?
• What third-party software are we sharing this data with?
Managing an AI Project
The field of product management for software has been rising in popularity throughout the 20th and 21st centuries, as academics and entrepreneurs have been designing new approaches to manage the complexity of software projects. Most notably, this has led to the explosion of agile methodology, making it the go-to methodology for delivering products that users love.
While software development has had decades to learn and mature, AI product development is still in its infancy. As a result, AI product development presents new challenges not seen in software development: there are more unknowns, outcomes are nondeterministic, and there has been an influx of new tools, infrastructure, and processes to support AI development that people have to become familiar with.
However, perhaps most impactful is that AI shifts the concept of engineering from a deterministic process to a probabilistic one. With all these challenges in mind, one would think that the process to approach AI projects would need to differ from software. However, the reality is that most companies we’ve interacted with that are working on AI projects tend to shoehorn typical agile software methodology to fit with these new kinds of projects.
In this section, we will explore in further detail why AI projects differ from software projects, and how product management practices should shift to deal with this shifting paradigm.
Why Are AI Projects Different to Software Projects?
As mentioned previously, the difference can be described at a high level by the fact that AI development is much more of a probabilistic process than a deterministic one. The following four areas describe in more detail how these projects differ and will help to clarify this concept some more:
Unpredictability. In traditional software projects, one can think of an overall project simplistically as a composition of functions where each function takes an input, applies some heuristics and processing to that input. As a result, the function returns an output.
When all these small unit functions are put together, one can create all sorts of wonderful applications. Since each function has been coded explicitly, it is simple enough to understand the behavior of each function by looking at what each line of code is doing. Doing so can help you understand not just typical test cases but also any edge cases that might cause the function to break. For example, if a function applies the logarithmic function to a set of inputs, any negative input will break it, so one can write some logic to reject any negative inputs.
If we continue this analogy in trying to explain the world of AI, one can think of AI as an approach to solving problems where we have pairs of input and output examples, and we’re training a model to replicate the function that converts the inputs into the outputs. A simple case would be, if we had the pairs (1, 1), (2, 4), (3, 9), (7, 49), and (8, 64), then we would want our model to learn that the function is y = x2.
In reality, the examples of input, output pairs that we work with represent much more complicated functions than this, which makes ML such a valuable tool in the toolkit. Now, say we’ve built a model, and we wanted to understand the behavior of the resulting function like was explained in the software project. We can no longer examine each line of code to understand what the function is doing since the model built is represented by some learned parameters that mix with the input in some mathematical formula.
This makes it much harder to understand the failure points of the function or model because it is more unclear how a model would behave with unseen inputs. This is particularly difficult with the recent rise in deep learning, as deep learning models are much more of a black-box approach than more simple ML approaches. Since the inner workings of the functions are hard to analyze and understand, it becomes much harder to understand and verify edge cases, as well as understand in what cases the model is likely to fail.
Another consequence of models learning the functions from input and output pairs is that ML models are never 100 percent correct (although they can come pretty close in some types of tasks). This means that organizations need to understand how to manage cases where models predict outputs incorrectly. In some cases, such as recommending new songs, the cost of a bad recommendation is not so high. However, in more serious applications, such as the automatic detection of cancer, a wrong prediction can have drastic consequences, so processes need to be put in place to deal with this.
Deterioration of Models. ML models are called “models” because they are ultimately trying to accurately represent some behavior occurring in the real world. For example, a model that aims to forecast how many ice creams can be sold in a day will be modeling the behavior of ice cream demand across a population. Say that the temperature on a given day was given as an input to model the impact temperature has on ice cream sales. The model will likely find a positive correlation between temperature and ice cream sales, and sales will, in all likelihood, be predicted relatively accurately.
We all know that the world we live in is incredibly complex and that behaviors change over time. This means that any model trained on historical data will be more and more out of date as the world changes and adapts to new circumstances. In the case of our ice cream model, there could be an increased awareness over time that ice creams are unhealthy because of their sugar content, leading to a slight decrease in ice cream sales over time. Our model would not accurately represent the real world since a day with the same temperature as a day a year ago will lead to fewer sales. This means our model will need to be retrained to capture the change in behavior.
This phenomenon is extremely common across all areas of ML and leads to models needing to be retrained periodically for the accuracy to not deteriorate over time. A more representative example of this in the real world is the example of fraud detection, where criminals are always coming up with new ways to defraud institutions; hence models need to adapt to be able to detect these new types of fraud. This reality means that a model is never in its “final state,” adding another layer of complexity to AI projects.
Hard to Forecast. It may be tempting to think that because one solution to an AI problem worked to solve another problem very similar to your own, this solution will also work on your problem. For example, you may be building an e-commerce store and find an implementation of a recommender system built on another store that has worked well. However, the reality is that the underlying distribution of the data used to train these models is different. Therefore, you will need a different solution for your specific problem.
Consider this example further. On the surface, the data needed to train the recommender system is almost identical. There is a group of products with some product metadata. Next, there are the users, each with their own characteristics. Lastly, there’s a set of interactions between users and the products. Even so, the same implementation of a recommender system works for one website but not for another. How can this be?
There could be many explanations for this phenomenon, but ultimately it comes down to the fact that the distributions generating this data are not the same. In layman’s terms, people on one website could be completely different from those on the other website, with various purchasing behaviors and motivations. One model might be great at accurately representing the population’s behavior on one website but be bad for the other website. Sometimes you may get lucky, and a slightly different set of the model hyperparameters could be enough to solve your specific problem. Other times, you might need to look for an entirely different algorithm to solve your problem.
Hard to Measure Progress. Even as an experienced data scientist, it can sometimes be very hard to fully understand why a model isn’t performing well. Typically a fair amount of manual inspection is required to figure out why some training examples are being predicted inaccurately, which could even mean looking example by example at what features may be confusing the model. This reality means that it is even harder to determine what changes will lead to any significant improvements in performance.
It is possible to struggle for weeks as you run several experiments and tune certain model parameters that result in only a 1 to 2 percent improvement in the model. Until you suddenly discover a new input feature that improves the model by 10 to 20 percent! Progress in an AI project is very chronologically nonlinear, and it can be challenging at the beginning of a project to know when you’ll make that breakthrough that will make your model viable to deploy.
I have witnessed many projects where, for weeks, it felt like that breakthrough was coming, to no avail. When is it the time to decide that enough effort has been expended on one solution hypothesis? There are many possible rabbit holes to go down for any solution, making this question very difficult to answer. The “definition of done” is certainly not clear for an ML project, as your team may feel that the extra performance can be obtained. But at what cost? It is imperative to come back to business value to determine whether pursuing that extra model performance will deliver any benefit.
Principles for Agile AI Development. While the previous section describes the difficulties of estimating and delivering an AI project relative to a software project, there are some tactics that organizations can implement to give themselves a leg up when it comes to becoming an AI-powered organization (Table 3.2).
Data Science Processes. There are many different ways to implement a data science project. This has led to the creation of some processes that formalize some of the steps required. In this section, we will explore some of these processes.
Table 3.2 Agile AI development
Define your company’s mission and nearterm strategy | This topic was covered extensively in the first section of the chapter, but it is so important that it should be included here again. Not only should you take the time to define this, but once you have it, make sure that the ML applications that you work on directly impact your north star metrics. |
Follow the data science hierarchy of needs | The data science hierarchy of needs (Rogati 2017) places AI at the top of the pyramid (think self-actualization if you are familiar with Maslow’s hierarchy of needs). Before you can effectively build AI into your organization, crucial aspects need to be developed, such as data collection mechanisms and the ability to run data analytics on your connected data. Figure 3.1 shows the full data science hierarchy of needs that you should follow as a path toward building an AI-driven organization. |
Build data labeling into your product | Building labeled data sets for ML applications is expensive, particularly when you must outsource the labeling to external services. If you can build a mechanism in your product that encourages users to label data (e.g., categorizing a transaction in your banking app), you will organically build a large enough dataset to train an ML model. |
Make your first AI project a simple one | Andrew Ng, the cofounder of Coursera and Landing.ai, preaches this tactic in his playbook to usher organizations into the world of AI. There are many direct and indirect benefits of working on a simple AI project first, but mainly it (a) delivers immediate value to the organization, (b) secures buy-in from stakeholders that AI is a valuable area to invest in, and (c) delivers a successful project will boost team morale and have knock-on effects for future projects. |
Make sure the problem is very well defined | The more precisely you can describe the problem you’re trying to solve, the more you can narrow down approaches that may solve the problem. Consider what edge cases your algorithm might face and how it should approach those. It really helps to try to solve the problem manually first, as a team, so you have a few examples to base your discussion on and start to exclude or include potential solution approaches. |
Do the simplest thing that could possibly work | When starting any project (this also applies to non-AI or ML projects), it often helps to refer back to the 80/20 rule and think about the simplest thing that gets you most of the way there with little development. This tactic has two clear advantages: 1. You may find that the simplest method you can think of already delivers enough value. Otherwise, you have a better idea of how far from the target performance this simple method gets you, which can be useful to understand the complexity of the problem. 2. A simple method will force you to think more about the whole end-to-end solution (data inputs/outputs, pipelines) rather than focus on building a complicated algorithm. This will uncover any unexpected surprises that might arise when deploying this algorithm, and these can be handled in parallel while the algorithm is improved and research is underway. |
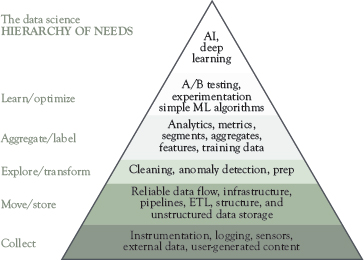
Figure 3.1 Data science hierarchy of needs
The processes outlined here are all slight variations on each other while following a common set of principles on how to approach data science projects. If you are to take anything from this section, it should be these principles. The final processes should fit your project style and requirements rather than shifting your ways of working to fit these processes. These processes are guidelines and best practices, but real projects are messy so always think about what types of processes will suit your specific set of circumstances.
Process 1: CRISP-DM. CRISP-DM (Cross-Industry Standard Process for Data Mining) is perhaps the most popular process used to plan a typical data science project. The purpose of CRISP-DM is to clearly define the phases that make up a data science project and to understand how those phases interact with each other.
Unlike the Microsoft Team Data Science Process described as follows, CRISP-DM does not concern itself with the lower-level details of how work is managed or the roles and responsibilities in the team. Instead, CRISP-DM is a high-level framework that will help you to understand what kind of work is carried out in each phase of the project and also the deliverables that could be expected. Above all, though, CRISP-DM emphasizes the iterative nature of a data science project and is flexible to move between phases in response to new learnings and findings during the project.

Figure 3.2 Six main phases of the CRISP-DM process
Six main phases are described as part of the CRISP-DM process (Figure 3.2):
1. Business Understanding
2. Data Understanding
3. Data Preparation
4. Modeling
5. Evaluation
6. Deployment
Business Understanding: The first phase sets out the context for the project by focusing on three main areas: (a) defining the business objectives, (b) identifying the project requirements, and (c) building a project plan.
Setting clear business objectives is arguably the most important part of the process, because these will be continually referred back to throughout the project to make important decisions. Think about a primary goal that you are seeking to achieve and any related questions that would be useful to address. Once you have these, consider which metrics will most accurately track the progress toward achieving the primary business objective. It is dangerous to define a project outcome that is not measurable as it may lead to a misunderstanding within the team of whether the project is moving in the right direction. Also, it is common for project teams to go down rabbit holes that may not contribute to moving the needle on the business objective, so having metrics to track will be useful to course correct.
Once the business objectives have been agreed upon, consider the key requirements and dependencies for the project. It is best to have a data scientist involved in this process to validate the feasibility of the project with the specified data and resources. The requirements can be split into several categories, such as project resources, data, and computing resources.
While there are many uncertainties at this phase of the project, it can be helpful to draw up a high-level project plan with key milestones you want to hit. As data science projects are quite exploratory and uncertain in nature, make sure to be realistic in your timelines and add a good amount of buffer to avoid unexpected delays.
Data Understanding: This is always the first step of any data scientist when approaching a new problem. The outcome of this phase is to verify that there is enough data and that it is of a high enough quality to build accurate models.
Common pitfalls in the data are variables having lots of missing values, the correct variables not being collected for the project, or there being noise in the data due to some error in the collection process. The data understanding phase should seek to extract these insights and validate any preconceived assumptions about what the data is describing. A typical output of this phase is a report that highlights the findings and any immediate actions that might need to be taken to correct errors in the data.
Data Preparation: The precursor to the modeling phase is the preparation phase. A data scientist will select the appropriate data from the various identified data sources and perform data cleaning and wrangling exercises to transform it into a state that will allow it to be inputted into a data science model.
This phase will be repeated several times throughout the project, as you will undoubtedly learn and experiment with different data points and different processing methods to improve modeling results. You will often hear the phrase “Garbage In, Garbage Out,” and this is also true of modeling—often, the best improvements in data science models are generated by carefully selecting the input data and processing it in creative ways rather than fine-tuning the model parameters.
Modeling: The modeling phase involves researching and developing the most appropriate models for the use case. There is a lot of uncertainty in this phase of the project, as models don’t always transfer across use cases, even when the use cases are very similar. Owing to this, it is important to start with simple models and then iterate from there as you build up an understanding of the limitations of the simple models. There are many open-source libraries and packages that make it easy to get started with prebuilt models; we have listed a few at the end of the document relating to each use case.
Before beginning any model development, make sure you have a clear understanding of which model evaluation metrics will be used to compare and select the best models, for example do you prioritize precision or recall? This depends vastly on your use case and the cost of different errors.
As described previously, the modeling phase and data preparation phase are tightly linked. Each model is based on slightly different assumptions of the data, so the data may need to be processed differently for each model. Furthermore, models can be improved through better feature engineering (which variables you feed into the model from the raw input data).
Evaluation: As opposed to the model evaluation that forms a part of the modeling phase, the evaluation phase here is about determining how well the project is measuring up to the overall business objectives set out at the beginning of the project. At this stage, you will undoubtedly have learned a lot about the data, and the complexities of the project, meaning you may choose to revisit the business objectives slightly based on your learnings.
Perhaps in this stage, it would make sense to test the model in a real, lightweight setting with real users. While the model may be performing well in a development environment, it may not perform as well as you expect in a production environment if the data doesn’t quite match real life or there are any factors that have been overlooked while developing the model.
Deployment: If you get to the stage you are happy with the model results, congratulations! You are almost at the point where you can derive business value from the project. The final stage of the project is the deployment stage, where you must decide how the model will be running in production. Common questions to ask here are:
• How often will the model be run on new data? Batch predictions or real time?
• How will the model communicate with the input and output systems? Does an API (Application Programming Interface) need to be designed?
• How will you monitor the performance of the model over time? Who will be responsible for this?
• How often does the model need to be retrained? Ideally, this question should be answered during the evaluation phase as you understand how the model performance decays over time.
Process 2: Microsoft Team data science Process. Microsoft defines the Team Data Science Process (Microsoft n.d.) as follows:
The Team Data Science Process (TDSP) is an agile, iterative data science methodology to deliver predictive analytics solutions and intelligent applications efficiently. TDSP helps improve team collaboration and learning by suggesting how team roles work best together. TDSP includes best practices and structures from Microsoft and other industry leaders to help toward the successful implementation of data science initiatives. The goal is to help companies fully realize the benefits of their analytics program.
The process is defined by the following key components:
1. A data science life cycle definition.
2. A standardized project structure.
3. Infrastructure and resources for data science projects.
4. Tools and utilities for project execution.
For the context of what we’ve been discussing in this chapter, the data science life cycle definition is the most relevant. Components 2 to 4 are incredibly useful when getting to the implementation, and I encourage you to check it out on Microsoft’s website. For the rest of this section, we’ll only focus on the life cycle.
The life cycle defined in this project borrows a lot from the CRISP-DM methodology described in the last section but reinforces the importance of making the process iterative and, above all, iterating between each main phase of the project rather than only iterating through the full cycle. The life cycle can be summarized by the following diagram (Figure 3.3).
As you can see from the diagram, the four main phases of the life cycle are:
• Business Understanding
• Data Acquisition and Understanding
• Modeling
• Deployment
This can be mapped almost like-for-like to CRISP-DM, with the only exceptions being that Data Understanding and Data Preparation have been collapsed into Data Acquisition and Understanding, and Modeling and Evaluation have been collapsed into Modeling. Given this similarity, please refer to the previous section for detailed explanations on the kind of activities carried out in each phase.
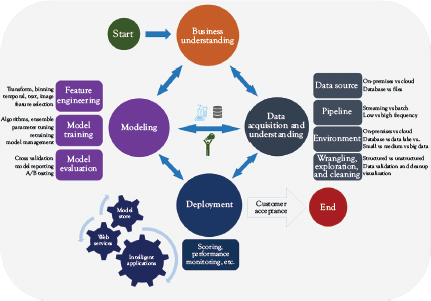
Figure 3.3 Data science life cycle
The important area to emphasize in this section is the iterative nature of the process. Being agile in the way you approach data science development will undoubtedly give you an advantage in delivering quality projects on time. It is very rare to go through the process once. It would mean having the perfect problem definition, knowing exactly what data you need to solve the problem, and then developing and deploying the perfect model. That doesn’t happen. There will be surprises and lessons along the way that will change previously held assumptions in the process.
In the Business Understanding phase, you will come up with an initial plan for how you’re going to solve the problem that you’ve set out and what data you will need to train a model. Once the plan is created, the first step is to explore the data you have identified to see if the quality and quantity are sufficient. The findings from this phase will provide some new information, such as whether there is any missing data for the data points you wish to extract or whether there is an imbalance of training examples (e.g., the majority of your users are male; therefore, your algorithm might suffer in accuracy for female users). It is vital to revisit the documents prepared in the Business Understanding phase to update the assumptions and the proposed approaches. Likewise, the modeling phase might prove that some method of approaching the problem is infeasible, which would need updating in the Business Understanding documents.
However, the most common feedback loop from the diagram is the interaction between the Data Acquisition and Understanding phase and the Modeling phase. As explained in the AI Principles section, starting with the simplest model you can think of on a small subset of your entire data is beneficial. The model will likely not be very accurate. However, exploring the model’s errors may give you a clue as to what other data points will help it improve.
For example, I worked on a project where we were building recommender systems to recommend books to children. We found, from initial models, that the recommendations were irrelevant for children since their preferences change so quickly as they grow up. From this, we were able to identify that knowing the child’s age would improve the model considerably by making more age-specific recommendations.
Over the lifetime of a project, there will be many iterations across this loop, and you want to make sure that you record the findings along the way so that you have some traceability of the data points that have been tested and what approaches have worked or not worked.
Lastly, once you have a satisfactory model and are ready to deploy, there will be some back and forth between the Deployment phase and the Modeling and Data Acquisition and Understanding phases as you try to discover the optimal approach to deploying a model. The model will need to access new data from your production databases, so you need to consider how and where the data is stored and where the predictions of the model will be stored. Similarly, will the model be deployed through an API or run as a scheduled job to train and output new predictions? The response to this may require some changes in the Modeling phase to ensure the model is suitable for your requirements.
Microsoft has released a Github repository that anyone can use to get started with the process: https://github.com/Azure/Azure-TDSP-ProjectTemplate.
Process 3: Tesseract Academy’s 2-Actor Process. Tesseract Academy’s 2-actor process focuses not so much on how the data strategy interacts with the business but more on the interpersonal dynamics between the data scientist and the business leader.
The previous processes do a good job of breaking down the steps required to complete a data science project. Tesseract Academy’s process takes a more person-centric view, focusing a lot on the challenges and misinterpretations that can take place between the two main actors of any data science project: the key business stakeholder and the data science lead.
This process is an excellent complement to the other processes outlined here and can help you uncover any challenges that might arise. The process assumes that a company does not have a data science function and can be very useful for organizations embarking on that journey. Companies that have been working with data for a long time will find that many of the challenges outlined in this process might not exist for them.
In this process, there are two main actors and four steps. The main actors are the domain expert (or key business stakeholder) and the data scientist (or, in the case of a data science team, the team leader).
The four steps are outlined as follows. Under each step, you will find the person who is responsible for completing it.
1. Problem definition
a. Domain expert
2. Choosing the right data (data management)
a. Domain expert
b. Data scientist
3. Solution of the problem
a. Data scientist
4. Creating value through actionable insights
a. Data scientist AND domain expert
Problem definition: This is where the key problem is defined. This is done by the domain expert (and key business stakeholder). Why is it the domain expert instead of the data scientist? Because no one can speak better about the problems of the business than someone who is actually part of the business. While a data scientist might bring some external knowledge, the domain expert is the one who should really understand all the intricacies of their organization. This means that they should be able to pose a list of relevant problems/challenges.
The data scientist may have worked in this field before and might have some great ideas, which can be used straight out of the box. However, even if that’s the case, the domain expert needs to have at least a clear idea of the business problems to really own the proposed solution and prioritize any suggestions accordingly.
There is no requirement here to be 100 percent specific. For example, a domain expert who lacks an understanding of data science might find it challenging to provide an unambiguous description of the business’s problems. That’s fine, as long as they can give an accurate picture of the overall business and some key performance indicators.
The danger here is being vague and unable to explain what the expected key metrics or results are to the data scientist. Solving the challenge requires the data scientist to make sure they are optimizing for the right target and then communicating these results to the domain expert so that the benefit becomes clear. This first step is crucial in achieving this goal.
Choosing the right data (data management): This is tricky because it requires the synergy of both the data scientist and the domain expert. In an ideal world, the business has followed a data strategy from day zero. The data is clean and of good quality. The domain is relatively simple, and there is no noise in the data. Unfortunately, this is the exception rather than the rule.
In most cases, a business will not have followed a data strategy. This means that the data scientist might encounter many issues, such as:
1. Missing values;
2. Important and useful variables not being collected;
3. Data being collected at the wrong level of granularity (e.g., month instead of day).
Similarly, there is a significant danger here coming from the domain. One of the authors worked with a company producing a radar device. He developed an algorithm for them, but when the company changed the chipset, the algorithm stopped working. The problem was due to the noise inherent in the two chipsets and some other version differences in the hardware. Both the author and the company were unaware that upgrading the chipset wouldn’t improve the algorithm, but rather it would require complete retraining.
So, the best way to walk through this step is through a back-and-forth between the data scientist and the domain expert. Make no assumptions! Do not assume that the data is correct, accurate, or lacks noise. Be very skeptical of any early, very successful results. It is more likely that you have data leakage rather than amazing data.
An example of data leakage is when an input variable correlates very highly with the outcome variable but wouldn’t usually be available at the test time. For example, if you are forecasting quarterly sales and someone is adding a binary variable indicating whether sales were high or low, this would cause performance to spike. But this variable was created after looking into the past.
Solution of the problem: This step comes down to the data scientist. If the previous steps have been done correctly, the following things will be in place:
1. A clear definition of the problem and the business.
2. A good, clean set of data.
The data scientist now needs to do the following:
1. Identify the key metrics of success.
2. Solve the problem using a variety of data science methods.
This takes us to step 4.
Creating value through actionable insights: So far, the domain expert–data scientist duo have achieved the following:
1. Built a common understanding of the problem.
2. Checked the quality of the data.
3. Created a solution.
Now it’s time for the two actors to work in complete synergy. The data scientist has to explain to the domain expert how the solution really addresses the problem outlined in step 1. The decision maker has to understand and approve this solution. The solution needs to be translated in measurable results. This way, the domain expert can integrate it into the overall company strategy, and the data scientist can have a measure of performance to use as a benchmark when further improving the solution.
Case Studies
Let’s take a look at a few case studies to make all the above easier to understand.
Case Study 1: The Recommender System
A recommender system is an invaluable tool for any e-commerce business and beyond. Spotify uses a recommender system to best identify the songs you are going to like. Amazon is using a recommender system to recommend products to you. And Netflix uses a recommender system to try and predict what movies or shows you will watch for hours.
So, in this case study, we will deal with a fictional company called Zookla. Zookla is an online retailer of sports clothes and equipment. The company consists of 10 people and includes software developers, business development, and the CEO, who is still very much involved in day-to-day operations. The company recently raised $5 million and wants to establish a data science function. The first thing they care most about is creating a recommender system.
Zookla hires a data scientist to deal with this on a six-month contract.
Analysis: Tesseract Academy’s 2-Actor Model
We will analyze the project from the perspective of Tesseract Academy’s 2-actor model. Here is a reminder of the process:
1. Problem definition
a. Domain expert
2. Choosing the right data (data management)
a. Domain expert
b. Data scientist
3. Solution of the problem
a. Data scientist
4. Creating value through actionable insights
a. Data scientist AND domain expert
So, let’s see the good and the bad scenario for each step.
Problem Definition: Good Scenario
In a good scenario, the CEO has a good idea of what a recommender system is and how it could improve profits. The CEO also has a good idea of what this would look like on the screen. There are many ways to present a recommender system. For example, Amazon uses the following two ways: “frequently bought together” and “customers who bought this also bought,” As depicted in Figure 3.4.

Figure 3.4 Example of the Amazon recommender system in action

Figure 3.5 Examples of the Spotify recommender system in action
Spotify, on the other hand, creates custom playlists based on the songs you like, as shown in Figure 3.5.
And obviously, there are many other ways to present recommendations, such as a list or tiles (e.g., Netflix).
The way recommendations are presented interacts with the UI/UX (User Interface/User Experience). And the way the UX/UI is designed affects how the data is collected. It’s essential to be aware of these interplays.
Also, finally, it helps if the CEO has good intuition or the company has done some preliminary research on useful patterns (e.g., customer segmentation). These can not only help inform the design of a recommender system, but they can also be used to create a simple rule-based recommender that could be used as a benchmark for a more advanced version.
Problem Definition: Bad Scenario
In the bad scenario, the CEO falls into one of these two groups:
1. They say they “want to do something useful with data,” but they are not sure what that is.
2. They say they want a recommender system, but they are oblivious to all the details and issues that this entails.
The first scenario is pretty common and most data scientists would be prepared for it. In this case, the data scientist will take some time to explain data science to the CEO, learn more about the business, and discover the best way forward. The CEO would have been better off if they had done this preparatory work before hiring a data scientist because the result is one to two months of work.
The second case is much trickier. The CEO might be confident in what they want, but they might be ignoring a lot of critical topics:
1. They might be ignoring the interaction between the recommender system and UX/UI in how results are displayed and how data are collected.
2. They have no real understanding of their customers.
3. They are not sure what metrics they are after. What would success look like for this project?
So, the first point can be a huge problem if, for example, the website requires an extensive redesign to display recommendations and collect relevant data. Points 2 and 3 often come together. Sometimes, there is lots of enthusiasm about a project, but the client does not really know what they’re looking for. Is it simply more sales? More engagement? How much more?
It is not possible to forecast the level of success. However, it is not uncommon for a project to finish and for the client to realize they are not happy with the results because they couldn’t verbalize their expectations from the onset. For example, if a client believes that a recommender system would double sales, this is likely unrealistic. The data scientist could explain what might be more feasible or how they could create a constantly improving system.
There are cases where clients hold latent beliefs about the expectations surrounding new AI systems, but even they are not aware of them until the last minute when things don’t seem to be going the way they wanted them to go.
Case Study 2: Forecasting Demand
Forecasting demand is a common problem in industries like retail. If a business can successfully do it, it can optimize its supply chains and orders to maximize margins. Let’s take the example of Leotard Clothes. This is a retailer that sells cat-inspired clothes.
They have limited space in their warehouses, and producing clothes takes a significant amount of time and resources due to the special fabrics used. Also, they use many outside contractors, which means that costs will vary according to manufacturing volume. Manufacturing more clothes than the demand will significantly increase monthly costs, but if they manufacture fewer clothes, the company can still make a profit. Another issue with contractors is that there were shortages of material in some cases. Leotard Clothes would ideally like to preorder fabric a few months in advance.
Hence for them, predicting demand is vital so that they know how many clothes to manufacture each month.
Let’s see how Leotard Clothes can use the CRISP-DM approach to forecast demand.
Analysis: CRISP-DM
Let’s revisit the CRISP-DM process. Six main phases are described as part of the CRISP-DM process (Figure 3.6):
1. Business Understanding
2. Data Understanding

Figure 3.6 Six main phases of the CRISP-DM process
3. Data Preparation
4. Modeling
5. Evaluation
6. Deployment
The first step (business understanding) is key. While forecasting is what the company wants to do, it wants to do this within the context of its operations. This means that forecasting demand is being used to optimize the allocation of resources.
This step is directly connected to the fifth step (evaluation). Why is that? Because when evaluating a ML pipeline, we need to identify how results are translated into business actions. Since forecasting is a regression problem, the reported metrics will be something like the Mean Absolute Error or the Root Mean Squared Error. But what is a good score? This is very much business related.
There are domains where a difference of 1 percent in performance can translate into millions of dollars. In other fields, a difference of 5 percent might not mean much. In this particular example, the interest is in ensuring the following:
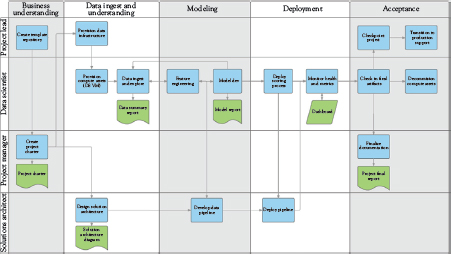
Figure 3.7 Example of the Teams Data Science Process
1. There is enough space in the warehouse.
2. Point 1 requires that the clothes are sold, and there is enough demand.
3. Point 1 also requires that the materials ordered align with the demand.
Hence, while we are predicting demand, the key challenge is how to make sure that the warehouse has enough space. So, this should be our main focus.
The rest of the steps in CRISP-DM are pretty standard in any data science project. Most data scientists will follow a similar process, even if they do not explicitly phrase it. We leave the analysis here because the Teams Data Science Process (discussed in Figure 3.7) covers some of these steps in greater depth.
Case Study 3: Natural Language Processing
Let’s see how we could use the Teams Data Science Process to break down a given problem. Suppose we are dealing with an online clothes retailer called Zappo. The company is interested in running natural language processing on its social media accounts to better understand how they could be improved.
The first thing we notice is that there are four actors:
1. Project lead
2. Data scientist
3. Project manager
4. Solution architect
According to the process, the solution architect is responsible for ensuring a proper business understanding within the company. The process also defines some technical tasks that need to be achieved. For example, in the first step, the repository is created by the project lead instead of the data scientist, hence clearly separating responsibilities between the different roles.
In our case, the project lead needs to define what would be measured. For example, the company could choose to measure:
1. Sentiment analysis on user comments about its products.
2. Prediction of post engagement.
3. Time series analysis of engagement metrics.
So, we can immediately see that a general task of “using NLP to study social media” immediately breaks down into multiple different tasks. Each task should be treated separately. So, we can assume that the company in this use case decided to focus on the first task and go with sentiment analysis.
The second stage of the process involves the data scientist, who is responsible for producing a report. You can see that the first output of the data scientist is something that can be easily communicated to the management. The process clearly places significant emphasis on business understanding. At the same time, the solution architect will start working on the deployment specifics. In our case, this would be about the choice of database, setting up APIs to extract data from social media, and so on.
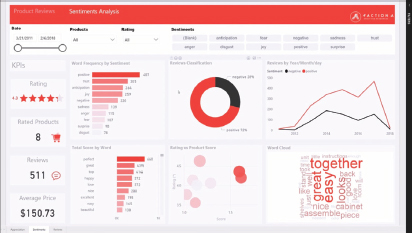
Figure 3.8 A sentiment analysis dashboard
Source: Faction A 2018
The third step, modeling, consists of the data scientist running various sentiment analyses algorithms and comparing them. The output of this stage is a model report. Again, this helps keep track of how the project is progressing and communicating value to the business stakeholders.
The fourth step is deployment. In the third and the fourth steps, the main actors are the data scientist and the solution architect. The results, in this case, are communicated through a dashboard. The dashboard in our example could contain things such as classifications of reviews and a word cloud (Figure 3.8).
In the final stage, acceptance, the project lead and the project manager come back into play and bring everything together. A final report, written by the project manager, ensures that everything has been documented and the project can be finalized.
Case Study 4: Computer Vision and Algorithmic Bias
This case study will investigate three interesting challenges: computer vision, algorithmic bias, and data privacy.
Let’s say that you are developing a piece of software that can extract information about the people in a retail store by using cameras installed in the store. This application can be used to calculate not only footfall but also the characteristics of the different people in the store, such as gender, age, race, and so on.
You have decided that you will use a commoditized solution for computer vision such as Google Vision or IBM Watson.
Something important to note here is that this is a special case. The reason is that this use case also touches upon issues of compliance, regulation, and ethics. Let’s see why:
First, the company will have to make sure that the individuals’ private data is not stored. This refers to the actual images or inferences made about an individual, such as age. It is likely that, depending on the geographical region, the exact legal requirements will be different, but there will undoubtedly be various legal complications.
Secondly, the application should make sure that it is not biased against certain types of people. It is well known that computer vision algorithms can be biased against minorities. A famous article by Time demonstrated how a computer vision API might mistake Oprah Winfrey for a man, for example (“Artificial Intelligence Has a Problem With Gender and Racial Bias” n.d.).
Given that the main challenges here touch upon different parts of the business, Tesseract Academy’s 2-actor model could be very useful. The benefit of this model is that it is very flexible, so it can also be applied in circumstances where the challenge is not only of a technical nature. The key point behind this process is that it lays out all the challenges that the project might face. Therefore, the decision maker and the data scientist can make sure they are on the same page when tackling a particular challenge.
Analysis: Tesseract Academy’s 2-Actor Model
So, let’s revisit the process.
1. Problem definition
a. Domain expert
2. Choosing the right data
a. Domain expert
b. Data scientist
3. Solution of the problem
a. Data scientist
4. Creating value through actionable insights
a. Data scientist AND domain expert
Problem Definition. In this particular case, the core problem definition is clear. The business owner wants to know specific statistics about the people in a store, such as gender, age, and race.
However, the core problem definition needs to be extended. We also need to add:
1. Data privacy
2. Elimination of bias
These points are going to inform the solution to the problem.
The decision maker has also defined that the business should go for a commoditized solution, instead of developing their own solution internally.
Choosing the Right Data. In this case, the data is a direct feed coming from cameras located inside the store. Therefore, the cameras must be of high quality, and the network must have enough bandwidth to feed the data to the API.
Data privacy falls under this step. Remember that data management involves both the decision maker and the data scientist. While the data scientist is responsible for the technical aspects, the decision maker needs to ensure that the business is compliant.
What they both need to decide upon is how the data can be fed to the API and what are the implications of the different choices. Is the data going to be stored somewhere and then sent? Or is it going to be sent in real time? How does this affect costs for data storage and network usage?
Solution to the Problem. Given the extended problem definition and the constraints imposed by the decision maker, the data scientist has to define the right solution and come up with an attack plan. In this case, the attack plan does not involve data analysis but rather the comparison of different solutions in the market.
More specifically, the data scientist will have to run A/B tests between all major computer vision service providers and identify which ones seem to work best. The data scientist might have to go to the store and test these systems in real time in realistic conditions.
Creating Value Through Actionable Insights. Typically, actionable insights are derived after data has been analyzed. In this case, the data scientist and the decision maker will have to constantly monitor the system or the first few months of operation to ensure it works as expected. All sorts of problems could arise that could affect the result, but that might not be related to the API, such as issues with the cameras.
The following Table 3.3 summarizes all of the above insights.
Table 3.3 Summary of Tesseract Academy’s 2-actor model
Problem definition | 1. Get statistics 2. Data privacy 3. No bias |
Choosing the right data (data management) | 1. Data feed from cameras 2. Data privacy |
Solution of the problem | 1. Discover the best API 2. Test APIs in realistic conditions |
Creating value through actionable insights | 1. Ensure that the API works as expected 2. Revisit the model if required |
Key Takeaways
• Data strategy is defined as “a living document that defines how the business is setting itself up, both from a technical and organizational perspective, to proactively manage and leverage data towards the long-term business strategy.”
• Data science development is different to software development. Managing a data science project requires following a data science process.
• There are different processes for data science, some popular ones being CRISP-DM and the Tesseract Academy’s 2-actor process.