
Chapter 3
Foundational Network Programmability Methods
This chapter covers the following topics:
Controller-Based Network Design
Configuration Management Tools
Command-Line Interface (CLI)
There are many different ways to connect to and manage your network. The most common method is to use the command-line interface, or CLI. This has been the most widely used way to configure your network for the last 30 years. However, the CLI, like anything, else has its pros and cons. Perhaps one of the most glaring and biggest flaws with using the CLI to manage your network is misconfiguration. Oftentimes, businesses have a high frequency of change in their network environment, and some of those changes can be extremely complex. When businesses have increased complexity in their network, the cost of something failing can be very high. This can stem from the increased time it takes to troubleshoot the issues in a complex network.
Failure in a network, however, doesn’t necessarily mean software or a hardware component is to blame. A majority of network outages are caused by human beings. The causes for these outages are from misconfigurations due to a lack of understanding the complexity of a given network. Although not all outages or failures can be avoided, there are tools that can assist in lowering the number of outages caused by human error due to misconfigurations in the CLI. These tools will be discussed later in this chapter. Table 3-1 shows a brief list of common pros and cons associated with using the CLI.
Pros |
Cons |
Well known and documented. |
Difficult to scale. |
Commonly used method. |
Large amount of commands. |
Commands can be scripted. |
Inflexible (you must know the command syntax). |
Syntax help is available on each command. |
Can be slow to execute commands. |
Connection to the CLI can be encrypted (SSH). |
Not intuitive. |
|
Can only execute a command at time. |
|
CLI and commands can change between software versions and platforms. |
|
Using the CLI can pose a security threat if you’re using Telnet (clear text). |
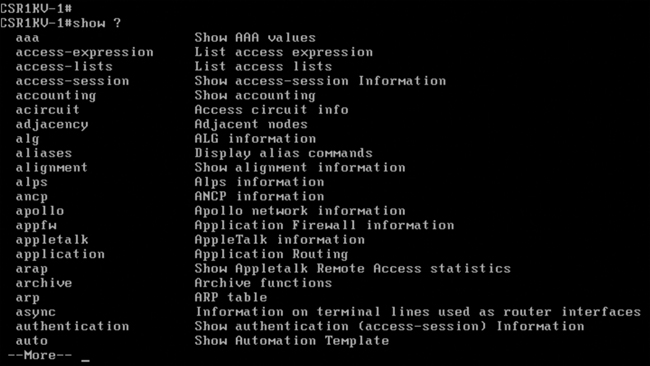
Context sensitive help is a structure built in to the Cisco CLI. When “?” is issued after each command, all available configuration help in that subconfiguration mode is displayed. Figure 3-1 illustrates the context sensitive help available for the show command.
Application Programming Interface (API)
Another very popular method of communicating with and configuring your network is through the use of application programming interfaces, or APIs. APIs are used to communicate with various components of the network through software, and you can use these APIs to configure or monitor specific components of the network. There are multiple different types of APIs. However, the focus of this chapter will be on two of the most common APIs: northbound and southbound APIs. The following sections explain the differences between the two through the lens of network automation.
Northbound API
Northbound APIs are often used to communicate from a network controller to its management software. For example, Cisco DNA Center has a software graphical user interface (GUI) that is used to manage its own network controller. Typically, when a network operator logs in to a controller to manage their network, the information that is being passed from the management software is leveraging a northbound API. Best practices suggest that the traffic is encrypted between the software and the controller. Most types of APIs have the ability to use encryption to secure the data in flight.
Southbound API
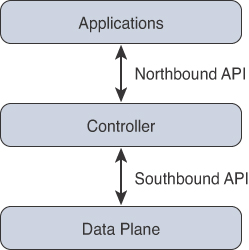
An example of a southbound API would be when a network operator makes a change to a switch’s configuration in the management software of the controller. Those changes would then be pushed down to the individual devices using a southbound API. These devices can be routers, switches, or even wireless access points. APIs interact with the components of your network through the use of a programmatic interface. Figure 3-2 illustrates the basic operations of a northbound API and a southbound API.
Representational State Transfer APIs (REST)
An API that uses REST is often referred to a RESTful API. What does this mean? RESTful APIs use HTTP methods to gather and manipulate data. Because there is a defined structure on how HTTP works, it offers a consistent way to interact with APIs from multiple vendors. REST uses different HTTP functions to interact with the data. Table 3-2 lists some of the most common HTTP functions and their associated use cases.
Table 3-2 HTTP Functions and Example Use Cases
HTTP Function |
Action |
Use Case |
GET |
Requests data from a destination |
Viewing a website |
POST |
Submits data to a specific destination |
Submitting login credentials |
PUT |
Replaces data at a specific destination |
Updating an NTP server |
PATCH |
Appends data to a specific destination |
Adding an NTP server |
DELETE |
Removes data from a specific destination |
Removing an NTP server |
HTTP functions are very similar to the functions that most applications or databases use to store or alter data, whether it is stored in a database or within the application itself. These functions are called “CRUD” functions. CRUD is an acronym that stands for CREATE, READ, UPDATE, and DELETE. For example, in a SQL database, the CRUD functions are what are used to interact with or manipulate the data stored in the database. Table 3-3 lists the CRUD functions and their associated actions and use cases.
Table 3-3 CRUD Functions and Example Use Cases
HTTP Function |
Action |
Use Case |
CREATE |
Inserts data inside a database or application |
Adding information to a database |
READ |
Retrieves data from a database or application |
Reading information from a database |
UPDATE |
Modifies or replaces data in a database or application |
Changing a street address stored in a database |
DELETE |
Removes data from a database or application |
Removing a customer from a database |
Tools and Resources
Whether you are trying to learn how APIs interact with applications or controllers, to test code and outcomes, or are wanting to become a full-time developer, one of the most important pieces of interacting with any software via APIs is testing. Testing your code helps to ensure you are accomplishing the desired outcome that you hoped to achieve when executing the code. This section covers some tools and resources that will help you practice using APIs and REST functions. This also helps hone your coding skills in becoming a more efficient network engineer.
Introduction to Google Postman
Earlier, this chapter mentioned being able interact with a software controller using RESTful APIs. It also discussed being able to test your code to see if the desired outcomes are accomplished when executing it. Please keep in mind that APIs are software interfaces into an application or a controller. This means just like with any other device, you will need to authenticate to gain access to utilize the APIs. However, once you are authenticated, any changes you have access to make via the APIs will impact that application. This means that if you use a REST API call to delete data, that data will be removed from the application or controller, just as if you logged in to the device via the CLI and deleted the data. It is a best practice to use a test lab or the Cisco DevNet sandbox while learning or practicing any of these concepts. This way, there will be no accidental impact to your production environment.
Note
Cisco DevNet is covered in an upcoming DevNet section of this chapter.
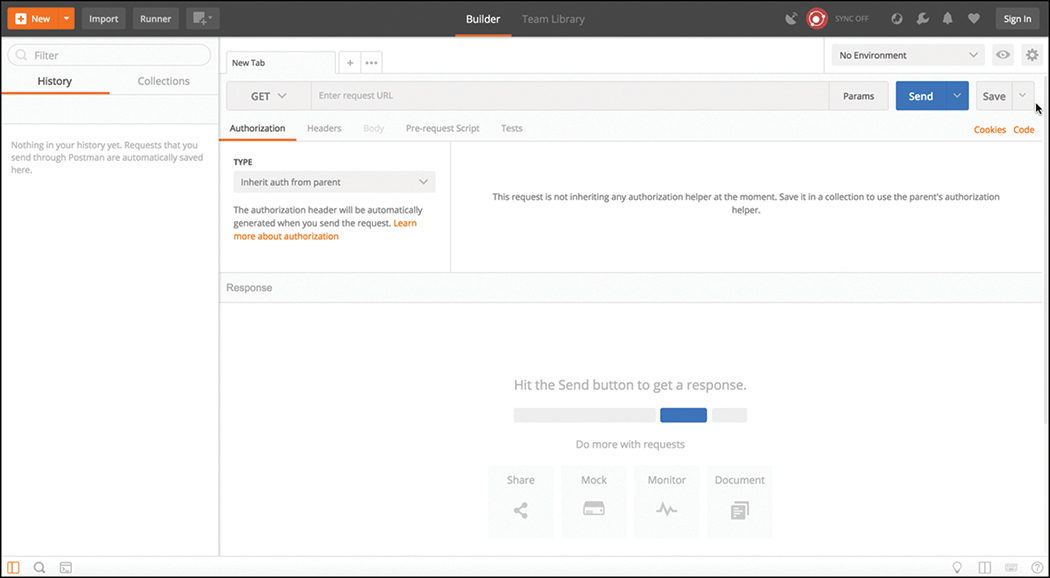
Google has an application called Postman that allows us to interact with APIs using a console-based approach. Postman allows us to use various data types and formats to interact with REST-based APIs. Figure 3-3 depicts the main Google Postman application dashboard.
Note
The screenshots of Google Postman used at the time of this writing may differ from the currently available version.
Within the Postman application, you can see the various sections you can interact with. Under the default configuration, the focus will be on using the “Builder” portion of the dashboard. The following sections are the ones that will require the most focus of our attention:
History tab
Collections window
New tab
URL bar
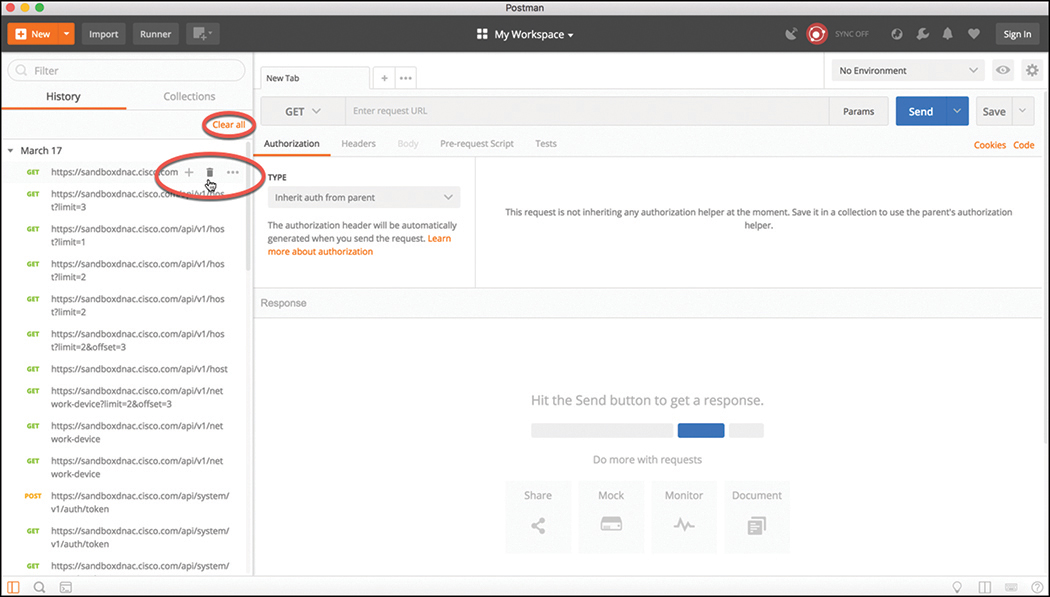
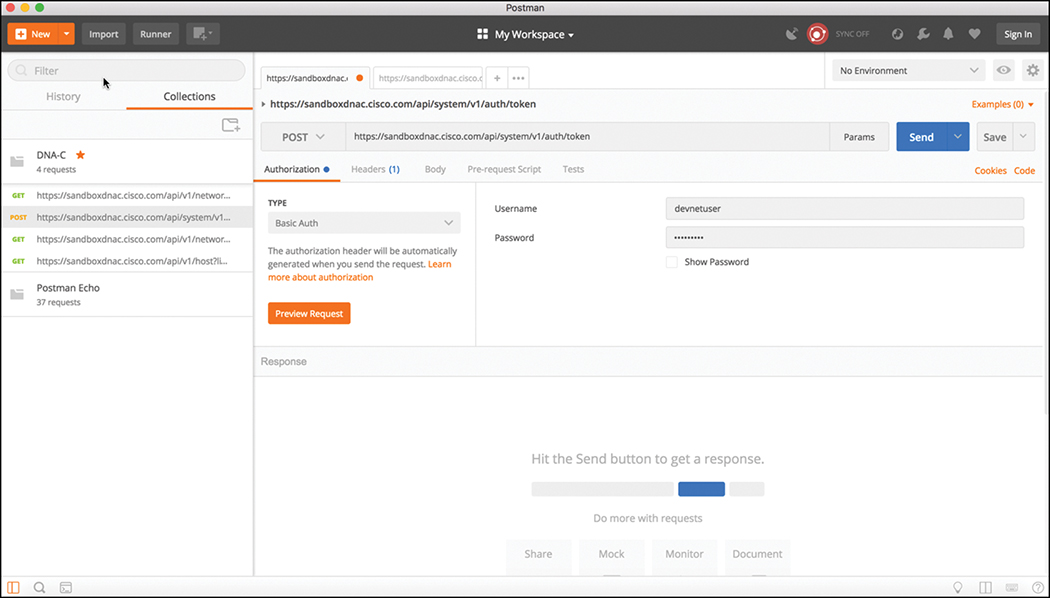
The History tab will show a list of all the recent API calls that were made using Postman. You have the option to clear your entire history at any time should you want to remove the complete list of API calls that have been made. This is done by clicking the “Clear all” link at the top of the Collections window. You also have the ability to remove individual API calls from the history list by simply hovering the mouse over the API call and clicking the trash can icon from the submenu that pops up. An example of this is shown in Figure 3-4.
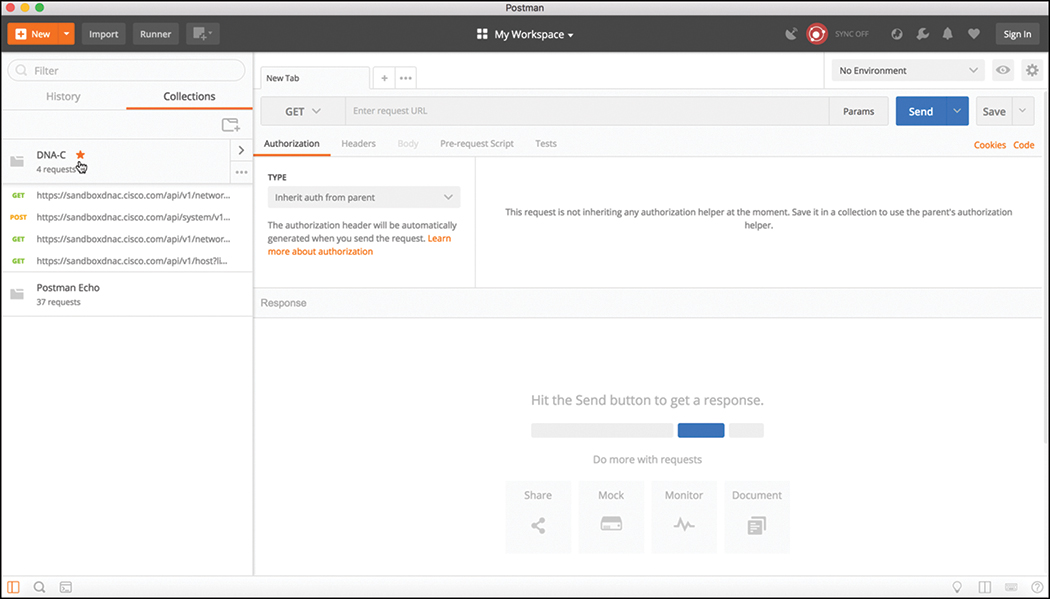
API calls can be stored into groups that are specific to a structure that fits your needs. These groups are called “collections.” Collections can follow any naming convention and appear as a folder hierarchy. For example, it’s possible to have a collection called DNA-C to store all of your DNA Center API calls in. This helps during testing phases, as API calls can easily be found and sorted by saving them into a collection. You can also select the collection to be a favorite by clicking the star icon to the right of the collection’s name. Figure 3-5 illustrates a collection called DNA-C that is selected as a favorite.
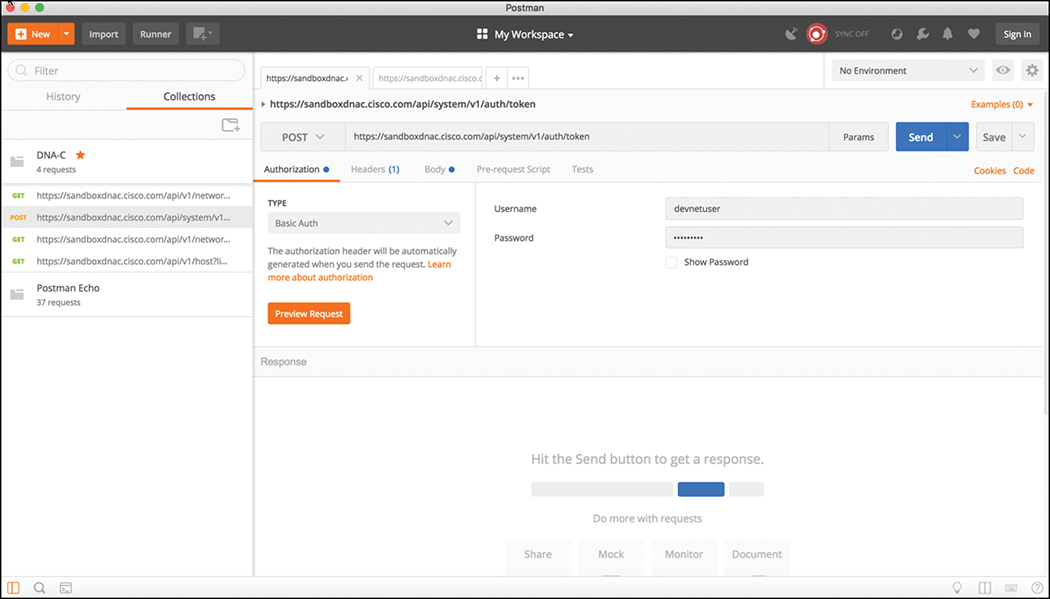
Tabs are another very convenient way to work with various API calls. Each tab can have its own API call and parameters that are completely independent of any other tab. For example, this means you can have one tab open with API calls interacting with the DNA Center controller and another tab open that is interacting with a completely different platform, such as a Cisco Nexus switch. This is because each tab has its own URL bar to be able to use a specific API. Remember that an API call using REST is very much like an HTTP transaction. Each API call in a RESTful API maps back to an individual URL for a particular function. This means every configuration change or poll to retrieve data you make in a REST API has a unique URL for it, regardless of whether is a GET, POST, PUT, PATCH, or DELETE function. Figures 3-6 and 3-7 illustrate two different tabs using unique URLs for different API calls.
Data Formats (XML and JSON)
Now that the Postman dashboard has been shown, it’s time to discuss two of the most common data formats used with RESTful APIs. The first one is called Extensible Markup Language (XML). This format may look familiar because it is the same format that is commonly used when constructing web services. XML is a tag-based language. This means that when you enter a tag within XML, it must begin with the < symbol. This also means it must end with the > symbol as well. For example, if you wanted to create a start tag named “interface,” it would be represented as <interface>. One rule that goes along with XML is that if you start a section, you must end it. Or, in other words, for every beginning there is an end. Because you created a start tag called <interface>, the section will need to be closed by using an end tag. The end tag must contain the string of the start tag you are working with, followed by a / character. In this example, the end tag for <interface> would be <interface/>. Now that there is a start tag and an end tag, different types of code and parameters can be put inside or in between the tags. Example 3-1 depicts a snippet of XML output with both start and end tags as well as some various configuration parameters.
        <users>
           <user>
             <name>root</name>
           </user>
           <user>
             <name>Jason</name>
           </user>
           <user>
             <name>Jamie</name>
           </user>
           <user>
             <name>Luke</name>
           </user>
         </users>
Notice that each section of Example 3-1 has a start tag and an end tag. The data is structured within a section called “users” that contains the following four individual users:
root
Jason
Jamie
Luke
Before and after each username is a start tag called <user> and an end tag called <user/>. The output also contains a start tag called <name> and an end tag called <name/>. These items start and end the tag that contains the actual user’s name. If you wanted to create another section to add on, you could simply follow the same logic as used in the previous example and build out more XML code. A key thing to keep in mind is that indentation of your XML sections is very important. For instance, if you didn’t use indentation, it would be much harder to read and follow each section in the XML output. This is why XML has been deemed so easy to read. Not only can humans read it, but applications can also read it. Another very common XML snippet is one that shows available interfaces on a device, such as a router or a switch. The Example 3-2 snippet, however, shows an XML code snippet without indentation to illustrate the difference in legibility. Although indentation is not required, it is certainly a recommended best practice.
Example 3-2 Source Code for SIMPLE: A Very Simple OpenGL Program
        <interfaces>
         <interface>
         <name>GigabitEthernet1</name>
         </interface>
         <interface>
         <name>GigabitEthernet11</name>
         </interface>
         <interface>
         <name>Loopback100</name>
         </interface>
         <interface>
         <name>Loopback101</name>
         </interface>
         </interfaces>
The second data format that is important to cover is called JavaScript Object Notation (JSON). Although JSON has not been around as long as XML, it is currently taking the industry by storm. This data format is gaining popularity because it can be argued that JSON is much easier to work with than XML. It is simple to read and create, and the way the data is structured is much cleaner. JSON stores all its information in key-value pairs. There is much debate about whether JSON will eventually replace XML. Much like with XML, data that is indented is much cleaner in appearance and more legible. However, even without indentation, JSON is extremely easy to read. Like the name suggests, JSON uses objects for its format. Unlike XML, JSON objects start with { and end with }. These are commonly referred to as curly braces. Example 3-3 shows the same username example shown earlier in the XML section, but now in JSON format. It also can be read as having four separate key-value pairs—one for each user’s name.
{
  "user": "root",
  "user": "Jason",
  "user": "Jamie",
  "user": "Luke"
}
In the case of this JSON code snippet, you can see that the key used is “user” and the value for each key is a unique username.
Now that the XML and JSON data formats have been explained, it is important to circle back to actually using the REST API and the associated responses and outcomes of doing so. First, covering the different HTTP response codes and their importance is of top priority. Most Internet users have experienced navigating to a website and getting the dreaded “404 Not Found” error. What might not be clear to the users is what that error actually means. Table 3-4 lists the most common HTTP response codes as well as the reasons users may receive each one.
HTTP Status Code |
Result |
Common Reason for Response Code |
200 |
OK |
Using a GET or POST to exchange data with an API. |
201 |
Created |
Creating resources via a REST API call. |
400 |
Bad Request |
Request failed because of a client-side issue. |
401 |
Unauthorized |
Client not authenticated to access site or API call. |
403 |
Forbidden |
Access not granted based on supplied credentials. |
404 |
Not Found |
Page at HTTP URL location does not exist or is hidden. |
The first example covered in this section is the DNA Center Token API mentioned earlier in this chapter. The DNA Center Controller expects all incoming data from the REST API to be in JSON format. It is also important to note that the HTTP POST function is used to send the credentials to the DNA Center Controller. DNA Center uses an authorization concept of Basic Auth to pass a username and password to the DNA Center Token API to authenticate users. This API is used to authenticate users to the DNA Center Controller in order to make additional API calls. Just as users do when logging in to a device via the CLI, if the platform secured properly, they should be prompted for login credentials. The same method applies to using an API to authenticate to software. The key pieces of information necessary to successfully set up the API call in Postman are as follows:
In the URL bar, enter https://sandboxdnac.cisco.com/api/system/v1/auth/token to target the Token API.
Select the HTTP POST operation in the drop-down box.
Ensure under the Authorization tab that the type is set to Basic Auth.
Enter a username of devnetuser and a password of Cisco123!.
Select the Headers tab and enter Content-Type as the Key setting.
Select application/json as the Value setting.
Once Postman has been set up, you will need to select the Send button to pass the credentials to the DNA Center Controller via the Token API. Figure 3-8 illustrates the Postman setup required to authenticate with the DNA Center Controller.
Once you successfully authenticate to the DNA Center Controller, you will receive a “token” that contains a string similar to the following:
"eyJ0eXAiOiJKV1QiLCJhbGciOiJIUzI1NiJ9.eyJzdWIiOiI1YTU4Y2QzN2UwNWJiYTA
wOGVmNjJiOTIiLCJhdXRoU291cmNlIjoiaW50ZXJuYWwiLCJ0ZW5hbnROYW1lIjoiVE5UM
CIsInJvbGVzIjpbIjVhMzE1MTYwOTA5MGZiYTY5OGIyZjViNyJdLCJ0ZW5hbnRJZCI6I
jVhMzE1MTlkZTA1YmJhMDA4ZWY2MWYwYSIsImV4cCI6MTUyMTQ5NzI2NCwidXNlcm5hb
WUiOiJkZXZuZXR1c2VyIn0.tgAJfLc1OaUwaJCX6lzfjPG7Om2x97oiTIozUpAzomM"
This token is needed for all future API calls to the DNA Center Controller. Think of it as a hash that is generated from your login credentials. This token will change every time an authentication is made to the DNA Center Controller. It is important to remember that once you are authenticated, the token you receive will be only usable for your current authenticated session to the controller. If another user authenticates via the Token API, they will receive a unique token in order for them to be able to utilize the APIs based on their login credentials. Figure 3-9 shows the response from DNA Center by issuing the POST operation to the Token API.
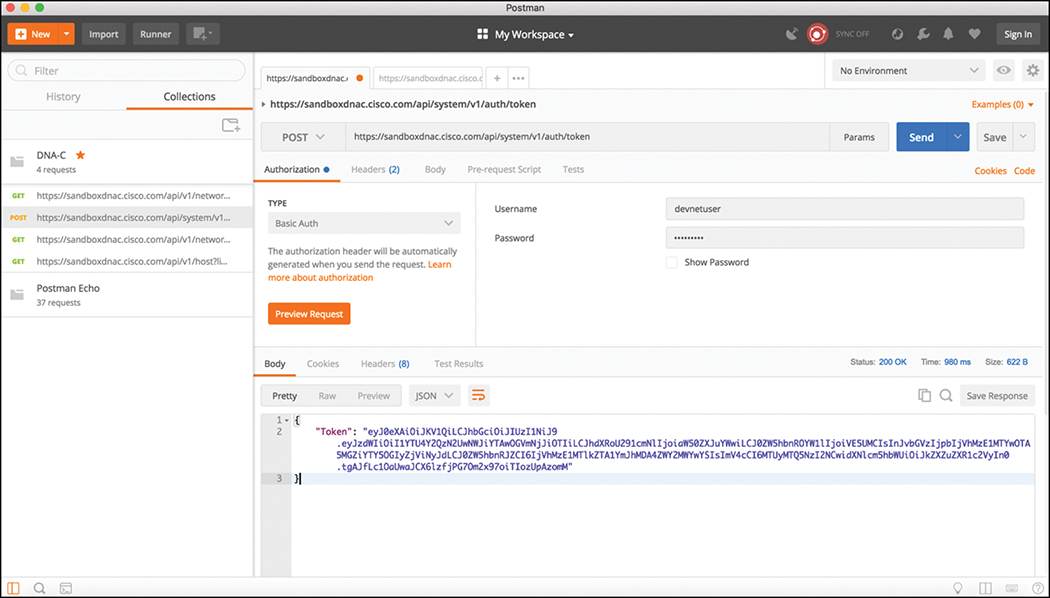
You can see that an HTTP Status code of “200 OK” was received from the DNA Center Controller. Based on Table 3-4, you know that an HTTP Status code of 200 means that the API call completed successfully. In addition, you can also see how long it took to process the HTTP POST request. In this case, it was 980ms.
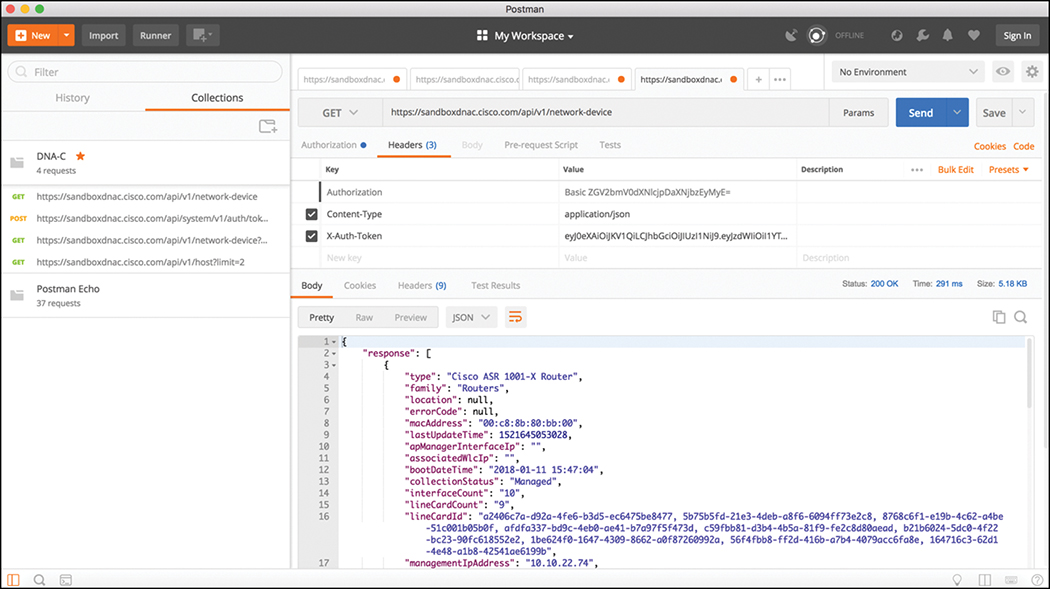
Now that you have successfully authenticated to the DNA Center Controller, you can now look at some of the other available API calls. The first API call covered in this section is the Network Device API, which allows users to retrieve a list of devices currently in inventory that are being managed by the DNA Center Controller. The first step is to prepare Postman to use the token that was generated when you authenticated to the controller. The following steps are necessary to leverage Postman to utilize the Network Device API:
Copy the token and click a new tab in Postman.
In the URL bar, enter https://sandboxdnac.cisco.com/api/v1/network-device to target the Network Device API.
Select the HTTP GET operation in the drop-down box.
Select the Headers tab and enter Content-Type as the Key setting.
Select application/json as the Value setting.
Add another key and enter X-Auth-Token.
Paste the token in as the value.
The last step is to click Send to pass the token to the DNA Center Controller and perform an HTTP GET to retrieve a device inventory list using the Network Device API. Figure 3-10 illustrates the proper setup of Postman to use the Network Device API.
Note
The token will be different from the one in this book. It is unique to each authenticated user.
Based on the response received from the DNA Center Controller, you can see that you not only received an HTTP Response code of 200 OK, you also successfully retrieved the device inventory. Example 3-4 shows a list of devices in the inventory that were pulled via the Network Device API.
Example 3-4 Device Inventory Pulled via the Network Device API Call in Google Postman
{
    "response": [
        {
            "type": "Cisco ASR 1001-X Router",
            "family": "Routers",
            "location": null,
            "errorCode": null,
            "macAddress": "00:c8:8b:80:bb:00",
            "lastUpdateTime": 1521645053028,
            "apManagerInterfaceIp": "",
            "associatedWlcIp": "",
            "bootDateTime": "2018-01-11 15:47:04",
            "collectionStatus": "Managed",
            "interfaceCount": "10",
            "lineCardCount": "9",
            "lineCardId": "a2406c7a-d92a-4fe6-b3d5-ec6475be8477, 5b75b5fd-
                     21e3-4deb-a8f6-6094ff73e2c8, 8768c6f1-e19b-4c62-a4be-51c001b05b0f,
                     afdfa337-bd9c-4eb0-ae41-b7a97f5f473d, c59fbb81-d3b4-4b5a-81f9-
                     fe2c8d80aead, b21b6024-5dc0-4f22-bc23-90fc618552e2, 1be624f0-
                     1647-4309-8662-a0f87260992a, 56f4fbb8-ff2d-416b-a7b4-4079acc6fa8e,
                     164716c3-62d1-4e48-a1b8-42541ae6199b",
            "managementIpAddress": "10.10.22.74",
            "memorySize": "3956371104",
            "platformId": "ASR1001-X",
            "reachabilityFailureReason": "",
            "reachabilityStatus": "Reachable",
            "series": "Cisco ASR 1000 Series Aggregation Services Routers",
            "snmpContact": "",
            "snmpLocation": "",
            "tunnelUdpPort": null,
            "waasDeviceMode": null,
            "locationName": null,
            "role": "BORDER ROUTER",
            "hostname": "asr1001-x.abc.inc",
            "upTime": "68 days, 23:23:31.43",
            "inventoryStatusDetail": "<status><general code="SUCCESS"/></status>",
            "softwareVersion": "16.6.1",
            "roleSource": "AUTO",
            "softwareType": "IOS-XE",
            "collectionInterval": "Global Default",
            "lastUpdated": "2018-03-21 15:10:53",
            "tagCount": "0",
            "errorDescription": null,
            "serialNumber": "FXS1932Q1SE",
            "instanceUuid": "d5bbb4a9-a14d-4347-9546-89286e9f30d4",
            "id": "d5bbb4a9-a14d-4347-9546-89286e9f30d4"

        },
        {
            "type": "Cisco Catalyst 9300 Switch",
            "family": "Switches and Hubs",
            "location": null,
            "errorCode": null,
            "macAddress": "f8:7b:20:67:62:80",
            "lastUpdateTime": 1521644291747,
            "apManagerInterfaceIp": "",
            "associatedWlcIp": "",
            "bootDateTime": "2018-01-11 14:42:33",
            "collectionStatus": "Managed",
            "interfaceCount": "41",
            "lineCardCount": "2",
            "lineCardId": "feb42c9f-323f-4e17-87d3-c2ea924320cb, 0f0c473e-b2e0-
               4dcf-af11-9e7cf7216473",
            "managementIpAddress": "10.10.22.66",
            "memorySize": "889225360",
            "platformId": "C9300-24UX",
            "reachabilityFailureReason": "",
            "reachabilityStatus": "Reachable",
            "series": "Cisco Catalyst 9300 Series Switches",
            "snmpContact": "",
            "snmpLocation": "",
            "tunnelUdpPort": null,
            "waasDeviceMode": null,
            "locationName": null,
            "role"  : "ACCESS",
            "hostname":   "cat_9k_1.abc.inc",
            "upTime": "69 days, 0:15:51.44",
            "inventoryStatusDetail": "<status><general code="SUCCESS"/></status>",
            "softwareVersion": "16.6.1",
            "roleSource": "AUTO",
            "softwareType": "IOS-XE",
            "collectionInterval": "Global Default",
            "lastUpdated": "2018-03-21 14:58:11",
            "tagCount": "0",
            "errorDescription": null,
            "serialNumber": "FCW2136L0AK",
            "instanceUuid": "6d3eaa5d-bb39-4cc4-8881-4a2b2668d2dc",
            "id": "6d3eaa5d-bb39-4cc4-8881-4a2b2668d2dc"
        },
        {
            "type": "Cisco Catalyst 9300 Switch",
            "family":            "Switches and Hubs",
            "location": null,
            "errorCode":  null,
            "macAddress": "f8:7b:20:71:4d:80",
            "lastUpdateTime": 1521644755520,
            "apManagerInterfaceIp": "",
            "associatedWlcIp": "",
            "bootDateTime": "2018-01-11 14:43:33",
            "collectionStatus": "Managed",
            "interfaceCount": "41",
            "lineCardCount": "2",
            "lineCardId": "789e00f9-f52d-453d-86c0-b18f642462ee, 242debfd-ff6c-
               4147-9bf6-574e488c5174",
            "managementIpAddress": "10.10.22.70",
            "memorySize": "889225280",
            "platformId": "C9300-24UX",
            "reachabilityFailureReason": "",
            "reachabilityStatus": "Reachable",
            "series": "Cisco Catalyst 9300 Series Switches",
            "snmpContact": "",
            "snmpLocation": "",
            "tunnelUdpPort": null,
            "waasDeviceMode": null,
            "locationName": null,
            "role"  : "ACCESS",
            "hostname":   "cat_9k_2.abc.inc",
            "upTime": "69 days, 0:22:17.07",
            "inventoryStatusDetail": "<status><general code="SUCCESS"/></status>",
            "softwareVersion": "16.6.1",
            "roleSource": "AUTO",
            "softwareType": "IOS-XE",
            "collectionInterval": "Global Default",
            "lastUpdated": "2018-03-21 15:05:55",
            "tagCount": "0",
            "errorDescription":   null,
            "serialNumber": "FCW2140L039",
            "instanceUuid": "74b69532-5dc3-45a1-a0dd-6d1d10051f27",
            "id": "74b69532-5dc3-45a1-a0dd-6d1d10051f27"
        },
        {
            "type": "Cisco Catalyst38xx stack-able ethernet switch",
            "family": "Switches and Hubs",
            "location": null,
            "errorCode":  null,
            "macAddress": "cc:d8:c1:15:d2:80",
            "lastUpdateTime": 1521644825918,
            "apManagerInterfaceIp": "",
            "associatedWlcIp": "",
            "bootDateTime": "2018-01-11 15:20:34",
            "collectionStatus": "Managed",
            "interfaceCount": "59",
            "lineCardCount": "2",
            "lineCardId": "15d76413-5289-4a99-98b6-fcacfe76b977, f187f561-9078-
               4f30-b1a1-c6c6284bd075",
            "managementIpAddress": "10.10.22.69",
            "memorySize": "873744896",
            "platformId": "WS-C3850-48U-E",
            "reachabilityFailureReason": "",
            "reachabilityStatus": "Reachable",
            "series": "Cisco Catalyst 3850 Series Ethernet Stackable Switch",
            "snmpContact": "",
            "snmpLocation": "",
            "tunnelUdpPort":   null,
            "waasDeviceMode": null,
            "locationName":   null,
            "role": "CORE",
            "hostname": "cs3850.abc.inc",
            "upTime": "65 days, 11:23:52.43",
            "inventoryStatusDetail": "<status><general code="SUCCESS"/></status>",
            "softwareVersion": "16.6.2s",
            "roleSource": "MANUAL",
            "softwareType": "IOS-XE",
            "collectionInterval": "Global Default",
            "lastUpdated": "2018-03-21 15:07:05",
            "tagCount": "0",
            "errorDescription": null,
            "serialNumber": "FOC1833X0AR",
            "instanceUuid": "8be78ab1-d684-49c1-8529-2b08e9c5a6d4",
            "id": "8be78ab1-d684-49c1-8529-2b08e9c5a6d4"
        }
    ],
    "version": "1.0"

}
Hopefully, you can start to see how powerful using APIs can be. Within a few moments, users are able to gather a tremendous amount of information about the devices currently being managed by the DNA Center Controller. One could even say that in the time it takes someone to log in to a device via the CLI and issue all the relevant show commands to gather this data, an API call can be used to gather it for the entire network within seconds. Talk about giving some time back to some engineers to do other things!
Manipulating data using filters and offset lists is very common with the use of APIs. A great example would be leveraging the Network Device API and only gathering the information on only a single device in the inventory. Perhaps it is the second device in the inventory. This is where the API documentation becomes so valuable. Most APIs that are created are documented as to what they can be used to accomplish.
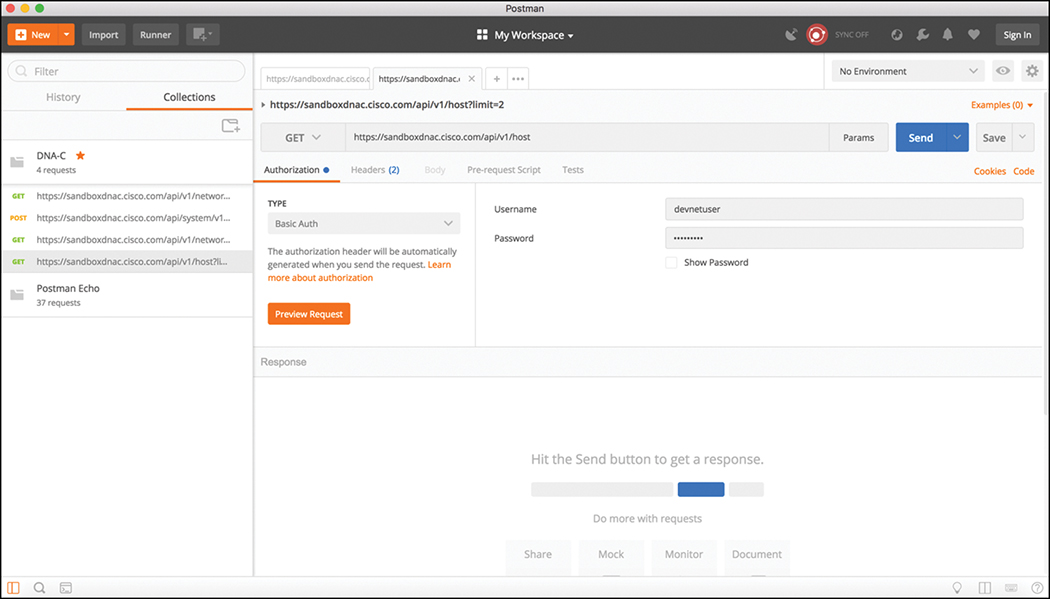
In Postman, it is possible to modify the Network Device API URL and add ?limit=1 to the end of the URL to show only a single device in the inventory. We can also add the &offset=2 command to the end of the URL to state that we want to see the second device in the inventory. Although it may seem confusing, the limit keyword simply states that a user only wants to retrieve one record from the inventory, and the offset command states that the user only wants that record to be the second record in the inventory. Figure 3-11 shows how a user can adjust the Network Device API URL in Postman to show the second device in the inventory. Users can specify a filter that states that they only want to see a single device in the inventory (?limit=1) and to show the second device in the inventory (&offset=2).
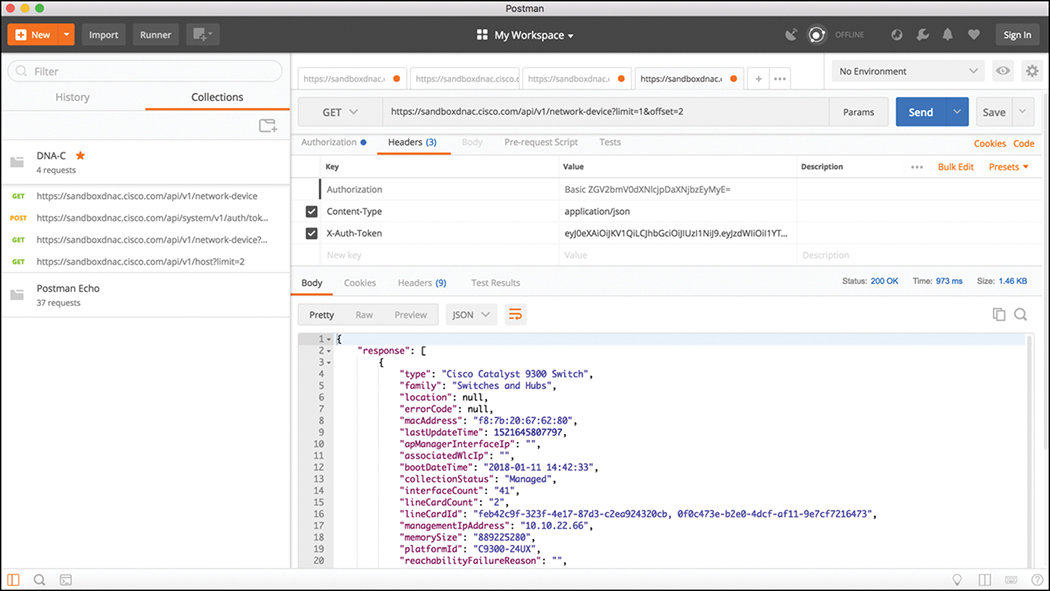
Based on the response, you can see that the second device is consistent with the output you saw in the initial Network Device API call that was shown in Example 3-4. That device is a “Cisco Catalyst 9300 Switch” with the MAC address of f8:7b:20:67:62:80.
Data Models and Supporting Protocols
This section covers some of the most common data models and tools and how they are leveraged in a programmatic approach. The data models and tools covered are as follows:
Yet Another Next Generation (YANG) modeling language
Network Configuration Protocol (NETCONF)
ConfD
YANG Data Models
The Simple Network Management Protocol (SNMP) is widely used for fault handling and monitoring. However, it is not often used for configuration changes. CLI scripting is used more often than other methods. YANG data models are an alternative to SNMP Management Information Base (MIBs) and are becoming the standard for data definition languages. YANG was defined in RFC 6020 and uses data models. Data models are used to describe whatever can be configured on a device, everything that can be monitored on a device, and all the administrative actions that can be executed on a device, such as resetting counters and rebooting the device. This includes all the notifications that the device is capable of generating. All of these variables can be represented within a YANG model. Data models are very powerful in that they create a uniform way to describe data, which can be beneficial across vendors’ platforms. Data models allow network operators to configure, monitor, and interact with network devices holistically across the entire enterprise environment.
YANG models use a tree structure. Within that structure, the models are constructed similar to the XML format and are built in modules. These modules are hierarchical in nature and contain all the different data and types that make up a YANG device model. YANG models make a clear distinction between configuration data and state information. The tree structure represents how to reach a specific element of the model. These elements can be either configurable or not configurable.
Elements all have a defined type. For example, an interface can be configured to be on or off. However, the interface state cannot be configured (for example, up or down). Example 3-5 illustrates a simple YANG module taken from RFC 6020.
Example 3-5 YANG Model Example
     container food {
       choice snack {
           case sports-arena {
               leaf pretzel {
                   type empty;
               }
               leaf beer {
                   type empty;
               }
           }
           case late-night {
               leaf chocolate {
                   type enumeration {
                       enum dark;
                       enum milk;
                       enum first-available;
                   }
               }
           }
       }
    }
The output in the previous example can be read as follows: You have food. Of that food, you have a choice of snacks. In the case that you are in the sports arena, your snack choices are pretzels and beer. If it is late at night, your snack choices are two different types of chocolate. You can choose to have milk chocolate or dark chocolate, and if you are in a hurry and do not want to wait, you can have the first available chocolate, whether it is milk chocolate or dark chocolate. To put this into more network-oriented terms, see Example 3-6.
Example 3-6 Network-Oriented YANG Model
    list interface {
         key "name";

         leaf name {
             type string;
         }
         leaf speed {
             type enumeration {
                 enum 10m;
                 enum 100m;
                 enum auto;
             }
         }
         leaf observed-speed {
             type uint32;
             config false;
         }
     }
The YANG model shown here can be read as follows: You have a list of interfaces. Of the available interfaces, there is a specific interface that has three configurable speeds. Those speeds are 10Mbps, 100Mbps, and auto, as listed in the leaf named “speed.” The leaf named “observed-speed” cannot be configured due to the config false command. This is because as the leaf is named, the speeds in this leaf are those that were auto-detected (observed); hence, it is not a configurable leaf. This is because it represents the auto-detected value on the interface, not a configurable value.
NETCONF
NETCONF was defined in RFC 4741 and RFC 6241. NETCONF is an IETF standard protocol that uses the YANG data models to communicate with the various devices on the network. NETCONF runs over SSH, TLS, or the Simple Object Access Protocol (SOAP). Some of the key differences between SNMP and NETCONF are listed in Table 3-5. One of the most important differences is that SNMP can’t distinguish between configuration data and operational data, but NETCONF can. Another key differentiator is that NETCONF uses paths to describe resources, whereas SNMP uses object identifiers (OIDs). A NETCONF path can be similar to interfaces/interface/eth0, which is much more descriptive than what you would expect out of SNMP. Here is a list of some of the more common use cases for NETCONF:
Collecting the status of specific fields
Changing the configuration of specific fields
Taking administrative actions
Sending event notifications
Backing up and restoring configurations
Testing configurations before finalizing the transaction
Table 3-5 Differences Between SNMP and NETCONF
SNMP
NETCONF
Resources
OIDs (Object Identifier)
Paths
Data Models
Defined in MIBs
YANG Core Models
Data Modeling Language
SMI (Structure of Management Information)
YANG
Management Operations
SNMP
NETCONF
Encoding
BER (Bit Error Rate)
XML, JSON
Transport Stack
UDP
SSH/TCP
Transactions are all or nothing. There is no order of operations or sequencing within a transaction. That means it doesn’t matter the order in which the configurations are done. It is completely arbitrary. Transactions are processed in the same order every time on every device. Transactions, when deployed, run in a parallel state and do not have any impact on each other.
Example 3-7 illustrates a NETCONF element from RFC 4741. This NETCONF output can be read as follows: There is an XML list of users named “users.” In that list, there are the following individual users: root, Fred, and Barney.
Note
XML will be covered later in this chapter.
Example 3-7 Example NETCONF Element
  <rpc-reply message-id="101"
          xmlns="urn:ietf:params:xml:ns:netconf:base:1.0">
       <data>
         <top xmlns="http://example.com/schema/1.2/config">
           <users>
            <user>
               <name>root</name>
             </user>
             <user>
               <name>fred</name>
             </user>
             <user>
               <name>barney</name>
             </user>
           </users>
         </top>
       </data>
     </rpc-reply>
An alternate way of looking at this type of NETCONF output is as a shopping list. Example 3-8 illustrates the shopping list concept and can be read as follows: You have a group of beverages. Of these beverages, you have soft drinks and tea. The available soft drinks are cola and root beer. Of the available teas, you have sweetened and unsweetened.
Example 3-8 Shopping List NETCONF Example
Beverages
    Soft Drinks
        Cola
        Root Beer
    Tea
        Sweetened
        Unsweetened
ConfD
Network operators today are looking for a way to manage their networks holistically, rather than managing them on a box-by-box basis. To do this, many network devices have northbound APIs that allow a management tool or suite of tools to interact with the devices across the network. This allows for service applications and device setup to be done uniformly across the campus environment. This type of automation introduces the concept of a transactional deployment model.
In the transactional deployment model, network operators deploy services or configurations to devices in an all-or-nothing fashion. For example, if a network operator was deploying Quality of Service (QoS) on a box-by-box basis, many configuration steps would have to be completed for QoS to function properly. Class maps must classify and match traffic, policy maps must be configured and applied to interfaces, and so on. If one of these steps is missed, QoS will not function properly. With a transactional model, you can deploy all the steps needed to enable QoS on all devices simultaneously, and if for some reason the entire configuration isn’t fully deployed, it can be rolled back entirely.
This is a much cleaner and less error-prone way to deploy certain features. In the transactional model, there wouldn’t be any partially configured features resident in the campus devices, which ensures the integrity of the network as a whole. This also functionally makes the network act as a federated database rather than as a collection of separated devices.
Service applications can include things like VPN provisioning, QoS, firewall capabilities, and so forth. Device setup components can include configuration templates, scripts, and other device-specific operations. ConfD is a device-management framework that is very different from the traditional management tools. ConfD uses YANG data models to interact with various network devices. It can also use NETCONF, among other things, as a protocol to carry the different transactions to the equipment to be executed.
Once you have a YANG model for a device, ConfD automatically renders all the management protocols mentioned earlier. For example, you will automatically have a WEB UI into the YANG model of the device without having to program anything. The YANG model also supplies the configuration database (CBD, covered in the next section) schema, so the structure of the fields is taken from the YANG model, as well. Table 3-6 compares some of the differences between ConfD and other traditional management tools.
Table 3-6 Comparison Between ConfD and Traditional Management Tools
Traditional Management Tools |
ConfD |
SNMP agents |
Data-model driven (YANG) |
CLI |
Any protocol |
Feature lag of management tool |
Executes transactions for desired features |
ConfD has many different management protocols that can be used northbound to manage the product. Some of these protocols are shown in Figure 3-12. Those management protocols are as follows:
NETCONF
SNMP v1, v2c, v3
REST
CLI
WEB UI
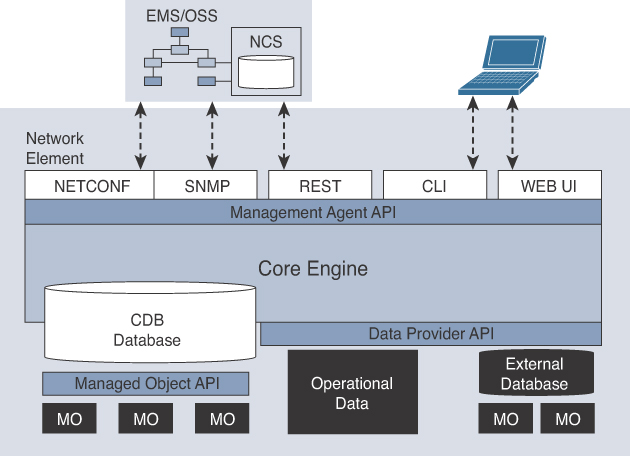
Figure 3-12 ConfD Core Platform and Management APIs
Some of the different components of ConfD are the Core Engine, CDB database, Managed Object API, and the Data Provider API. The CDB database is where the configurations are stored in the ConfD solution. The internal CDB database is optional, and network operators can choose to have external databases for their configurations or use both internal and external databases to fit their needs. This may make sense if you have a number of legacy applications already using an external database. Most often, the internal CDB database is used.
Note
You can also store alarms, performance data, internal state, and other items in the CDB database.
Multiple components comprise the ConfD Core Engine, including the following:
Transaction management
Session management/authentication
Role-based access control (RBAC)
Redundancy/replication for HA
Event logging/audit trails
Validation syntax/semantic
Rollback management
Upgrades and Downgrades
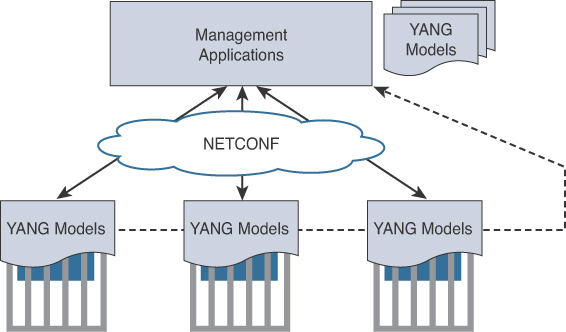
Once an operator has authenticated to ConfD, that operator is assigned one or more roles. These roles dictate not only what the operator can and cannot see, but what they can and cannot make changes to. These roles can be very granular in nature. This gives an organization the flexibility to have multiple tiers of operators that have job-specific functions tied to their roles. The audit-trailing capabilities of ConfD allow for robust reporting on which operator configured what, the commands that were executed, where they were executed, and when. This is especially important when you have multiple operators responsible in a campus environment. The validation component of ConfD is one of the most important. It can validate that the syntax of the commands is indeed valid before the commands are sent to the devices. More importantly, because of the YANG data models, ConfD can verify the validity of specific variables with other variables. That means if you need to make sure portions of the configuration are unique throughout your environment, ConfD can verify this across your whole environment (for example, it can check for duplicate IP addresses). Figure 3-13 illustrates how NETCONF uses YANG data models to interact with network devices and then talk back to management applications like ConfD.
The rollback management function is another very useful component of ConfD. For instance, after a network operator authenticates to the ConfD system and gets a role assigned to them, the rollback management component will track all the transactions made by that operator within their current session and create rollback files in the event that the transactions need to be reverted back to a previous state. This creates a timeline of transactions that allows the operator to pick a point in time to roll back to.
ConfD is designed to make your devices more manageable, programmable, and compliant with the industry standards. ConfD enables multiple ways to interact with your campus devices, such as NETCONF, SNMP, REST APIs, CLI, and web user interfaces. A key benefit of ConfD is its ability to hide network complexity and provide useful northbound interfaces that humans and applications can use. Using ConfD can save you time when interacting with devices because it is data model driven. All the interfaces of the data models are automatically rendered and require no programming by default. It has a self-contained database, although you can have external databases and a variety of feature-rich APIs.
DevNet
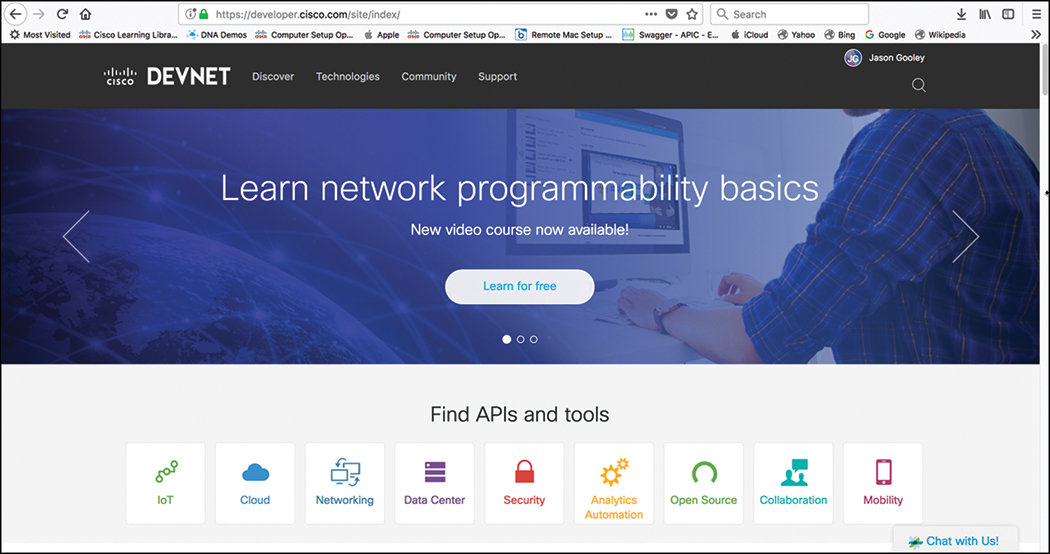
The examples and tools discussed in this chapter are all available to use and practice at http://developer.cisco.com. This is the home for Cisco DevNet. DevNet is a single place to go when looking to enhance or increase your skills with APIs, coding, Python, and even controller concepts. In DevNet you will find learning labs and content that will help solidify your knowledge in network programmability. Regardless of whether you are just getting started or are a seasoned programmatic professional, DevNet is the place to be! In this section, DevNet will be covered from a high-level overview perspective, including the different sections of DevNet as well as some of the labs and content you can expect to interact with. Figure 3-14 shows the DevNet main page.
Across the top of the main page you can see a few menu options. These menu options will be covered individually and are as follows:
Discover
Technologies
Community
Support
Discover
First is the Discover tab. This is where you navigate the different offerings DevNet has available. Under this tab you find subsections like guided learning tracks. These learning tracks guide you through various different technologies and the associated API labs. Some of the labs you can interact with are Programming the Digital Network Architecture (DNA), ACI Programmability, Getting Started with Cisco Spark APIs, and Introduction to DevNet, to name a few. Once you pick a learning lab and start the module, the website will track all your progress and allow you to continue where you left off. It’s excellent for continuing your education over multiple days or weeks.
Technologies
The Technologies section allows you to pick relevant content based on the technology that you want to study and to dive directly into the associated labs and training. Figure 3-15 illustrates some of the networking content that is currently available.
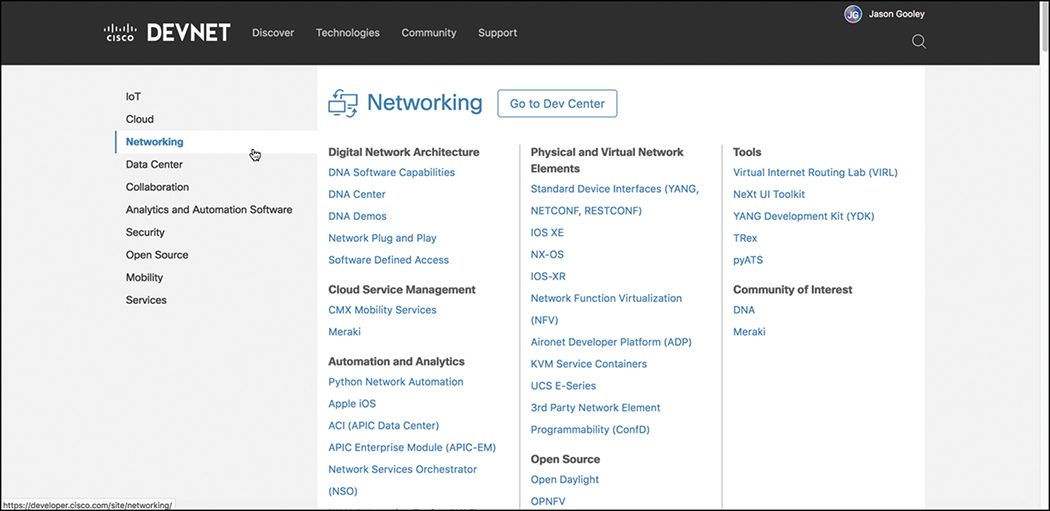
Note
Available labs may differ from those shown in this chapter. Please visit developer. cisco.com to see the latest content available and to interact with the latest learning labs.
Community
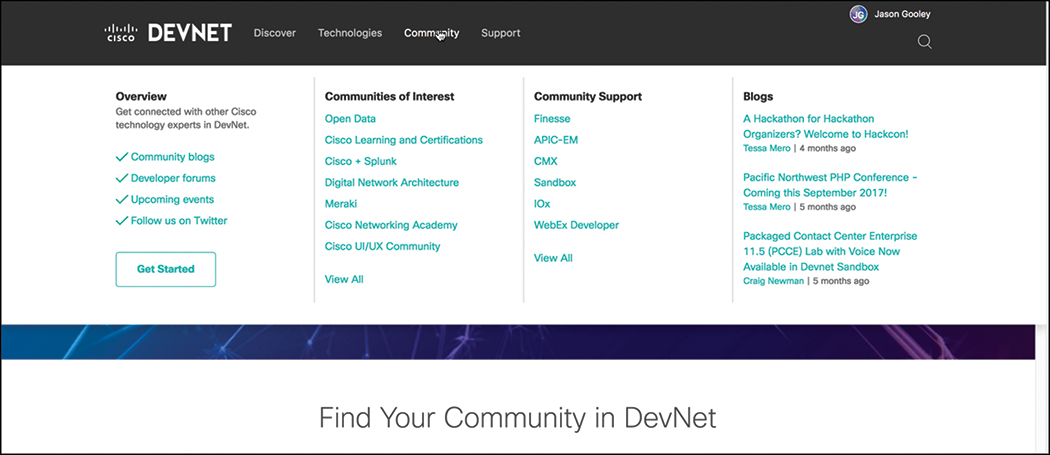
Perhaps one of the most important sections of DevNet is Community, which is where you will have access to many different people at various stages of learning. You’ll find DevNet ambassadors and evangelists there to help you at various stages of your learning journey. The Community section puts the latest events and news at your fingertips. This is also the place to read blogs, sign up for Developer Forums, and follow DevNet on all major social media platforms. This is the safe zone to ask any question, regardless of how simple or complex it may seem. Everyone has to start somewhere. The DevNet Community is the place to start for all things Cisco and network programmability. Figure 3-16 depicts some of the available options you have in the Community tab.
Support
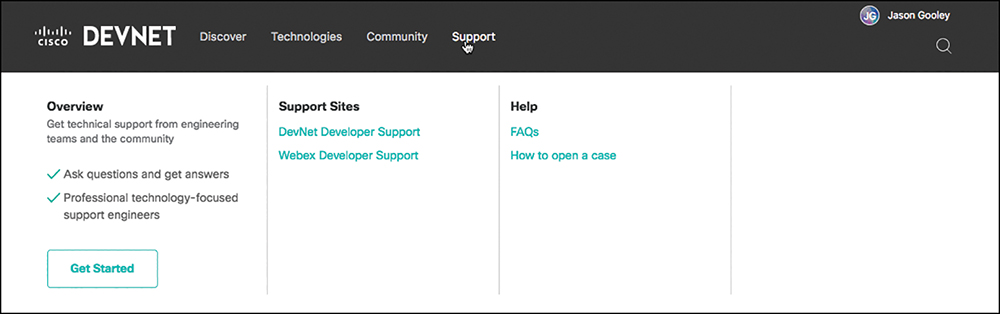
The Support section of DevNet is where you can post questions and get answers from some of the best in the industry. Technology-focused professionals are available to answer your questions both from a technical perspective and a theoretic perspective, meaning you can ask questions about specific labs or the overarching technology (for example, Python or YANG models). You can also open a case with the DevNet Support team and your questions will be tracked and answered within a minimal amount of time. This is a great place to ask one-on-one questions with the Support team as well as to tap into the expertise of the Support engineers. Figure 3-17 shows the DevNet Support page as well as where to open a Support case.
Continuous Innovation and Continuous Deployment (CI/CD)
Oftentimes there is a stigma around automation and a hesitation to use it. It creates a fear that if businesses start deploying automation, engineers and developers will ultimately lose their jobs. This is simply not the case. Operations teams want to be able to streamline their efforts and alleviate the workload they have to face on a day-to-day basis. Ultimately, this will free up time for you to be able to help support your businesses plan for what to do for the next three to five years, as well as allow you to leverage the use of technology as a mechanism to meet the businesses strategic vision and be more agile.
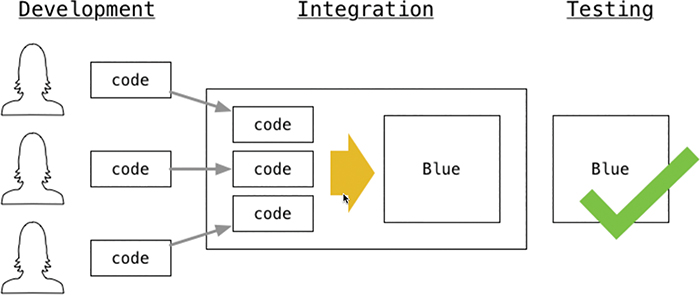
Let’s say, for example, your business is a software company. When developers work on creating and coding software, each development team is responsible for their own section or piece of the overall software suite or program. This means that there may be different teams of developers working on creating a specific portion of the software. Maybe they are creating a subset of features or developing a single use case into the software code. What ends up happening at some point is that all these developers have to consolidate all their separate versions of code into the overall codeset that makes up the software suite or program they are all developing. If each developer used different coding methods or error-checking methods, you could imagine that once all the code is put together into a single code set, it would likely be error-prone and might not function as desired. This is where Continuous Integration (CI) comes into play. If you were to use a common structure or guideline for every developer that includes error checking and testing, the codeset would have a higher likelihood of working the way the developers designed it to work. Continuous Integration automatically tests all of the code as it is loaded to ensure that any new changes to the code do not impact the overall codeset. Figure 3-18 illustrates an example of a common Continuous Integration workflow.
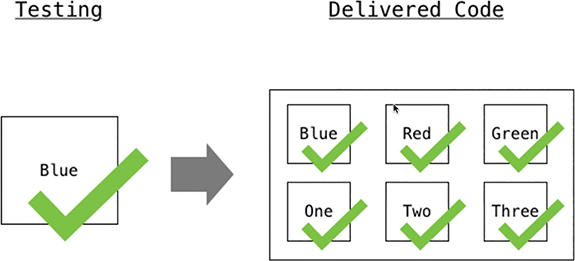
Once the changes in the code have been successfully tested, the code will need to be packaged up to be deployed to either a test development environment or production. This is where the code gets put into a container, along with any startup scripts, so that the software and any of its dependencies are all in the same location. This allows the developers to ensure that the code will launch and run consistently. Figure 3-19 depicts the process used once the developers’ code has been consolidated and tested. This concept is called Continuous Packaging.
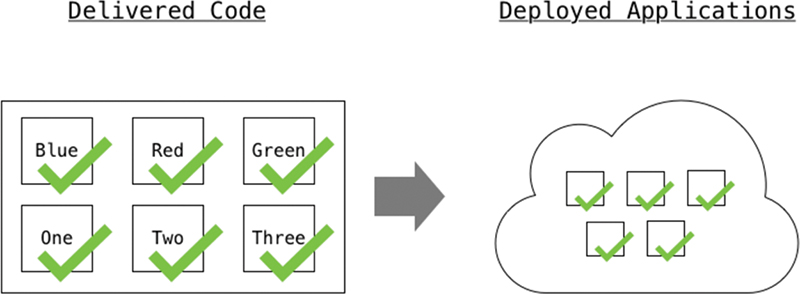
Now that the developers’ code has been packaged and put into a container, the package will need to be deployed, as mentioned earlier, to a development or production environment. Once this has been completed, the software will be available for people to use. The entire process that was just covered is called an automation pipeline. This pipeline gives us the ability to follow a structured process for software development. It starts with making sure all the various code components are integrated together and tested to ensure any changes did not impact the overall software solution. Then next step includes packaging up all the code components and scripts into a single location to ensure that the software has all the necessary pieces it requires to run. Finally, the package is deployed to either a development environment or into production for users to be able to utilize the software. Figure 3-20 shows the final piece of the pipeline, which is Continuous Deployment (CD).
Source Control Management
Now that we have discussed Continuous Integration and Continuous Deployment, the next topic to be covered is an important component that helps in making sure our software pipeline runs smooth and without issue. This component is called Source Control or Version Control Management. Source Control is a way to keep track of the various versions or revisions of code that are created, as well as any associated modifications. This allows developers to not only make sure they are all using the correct version of the code, but it also helps to ensure that if they needed to roll back to a previous version or revision of the code, they are more easily able to do so.
One of the most commonly used Source Control Management platforms is Git, which not only allows developers to have version control over their files, but also allows them to work cohesively with other developers on those files. This allows developers to accelerate working on software projects without sacrificing the integrity of the data. Git has two data structures that make it function. The first data structure is called an Index and is often referred to as the “cache.” This is because it caches the information of the working directory you are using for your files as well as the unsaved or uncommitted changes to those files in the working directory. The second data structure is called the Object Database, which contains four different types of objects. Table 3-7 lists these four different object types.
Table 3-7 Object Types in the Object Database
Object Type |
Use Case |
Blob (Binary Large Object) |
Contains the contents of a file |
Tree |
Directory that contains filenames and references blobs or other tree objects |
Commit |
Links objects to create a history of timestamps, log messages, and names of objects |
Tag |
Used to store metadata that corresponds to a particular version or revision being tracked by Git |
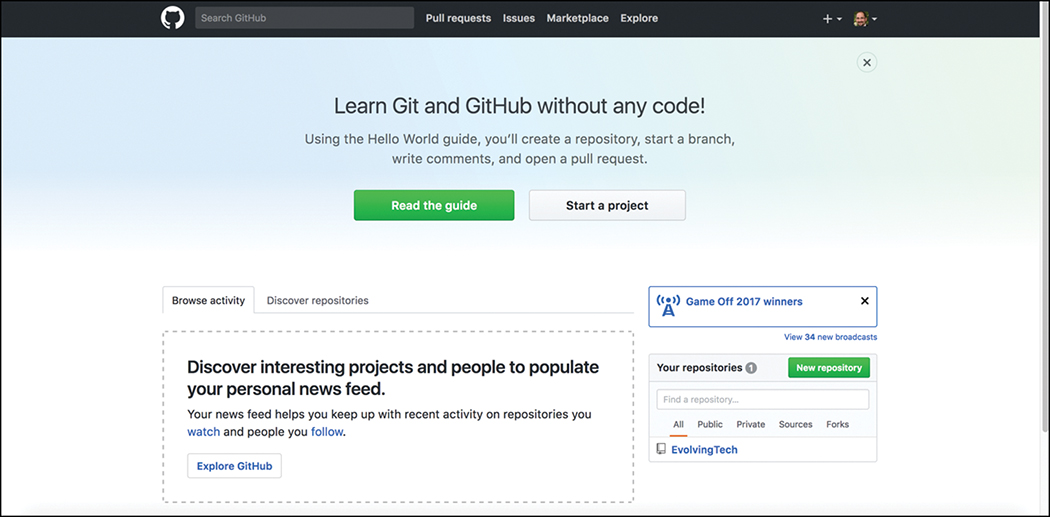
One of the most efficient and commonly adopted ways of using Git is to use GitHub. GitHub is a hosted web-based repository for Git. It has capabilities for bug tracking and task management as well. GitHub provides one of the easiest way to track changes on your files, collaborate with other developers, and share code with the online community. It is a great place to look for code to get started on the programmability journey. Oftentimes, other engineers or developers are trying to accomplish similar tasks and have already created and tested the necessary code. One of the most powerful features of using GitHub is the ability to rate and provide feedback on other developer’s code. Peer review is encouraged when it comes to the coding community. Figure 3-21 shows the main GitHub web page.
Fortunately, a guide is available that steps you through how to create a repository, start a branch, add comments, and open a pull request. You can also just start a GitHub project after you are more familiar with the GitHub tool and its associated processes. Projects are repositories that contain code files. This is where you will have a single pane to create, edit, and share your code files. Figure 3-22 shows a repository called “EvolvingTech” that contains three files:
EvolvingTech.txt
JSON_Example.txt
README.md
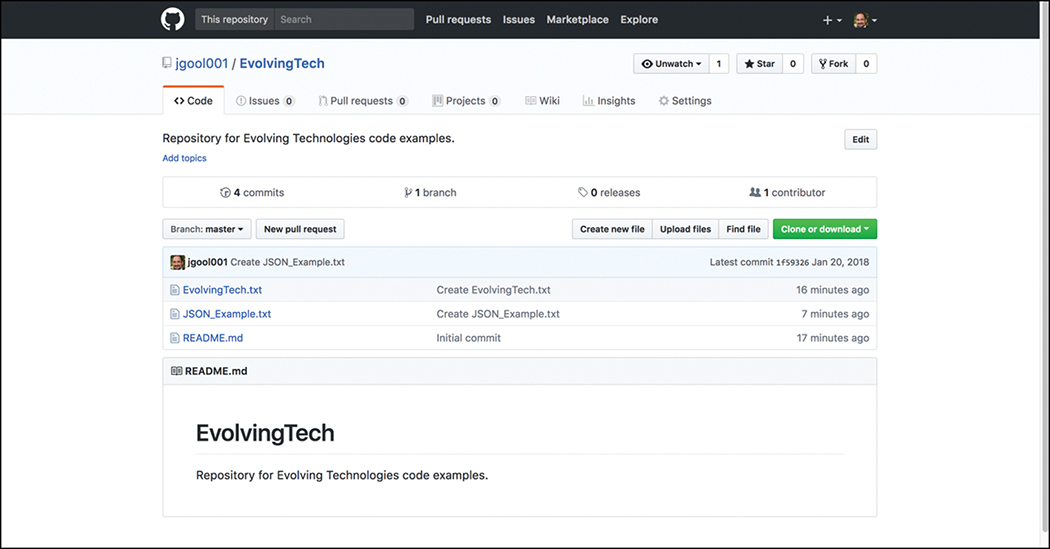
Figure 3-22 GitHub EvolvingTech Repository
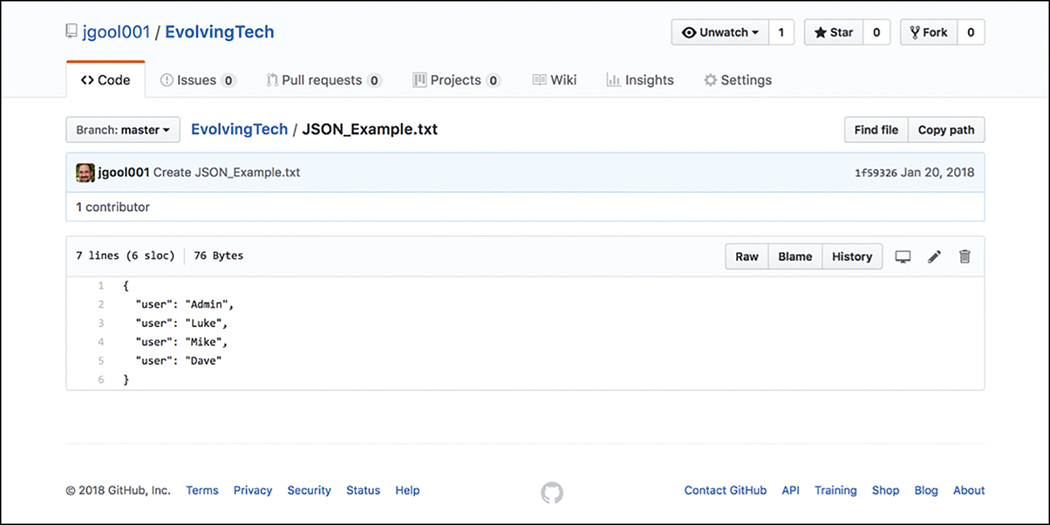
GitHub also provides a great summary of commit logs, meaning when you save a change in one of your files or create a new file, it shows the details on the main repository page. This can be seen in Figure 3-22 as well. By drilling down into one of the files in the repository, you can see how easy it is to edit and save your code. If you drill down into JSON_Example.txt, you will see its contents and how to exit the file in the repository. Once you click the filename JSON_Example.txt, you can see that the file has seven lines of code and is 76 bytes in size. Figure 3-23 shows the contents of the JSON_Example.txt file and the associated options for what you can do with the file.
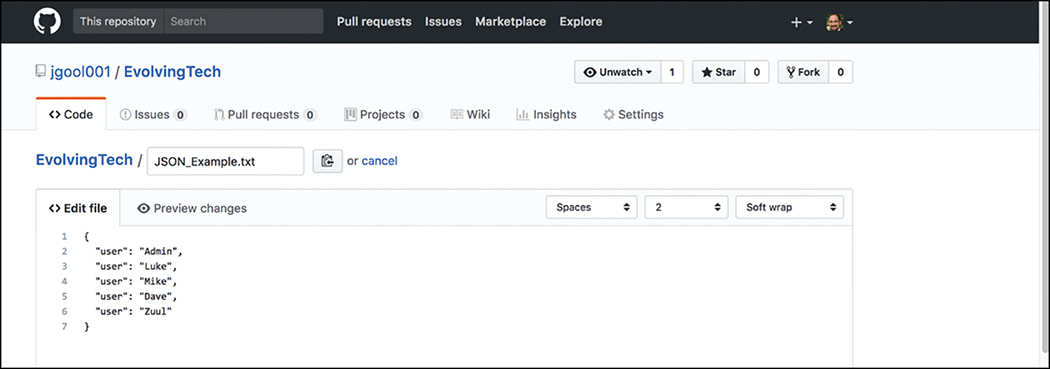
The pencil icon allows you to go into editing mode so you can alter the file contents. This editor is very similar to any text editor. Developers can simply type into the editor or copy and paste code from other files directly into the editor. The example in Figure 3-24 shows the addition of another user named “Zuul.” If we were to commit the changes, the file would be saved with the new user added to the file. Now that the file is available in the repository, other GitHub users and developers can contribute to the code, or add and delete lines of code based on the code we created. This is the true power of sharing your code. For example, if you have some code to add a new user via JSON syntax, someone could use that code and simply modify the usernames or add to the code to enhance it.
Ansible
Ansible is an automation tool that is capable of automating cloud provisioning, the deployment of applications, and configuration management. Ansible has been around for quite some time and was catapulted more into the mainstream when RedHat purchased the company back in 2015. Ansible has grown very popular due to the simplicity this product brings when deploying such services. Ansible is also open source as well as simple to use. Ansible was created with the following concepts in mind:
Consistent
Secure
Highly reliable
Minimal learning curve
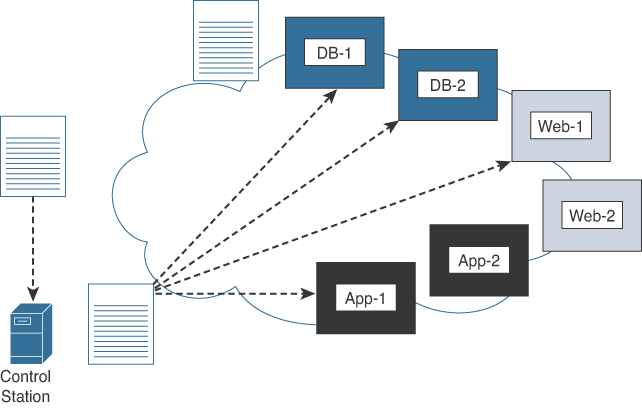
Unlike many other automation tools, Ansible is an agentless tool. This means that no software or agent needs to be installed on the client machines to be managed. This is considered by some to be a major advantage of using Ansible versus other products. Ansible communicates via SSH for a majority of devices. It can also support WinRM and other transport methods to the clients it manages. Ansible also doesn’t need an administrative account on the client. It can use built-in authorization escalation, like sudo, for example, when it needs to raise the level of administrative control. Ansible uses the concept of a “control station” to send all the requests from. This could simply be a laptop or a server sitting in a data center. It is quite literally the computer used to run Ansible and to issue the changes or requests from. This control station sends the requests to the remote hosts. Figure 3-25 illustrates the workflow.
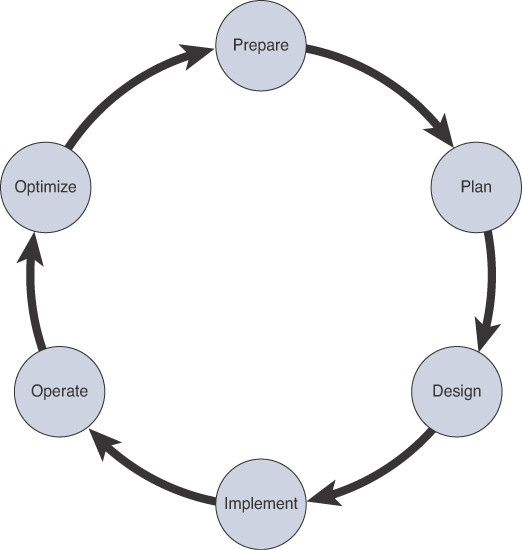
These concepts are some of the reasons that administrators, developers, and IT managers seek to use Ansible. This allows for an easy ramp-up for users who aim to create new projects as well as sets the stage for a long-term automation initiatives and processes to further benefit the business. Previously we discussed the risk of human error and the impact it has on the business. Automation, by nature, reduces the risk of human error because we are taking known best practices that have been thoroughly tested in our environment and duplicating them in an automatic process. However, it is important to note that if a bad process or erroneous configuration is automated, it can be detrimental as well. When you’re preparing to automate a task or set of tasks, it is important to start with the desired outcome of automating the task(s). Once a desired outcome has been documented, you can then move on to creating a plan to achieve the outcome. This process follows the PPDIOO (Prepare, Plan, Design, Implement, Observe, Optimize) methodology. Figure 3-26 outlines the PPDIOO lifecycle.
Ansible uses a concept called “Playbooks” to deploy configuration changes or retrieve information from hosts within the network. You can think of Playbooks as structured sets of instructions. To use a sports analogy, it is very similar to what football players use to make different plays on the field during a game. For example, a Playbook contains multiple “plays,” and each play contains the “tasks” that each player must accomplish in order for that particular play to be successful. The same applies to Ansible Playbooks. Table 3-8 lists the structure of a Playbook and some commonly used examples of tasks.
Table 3-8 Ansible Playbook Structure and Examples
Components |
Description |
Use Case |
Playbook |
Set of plays for remote systems |
Structure used by Ansible to enforce configuration and/or deployment steps. |
Play |
Ansible uses plays to group functions for single or multiple hosts |
Grouping of a set of hosts to apply a policy or configuration to them. |
Task |
Call to an Ansible module |
Log in to a device and issue a show command to retrieve an output. |
Now that you know what the basic structure of a Playbook is, you need to further understand the language used to create Playbooks. Ansible Playbooks are written in YAML syntax. YAML stands for Yet Another Markup Language. Ansible YAML files usually begin with a series of three dashes (---) and end with a series of three periods (…). YAML files also contain lists and dictionaries. Example 3-9 illustrates a YAML file containing a list of musical genres.
---
# List of music genres
Music:
    - Metal
    - Rock
    - Rap
    - Country
…
YAML lists are very easy to read and consume. You can see based on the previous example that we have the ability to add descriptions to the YAML file by using the hash or pound sign (#) and adding text immediately following the it. You can also see the example of the starting --- and trailing …, which indicate the starting and end of the YAML file, respectively. More importantly, you can see that we started each line of the list with a dash and a space (-). Indentation is also important in YAML files.
YAML also has the concept of dictionaries. YAML dictionaries are very similar to JSON dictionaries because they also use key-value pairs. Remember from earlier in this chapter that key-value pairs are represented by “key: value”. Example 3-10 depicts a YAML dictionary containing an example employee record.
Example 3-10 YAML Dictionary Example
---
# HR Employee record
Employee1:
    Name: John Smith
    Title: Network Architect
    Nickname: D'Bug
Lists and dictionaries can be used together as well in YAML. Example 3-11 shows a dictionary with a list in a single YAML file.
Example 3-11 YAML Dictionary and List Example
---
# HR Employee records
-  Employee1:
    Name: John Dough
    Title: Developer
    Nickname: Mr. D'Bug
    Skills:
      - Python
      - YAML
      - JSON
-  Employee2:
    Name: Jane Dough
    Title: Network Architect
    Nickname: Lay D'Bug
    Skills:
      - CLI
      - Security
      - Automation
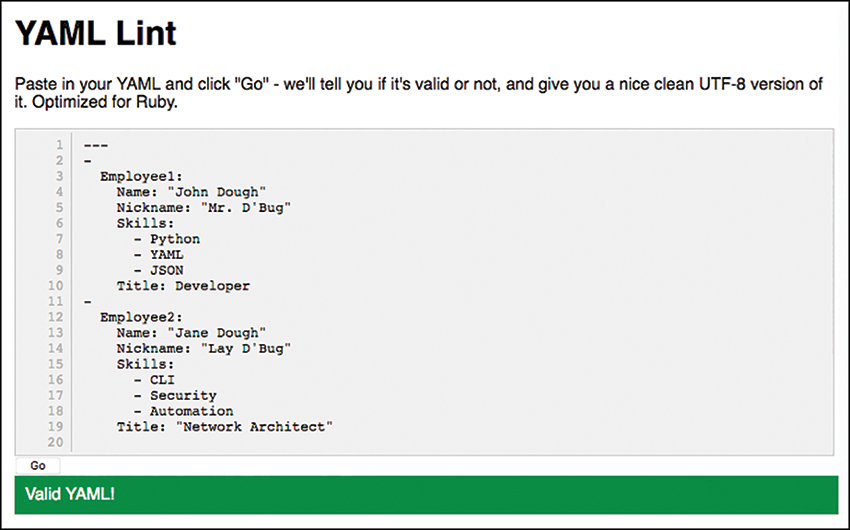
YAML Lint is a free online tool used to check the format of YAML files to make sure they are in a valid syntax. Simply go to www.yamllint.com, paste the contents of a YAML file into the interpreter, and click Go. This will tell you if you have an error in your YAML file. Figure 3-27 shows the same YAML dictionary and list example, but it cleans up the formatting and removes the description line with the # sign.
Ansible has a CLI tool that can be used to run Playbooks or ad-hoc CLI commands on targeted hosts. This CLI tool has very specific commands needed in order to enable automation. The most common Ansible CLI commands are shown in Table 3-9 with their associated use cases.
Table 3-9 Ansible CLI Commands
CLI Command |
Use Case |
ansible |
Runs modules against targeted hosts, ad-hoc CLI |
ansible-playbook |
Runs Playbooks |
ansible-docs |
Provides documentation on syntax and parameters via CLI |
ansible-pull |
Changes Ansible clients to “pull” modules from the control station versus the default “push” model |
ansible-vault |
Used to encrypt YAML files that contain sensitive data |
Ansible uses an inventory file to keep track of the hosts it manages. The inventory can be a named group of hosts or a simple list of individual hosts. Hosts can belong to multiple groups and can be represented by either an IP address or a resolvable DNS name. Example 3-12 shows the contents of a host inventory file with the host 192.168.10.1 in two different groups.
Example 3-12 Ansible Host Inventory File
[routers]
192.168.10.1
192.168.20.1

[switches]
192.168.10.25
192.168.10.26

[primary-gateway]
192.168.10.1
Now that we have seen the fundamental concepts of Ansible and YAML, it is time to cover some useful examples. This section illustrates some basic examples of Ansible Playbooks used to accomplish common tasks. Imagine using a Playbook to deploy an interface configuration on a device without having to manually configure it. Perhaps taking this idea a step further, you could use a Playbook to configure an interface and deploy an EIGRP routing process. Example 3-13 illustrates the contents of an Ansible Playbook called ConfigureInterface.yaml. This Playbook will be used to configure the GigabitEthernet2 interface on a CSR1000V router. Leveraging the ios_config Ansible module, this Playbook will add the following configuration to the GigabitEthernet2 interface on the CSR1KV-1 router:
description Configured by ANSIBLE!!!
ip address 10.1.1.1
subnet mask 255.255.255.0
no shutdown
Example 3-13 Ansible ConfigureInterface.yaml Playbook
---
- hosts: CSR1KV-1

  gather_facts: false
  connection: local

  tasks:
   - name: Configure GigabitEthernet2 Interface
     ios_config:
       lines:
         - description Configured by ANSIBLE!!!
         - ip address 10.1.1.1 255.255.255.0
         - no shutdown
       parents: interface GigabitEthernet2

       host: "{{ ansible_host }}"
       username: cisco
       password: testtest
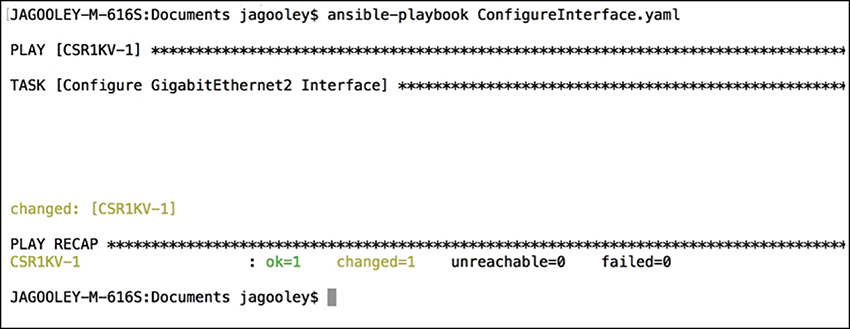
In order to execute this Playbook, the ansible-playbook command will be used to call the specific Playbook YAML file. In this case, the file is called ConfigureInterface. yaml. Figure 3-28 depicts the output from calling the Playbook from the Linux shell. The important things to note from the output are the PLAY, TASK, and PLAY RECAP sections. These sections list the name of the play and each individual task that gets executed in each play. The PLAY RECAP section lists the status of the Playbook that was executed. The output in Figure 3-28 shows that one play named CSR1KV-1 was launched, then a task called “Configure GigabitEthernet2 Interface.” Based on the status of ok=1, the change was successful, and the changed=1 status means that a single change was made on the CSR1KV-1 router.
Building out a Playbook can greatly simplify configuration tasks. Example 3-14 shows an alternate version of the ConfigureInterface.yaml Playbook named EIGRP_Configuration_Example.yaml, where EIGRP is added along with the ability to save the configuration by issuing a “write memory.” These tasks are accomplished by leveraging the ios_command module in Ansible. This Playbook will add the following configuration to the CSR1KV-1 router:
On GigbitEthernet2:
description Configured by ANSIBLE!!!
ip address 10.1.1.1
subnet mask 255.255.255.0
no shutdown
On GigbitEthernet3:
description Configured by ANSIBLE!!!
no ip address
shutdown
Global configuration:
router eigrp 100
eigrp router-id 1.1.1.1
no auto-summary
network 10.1.1.0 0.0.0.255
Save configuration:
write memory
Example 3-14 Ansible EIGRP_Configuration_Example.yaml Playbook
---
- hosts: CSR1KV-1

  gather_facts: false
  connection: local

  tasks:
   - name: Configure GigabitEthernet2 Interface
     ios_config:
       lines:
         - description Configured by ANSIBLE!!!
         - ip address 10.1.1.1 255.255.255.0
         - no shutdown
       parents: interface GigabitEthernet2

       host: "{{ ansible_host }}"
       username: cisco
       password: testtest

   - name: CONFIG Gig3
     ios_config:
       lines:
         - description Configured By ANSIBLE!!!
         - no ip address
         - shut
       parents: interface GigabitEthernet3

       host: "{{ ansible_host }}"
       username: cisco
       password: testtest

   - name: CONFIG EIGRP 100
     ios_config:
       lines:
         - router eigrp 100
         - eigrp router-id 1.1.1.1
         - no auto-summary
         - network 10.1.1.0 0.0.0.255
      host: "{{ ansible_host }}"
       username: cisco
       password: testtest

   - name: WR MEM
     ios_command:
       commands:
         - write memory

       host: "{{ ansible_host }}"
       username: cisco
       password: testtest
Once the Playbook is run, the output will show the tasks as they are completed and their associated status. Based on the output in Figure 3-29, we can see that tasks with the following names are completed and return a status of “changed”:
Configure GigabitEthernet 2 Interface
CONFIG Gig3
CONFIG EIGRP 100
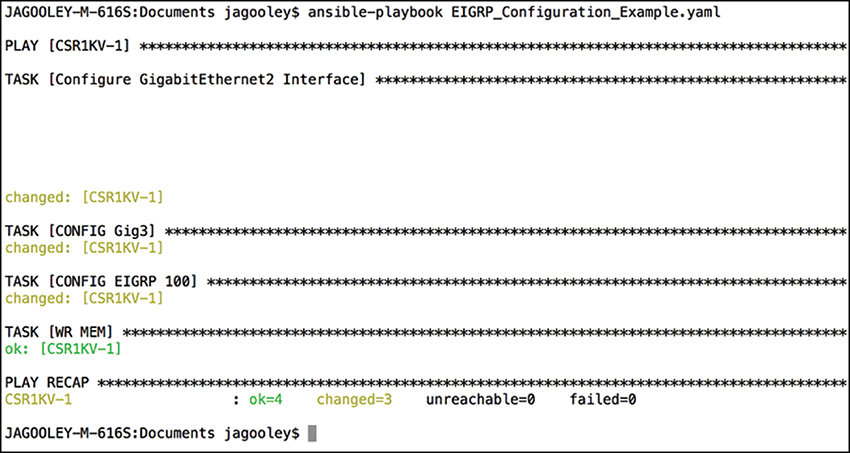
Figure 3-29 Executing EIGRP_Configuration_Example.yaml Playbook
Furthermore, the WR MEM task completes as well, which is evident by the “ok: [CSR1KV-1]” status. At the bottom of the output, we see in the PLAY RECAP section that we have a status of ok=4 and changed=3. This means that out of the four tasks, three actually modified the router and made a configuration change, while one task saved the configuration after it was modified.
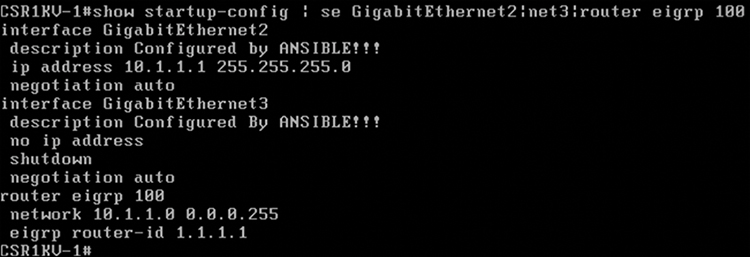
Now that the EIGRP_Configuration_Example.yaml Playbook has been run against CSR1KV-1, it is best to verify the configuration to make certain that it was correctly applied. Example 3-15 lists the relevant sections of the startup configuration from CSR1KV-1 to verify the tasks that were applied to the router.
Example 3-15 Relevant Startup-config Post Running Playbook
!
interface GigabitEthernet1
 ip address 172.16.38.101 255.255.255.0
 negotiation auto
 no mop enabled
 no mop sysid
!
interface GigabitEthernet2
 description Configured by ANSIBLE!!!
 ip address 10.1.1.1 255.255.255.0
 negotiation auto
!
interface GigabitEthernet3
 description Configured By ANSIBLE!!!
 no ip address
 shutdown
 negotiation auto
!
router eigrp 100
 network 10.1.1.0 0.0.0.255
 eigrp router-id 1.1.1.1
!
Since the last task in the Playbook is to issue the “write memory” command, verification involves quite simply issuing the show startup-config command with some filters to see the relevant configuration on the CSR1KV-1 router. Figure 3-30 illustrates the output from the show startup-config | se GigabithEthernet2|net3|router eigrp 100 command.
gRPC
Modern-day applications require the ability to transparently communicate between the client and server in order to build systems that are connected. gRPC is a framework that allows for this type of communication structure. gRPC stands for gRPC Remote Procedure Call. gRPC is a project supported by the Cloud Native Computing Foundation (CNCF). The CNCF is responsible for creating cloud-ready software that is sustainable and open. gRPC is designed to be extensible and work with multiple data formats. These data types also include JSON and XML, among others. In addition to supporting multiple data types, another big benefit to gRPC is the support for many different programming languages. The following programming languages are supported at the time of this writing:
Python
C++
Java
Node.JS
C#
Ruby
Go
Objective-C
Dart (beta)
Note
To learn more about gRPC-supported programming languages, visit https://grpc.io/docs/.
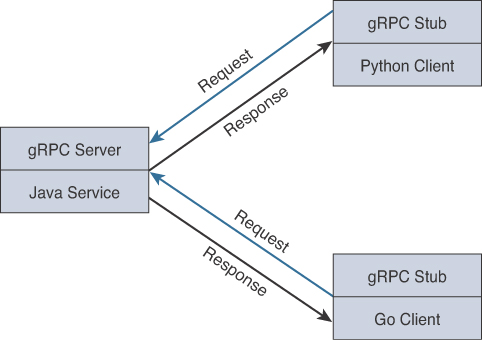
As you can see, this is a powerful technology that offers a wide support structure. The reason this is so important is that you can have multiple developers working on their own portion of a cloud project in their own programming language and still have the ability for them all to work together as a holistic system. For example, one developer can be working on a section of the application in Go, and the code can interact and work with code developed by another developer using Python. Figure 3-31 depicts the typical communication flow between multiple programming languages.
Google is one of the biggest consumers of this technology as of late. Google is using this for most of its cloud products and externally facing APIs. gRPC offers the ability to create a highly scalable and agile distributed system capable of handling workloads from different programming languages, making it very appealing to large companies looking to develop cloud-scale applications.
Like with other remote procedure calls, the data being sent across the connection needs to be serialized. gRPC has the ability to leverage HTTP/2. HTTP/2 offers quite a few benefits over its predecessor HTTP1.1. This is especially important when serializing multiple data streams over a single TCP connection. This is called multiplexing. Table 3-10 illustrates some of the key differences between the two versions of HTTP.
Table 3-10 HTTP/2 vs. HTTP 1.1
HTTP/2 |
HTTP 1.1 |
Can send multiple requests via a single TCP connection (multiplexing) |
Requires new TCP connection for each request |
Faster load times ~2 to 4 times faster |
Slower load times due to lack of multiplexing |
Non-blocking |
Subject to Head of Line (HOL) blocking issues |
Ability to use compressed headers across multiple transactions |
Uses headers for every transaction |
Capable of bi-directional communication |
Unidirectional traffic flow |
In order to understand the benefit gRPC has with data serialization, it is important to cover protocol buffers. Protocol buffers are Google’s open source method of serializing structured data. Structured data can be a variety of data formats such as JSON. First, you have to define the data to be serialized into a text file with a proto extension. In Python, we define objects by name. Proto files are used to apply an integer to a definition. This means when serializing the data, instead of having to send the whole name you defined, you can simply send a number that represents the defined object. For example, the proto file contains a list of fields that just map the object names to numbers. Example 3-16 shows the content of a sample proto file.
Example 3-16 Proto File Example
message Employee {
  string EmployeeName = 1;
  int32 EmployeeID = 2;
}
Based on this example, we can send a 1 or a 2 instead of having to send the whole field name, like EmployeeName or EmployeeID, and still have the same outcome. This can save a significant amount of time and reduce latency as well when serializing the data. Essentially, one can send a single number that represents a much larger field or definition of structured data.
Summary
This chapter covered some of the foundational skills needed to get started with network programmability. This chapter also covered some of the key capabilities and benefits from using a programmatic approach to managing a network. The tools covered in this chapter are available online and are very useful in terms of building skill and expertise. DevNet is a single place where network operators and developers can visit to practice any of the technology and examples covered in this chapter. You will often hear the following advice in various forms in reference to programmability: “Start small, but just start!” It is best to practice using a sandbox environment and just build code and run it to see what you can accomplish. The best way to learn any of these topics is to get started and practice. You are only limited by your imagination and coding skills! Remember to have fun and keep in mind that programmability is a journey, not a destination. Separate your learning into smaller, more manageable chunks. You will get better with practice and time.
Review Questions
1. Configuring network components via the CLI is considered a best-practice approach when dealing with a large number of devices.
True
False
2. To authenticate with Cisco’s DNA Center, which type of HTTP request method must be used?
PUT
PATCH
GET
POST
HEAD
3. What does CRUD stand for?
CREATE, RESTORE, UPDATE, DELETE
CREATE, READ, UPDATE, DELETE
CREATE, RETRIEVE, UPDATE, DELETE
CREATE, RECEIVE, UPLOAD, DOWNLOAD
CREATE, RECEIVE, UPLOAD, DELETE
4. What software allows for testing of RESTful APIs?
Google Postman
Ansible
TELNET
XML
JSON
SSH
5. Which of the following is in JSON data format?
{
  "user": "root",
  "user": "Jason",
  "user": "Jamie",
  "user": "Luke"
}
<users> <user> <name>root</name> </user> <user> <name>Jason</name> </user> <user> <name>Jamie</name> </user> <user> <name>Luke</name> </user> </users>rootJasonJamieLuke
[users[root|Jason|Jamie|Luke]]
6. What is the HTTP status code for Unauthorized?
201
400
401
403
404
7. What are some of the benefits of Source Control Management?
Keeping track of various versions of code
List of developers involved with code revisions
Collaborating with other developers and sharing code
Accelerating the speed of working on software projects
Real-time telemetry of the software database
Automatic blocking of malicious code
8. What are the PPDIOO lifecycle components?
Prepare, Plan, Design, Implement, Observe, Optimize
Prepare, Plan, Design, Implement, Operate, Optimize
Prepare, Plan, Design, Implement, Operate, Optimize
Plan, Prepare, Design, Implement, Observe, Optimize
Prepare, Plan, Design, Integrate, Observe, Optimize
9. Ansible uses the TAML syntax for creation of Playbook files that start with three dashes (---).
True
False
10. What is the proper command for executing a Playbook using Ansible?
ansible-playbook ConfigureInterface.yaml
ansible ConfigureInterface.yaml
play ansible-book ConfigureInterface.yaml
play ansible-book ConfigureInterface.taml
References
RFC 4741, “NETCONF Configuration Protocol,” R. Enns, Ed. Network Working Group, https://tools.ietf.org/html/rfc4741, December 2006.
RFC 6020, “YANG—A Data Modeling Language for the Network Configuration Protocol (NETCONF),” M. Bjorklund, Ed., IETF, https://tools.ietf.org/html/rfc6020, October 2010.
RFC 6241, “Network Configuration Protocol (NETCONF),” R. Enns, M. Bjorklund, J. Schoenwaelder, A. Bierman, Eds. IETF, https://tools.ietf.org/html/rfc6241, June 2011.