
Chapter 1
Internet of Things
This chapter covers the following topics:
The Internet of Things, also known as IoT, has become the latest industry buzzword. So what exactly does it mean? At its simplest, IoT is a network of things (or devices) that traditionally are not a part of a computer network (printers, laptops, servers, or cell phones). With all these things connected to the network, data can be collected off these things and extrapolated in ways that were almost impossible to imagine before. This information can be used to change the ways people have done things in the past and improve the way we live, work, play, and learn.
Business Transformation and Digitization
Over the past years, specific companies have dominated their respective markets. The barrier to entry has been high to enter a market, thus making it difficult for new companies.
Entrepreneurs realized that starting a new business in these markets required a new business model to overcome these barriers. By incorporating digitization—the act of transforming information into a digital format—new business models can be developed and thus change the paradigm. Digitization allows new companies to provide new benefits to customers while allowing them to compete with large, well-established businesses.
For example, ride-share companies like Uber and Lyft have revolutionized and transformed the taxi industry with the use of smartphones. Customers request a ride from their phone, are picked up, and are then transported to their destination seamlessly. The process of hailing a taxicab or trying to find a taxicab company (which varies from city to city) is simplified. Drivers can choose to work a number of hours based on their availability, making it easy for them to maintain work-life balance—and making it more desirable employment than working for a cab company. Digitization offers all these benefits to customers and employees while providing an experience that is better, faster, and cheaper than taking a traditional taxi.
Other companies like Airbnb and VRBO have disrupted the hotel markets. In fact, most companies have realized that they need to embrace the digitization process and look at other business models so that they can maintain their existing customer base while acquiring new customers through different business use cases.
Digitization is occurring in all market verticals, including banking, healthcare, manufacturing, utilities, real estate, mining, and even government municipalities. In all these markets, organizations are collecting more data, analyzing the data in real time, and taking action based on the real-time analysis of that data.
IoT technologies are a component of a company’s digitization architecture. The following market segments are already deploying IoT technologies:
Manufacturing
Mining
Oil and gas
Utilities
Smart buildings
Health and medical
Retail
Hospitality
Transportation
Connected cities and emergency services
IoT Fundamentals
The first computer network derives from the mainframe architecture. Mainframe computers contained massive amounts of processing power, storage, and memory. Mainframes were very expensive to acquire and operate, but they could run multiple programs simultaneously, making them cheaper than other computer systems at the time. Direct console access to the mainframe was limited, and users were force to connect to the mainframe from “thin” (dumb) terminal clients via the first computer network.
As processors became more powerful and easier to manufacture, personal computers provided a lot of functionality at a smaller cost, allowing smaller companies to have access to the benefits of a computer without the costs associating with owning and maintaining a mainframe. Computer networks evolved as they no longer connected thin terminal clients in a small network, instead connecting multiple devices spread across large geographical boundaries.
The protocols to communicate between devices evolved and became more complicated, and they could no longer be managed by the mainframe team. Today, most corporate computer networks are managed by the information technology (IT) departments.
Just as the design of these IT networks evolved as more and more computers were connected to them, the network architecture for IoT networks must evolve too. Traditional IT networks follow the common Access-Distribution-Core model that can connect thousands of devices.
An IoT network is often associated with operational technology (OT), which is defined as the hardware/software that influences physical processes through direct monitoring and/or control. OT networks exist in manufacturing facilities. For example, a programmable logic controller (PLC) is responsible for controlling the movement of motors in robots or conveyors based on feedback from sensors. The OT network connects the PLCs, robots, and sensors together.
An IoT network must be able to scale to handle hundreds of thousands of devices or possibly more. IoT networks become more complicated because they can be large scale (hundreds of thousands) and consist of different devices that communicate with different protocols.
Note
OT and IoT networks are often maintained by engineers who are not from IT departments and hence might not be familiar with traditional IT best practices.
IoT Architecture Models
IoT networks are similar to the first computer networks, which ran multiple network protocols like IPX/SPX, NetBEUI, and TCP/IP. IoT networks must support a range of devices that use a variety of protocols. This is because the hardware refresh cycle is longer than corporate IT systems. As new systems are installed in some parts of a facility, the older systems using different protocols are not updated. Connecting devices that use different protocols requires some skill, and the architecture must also be able to scale to thousands of things while providing security.
Some common IoT architecture models are discussed next.
Machine-to-Machine (M2M) IoT Architecture
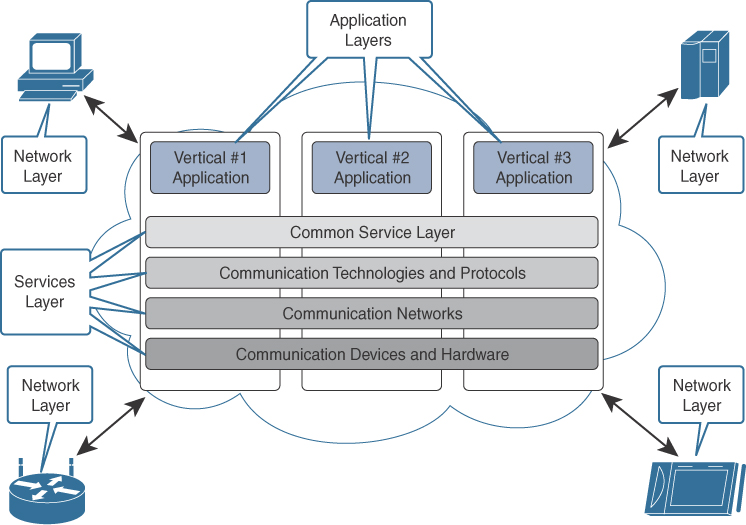
In 2013, the European Telecommunications Standards Institute (ETSI), 13 of the founding members, launched an initiative to generate a reference M2M IoT architecture. A key concept was the use of stacks, similar to that of the Open Systems Interconnection (OSI) model used in networking. A key benefit to using stacks is that a component in a stack can be swapped out without impacting the components of the stack next to it.
This provides benefits in the IoT space, considering that multiple things made by different manufacturers often must communicate using different protocols. The M2M IoT architecture focuses on IoT services, applications, and networks by providing interoperability through a variety of application programming interfaces (APIs):
The IoT M2M application layer is focused on providing connectivity of things to the applications. A key component is that the application layer is responsible for tying into other business intelligence (BI) systems.
The services layer refers to the logical components of the network and the management protocol they use.
The network layer refers to the realm in which the things and other devices communicate. It includes the physical network that links them together.
Figure 1-1 demonstrates the machine-to-machine IoT reference architecture.
The IoT World Forum (IoTWF) Architecture
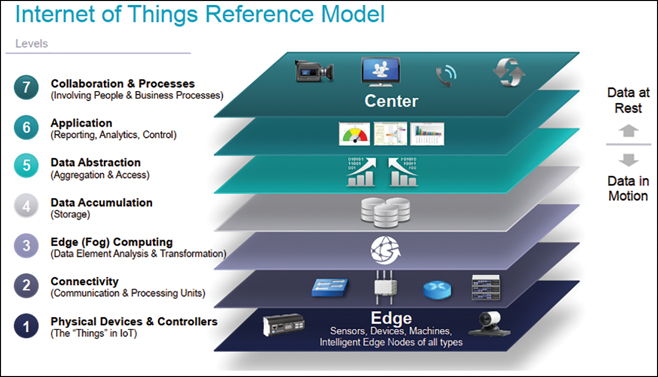
In 2014, while in Chicago, the IoTWF created a seven-layer architectural reference model. This model provides clarity and simplicity through visualization of all the IoT components: sensors, network, computing, and storage. The model consists of the following seven layers:
Physical Devices (Layer 1): The bottom layer, which contains things (devices, sensors, and so on).
Connectivity (Layer 2): This layer provides connectivity among things in Layer 1, Layer 2, and Layer 3. Communications and connectivity are concentrated in this one level.
Edge Computing (Layer 3): The functions in this level are determined by the need to convert data into information that is ready for processing at a higher level.
Data Accumulation (Layer 4): This layer is responsible for storing data that was traditionally transmitted live across the wire. The storage of the data allows for analysis or computation at a later time.
Data Abstraction (Layer 5): This layer is responsible for rendering data and its storage in ways that enable the development of faster or simpler applications. It is responsible for reconciling multiple data formats from different sources, assuring consistent semantics, and confirming that the data is complete.
Application (Layer 6): This layer is where information is analyzed and interpreted.
Collaboration and Processes (Layer 7): This layer encompasses people and processes. In essence, this layer is responsible for providing people the right data, with the right analysis, at the right time so that they can engage the correct process.
Figure 1-2 demonstrates the IoT World Forum Reference Architecture.
Common IoT model
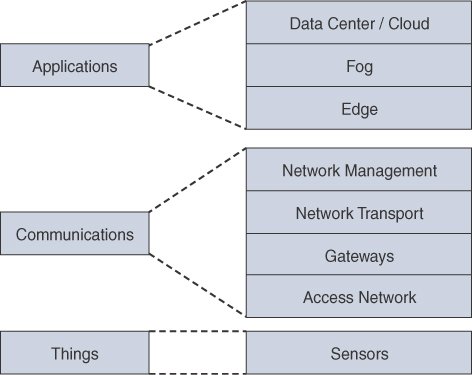
Multiple other IoT reference models have continued to evolve over the years. Some of the models have minor differences between them, whereas others have major differences in how they interact. A simplified IoT Architecture consists of the following:
Things
Communications
IoT applications
Figure 1-3 demonstrates the components of the Common IoT model that will be discussed in the following sections.
Things
As a simple definition, a thing is a device that provides relevant information. The intelligence on a thing can vary from device to device. Communication between things can occur in the following manners:
Unidirectional: A temperature sensor collects the current temperature from its local thermometer and sends the temperature to a management device for analysis.
Local: A manual thermostat can collect the current temperature for its internal thermometer and then turn on or off an HVAC (heating, ventilation, and air conditioning) unit.
Bidirectional: An electronic thermostat can collect the current temperature from its internal thermometer and then send the data to a management device for analysis. The management device could send a signal back to the thermostat to turn on or off the HVAC unit.
A smart thing (also known as a smart object) can take relevant information from the data it receives and take appropriate action after analysis of that information. Some of the newer wireless electronic thermostats are examples of a smart things because they have the capability to be programmed remotely.
Some electronic thermostats can poll a remote temperature sensor and average the temperature of its local sensor to identify the average temperature before turning the HVAC unit on or off. To some people that might not seem very “smart.” However, what if the electronic thermostat could check two different types of sensors? The electronic thermostat could check a temperature sensor and a sensor attached to a door to see if the door is open. If the door is open, turning on the HVAC system would result in a waste of electricity, and now the thermostat has relevant information about whether the cooled air would just flow out through the open door.
Here are some of the common sensors used in an IoT infrastructure:
Temperature: These sensors collect temperature and report temperature at set intervals.
Vibration: These sensors collect movement across one, two, or three axes. Vibration sensor is a generic term for proximity sensor, displacement sensor, and accelerometer. The frequency of the vibration and application depends on which sensor is used.
Pressure: These sensors can report back liquid or air pressure.
Air quality: These sensors can report air quality, or the chemical breakdown in a specific area. They can be used to detect chemicals that are harmful to humans without protective gear, an improper balance of chemicals for a specific manufacturing process, or the release of toxins into the air that do not meet governmental standards so that the general public can be informed.
Water quality: These sensors report water quality, or the chemical breakdown in the water. Water is a vital component for manufacturing. It can be used for cooling of equipment, for washing of material as a phase of manufacturing, and for the cleanup process. Generally, manufacturers try to reuse their water supply when they can, but certain processes require the water to have an acceptable level of nonstandard components, which could result in the water needing further treatment before reuse.
Energy consumption: Energy consumption is observed and reported as electricity is consumed from the perspective of a wire, electrical component (such as a circuit breaker), or the motor itself.
Location: Location sensors could be GPS sensors that provide specific latitude and longitude, or they could be enabled with a unique wireless signature (Wi-Fi, Bluetooth, and so on) where they can be detected via antennas by an existing wireless infrastructure, and the location can then be calculated using triangulation based on signal strength at multiple radio towers.
Occupancy: Occupancy sensors can track if an area is being occupied or the number of occupants in an area. This information can be correlated with occupancy in an area at a specific time, which is helpful for identifying resource utilization. Some occupancy sensors have mechanisms to identify one person from another to track repetitive occupancy/utilization.
Video: Video can be used as a livestream camera or can be stored for analysis or replay at a specific point-in-time. Video sensors can be used for a variety of use cases, from physical security to occupancy sensors, for assisting with the visual inspection of manufacturing processes, and for locating a specific person for law enforcement reasons.
Note
Vibration, energy consumption, and location sensors are used in some of the most common business use cases.
Vibration: Placing vibration and torque values on motors and machines allows computers to detect when a failure will occur on a device (motor, engine, truck, robot, and so on). This allows maintenance to be scheduled in advance and repairs to be made without affecting other processes. For example, if a rock truck breaks down in a mine, it blocks the tunnel, preventing other rock trucks from passing in the tunnel. The broken-down rock truck must be towed out of the tunnel to allow operations to be restored. During this time, the mine cannot haul raw product.
Energy consumption: Users and businesses are now capable of tracking the amount of energy being consumed in real time. This may result to changes in how a business uses a building or machine in an attempt to lower its cost. However, by connecting these sensors with the utility companies, businesses can now create smart grids. This allows companies to detect power outages and pinpoint failure locations quicker so that service can be restored. Another benefit of using a smart grid is that it allows consumers to use green technologies like solar power to run their homes, or return power to the grid.
Location: Location sensors allow for real-time location services (RTLS) such as the following:
Enabling the transportation industry to track its vehicles and make that information available to its customers.
Locating specific resources (forklifts, torque tools, laptops, and so on) quickly. These sensors can also be used for inventory management for manufacturers.
Locating employees. Generally, this is done to locate an employee with a specific skillset, but could also be used for man-down safety reasons in chemical/refinery environments.
Restricting or prohibiting certain things or devices from entering a specific area. When an area is defined in the RTLS system, when a tag crosses the barrier, it creates an alarm. This is known as geo-fencing.
Table 1-1 provides a high-level overview of typical IoT sensors used in various market verticals.
Table 1-1 Things and Market Segment Consumption
Manufacturing |
Mining |
Oil and Gas |
Utilities |
Smart Buildings |
Health and Medical |
Retail |
Hospitality |
Transportation |
Connected Roadways |
Emergency Services |
|
Temperature |
|
|
|
|
|
|
|
|
|
|
|
Humidity |
|
|
|
|
|
|
|
|
|
|
|
Vibrations |
|
|
|
|
|
|
|
|
|
|
|
Pressure |
|
|
|
|
|
|
|
|
|
|
|
Occupancy |
|
|
|
|
|
|
|
|
|
|
|
Air Quality |
|
|
|
|
|
|
|
|
|
|
|
Water Quality |
|
|
|
|
|
|
|
|
|
|
|
Energy Consumption |
|
|
|
|
|
|
|
|
|
|
|
Location |
|
|
|
|
|
|
|
|
|
|
|
A variety of variables and factors need to be taken into account concerning the type of smart thing that should be used. Specifically, the type of data and business use cases should always dictate which sensors are to be used. The selection of things used should also take into account the following items:
Power source: Is the power source wired or battery driven? If battery driven, how long can the battery last, and how often does it need to be replaced or recharged?
Ability to move: Is the thing physically attached to an immovable object (steel beam, pole, and so on) or is it mobile via a wearable, attached to an animal or a cart?
Frequency that data is transmitted: How often is data expected to be transmitted from the thing? The amount of data and frequency can directly correlate to the life of the thing before a temporary power source must be recharged or replaced.
Connectivity method (wired or wireless): How does the thing communicate with other devices? Does it use a wired technology (serial, Ethernet, and so on) or does it use a wireless technology? The transmission rate for that media and distance to the next upstream network device should be accounted for, too.
Density of things: How many things are needed in an area to effectively capture data? Can data be transmitted through other things like a mesh network?
Processing capability: Not all IoT devices have the same amount of processing power or storage. These components vary based on the function and size of the device and directly correlate to the cost.
Communications
This layer provides a mechanism to communicate with other things or external sensors. This layer contains the following constructs:
Access network (medium)
Gateways
Network protocols
Data exchange protocols
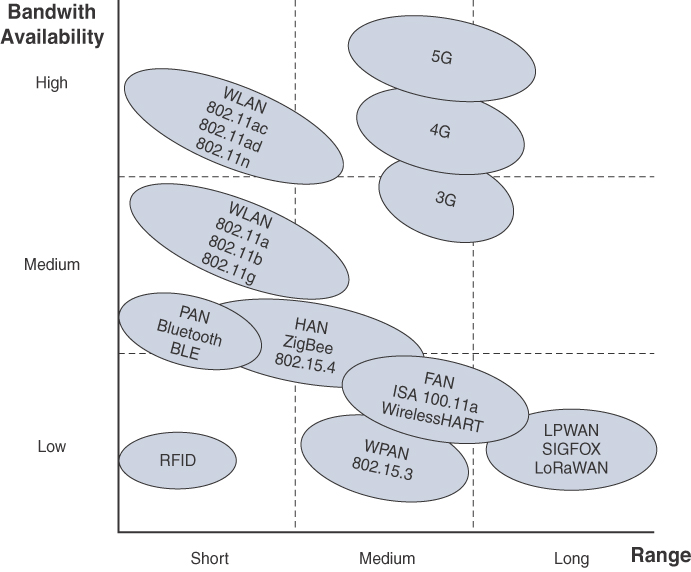
Access Network (Medium): This sublayer refers to the physical medium or wireless technology that is used to provide connectivity between things. Specifically, it is connectivity for thing-to-thing communication, or it provides a centralized aggregation on the network. Physical cables provide consistent availability and bandwidth but are not always available because of cost (initial procurement and/or installation) or not feasible for things that are mobile.
In these circumstances, wireless technologies are commonly deployed. As a general rule of thumb, bandwidth decreases as the wireless range increases. Figure 1-4 demonstrates some common wireless technologies that correlate with a technology’s ability to cover bandwidth against the range available. It is important to take into consideration power consumption and cost when selecting a technology. In general, power consumption and cost increase with high throughput and higher distances.
This sublayer consists of networks that group things as follows:
Personal area network (PAN): The network around a person. Bluetooth is a common technology used in PANs.
Home area network (HAN): The network around a home. This includes Bluetooth Low Energy (BLE), ZigBee, and 802.11 Wireless.
Local area network (LAN): Network around local devices. Most IoT environments prefer to use Category 5/6 cabling because most electricians can repair replace this cabling. Category 5/6 cables are restricted to 100m for signal integrity. Fibre optic cable can be used to exceed this restriction but is not as commonly used in a LAN environment because of the limited workforce that can service this medium.
Field area network (FAN): Network around a large field area. In general, the FAN is a wide-open area that covers less than 4km.
Wide area network (WAN): Network that provides connectivity between sites kilometers apart.
Low-power wide area network (LPWAN): Wireless network that is designed for long-range communications using low power because devices are powered by battery. LoRaWAN and SIGFOX are common LPWAN technologies.
Gateways: As a simple definition, gateways provide a method of connecting different technologies together through translation at the highest portion of the networking stack. Gateways map semantics between two different things and perform translation between devices. It is important to note that gateways do not just provide protocol translation, but that they can merge different architectures.
From the connectivity context, the gateway connects PANs, HANs, LANs, FANs, LANs, LPWANs to the backbone network. Gateways connect to a backbone network to provide a high-speed and hierarchical architecture.
Gateways can provide a method of aggregation of things and for processing data at the edge of the network. This concept is explained further in the “Data Transportation and Computation” section.
Note
There is a direct correlation between the increase in cost and operational complexity and the number of technologies and protocols that are merged into a design.
Network Protocols: The network protocol is an essential component for all network transmissions. It is responsible for locating things on the network and controlling the flow of data. The transport layer collects all the data and prepares it into a format that can be presented to an application.
The network protocol should be an open standard considering that most IoT networks come from devices and things from different manufacturers. Proprietary protocols would require translation and introduce complexity when things communicate with proprietary protocols with other manufacturers’ things that do not have access to them. The Internet Protocol (IP) has been well established and has become one of the de facto network protocols for IoT.
Note
Network protocols include the IPv6 protocol too. The use of IPv6 is encouraged because the address space does not have the limitation of the IPv4 protocol. In fact, multiple IoT specifications such as 6LoWPAN and RPL do not include IPv4.
Data Exchange Protocols: The flow of data between things and systems must either be initiated or requested. Some sensors will push data at regular intervals, whereas other sensors require polling of information (also known as a pull). Table 1-2 displays multiple data exchange protocols and some key factors used for selecting a data exchange protocol.
Table 1-2 Well-Known Data Exchange Protocols Consumption
Protocol |
Transport |
Format |
Discovery Mechanism |
Function |
Constrained Application Protocol (CoAP) |
UDP |
Binary |
Negotiation and well-known URI. |
REST resource manipulation. Resource tagging with attributes. Resource discovery. |
Extensible Message and Presence Protocol (XMPP) |
TCP/HTTP |
XML |
Server with Presence announcement. |
Manage presence. Establish sessions. Data transfer. |
Message Queuing Telemetry Transport (MQTT) |
TCP |
Binary |
Things connect to a message broker. |
Publisher/subscriber. |
IoT Applications
Now that all of these smart things can communicate with each other, the true power of IoT can be realized with the usage of applications. IoT applications are classified as analytic and control applications.
IoT Analytic Application: This type of application collects information from multiple things and organizes it in a manner such that calculations can be made easily. Analytic applications can provide historical data, trends, and suggestions based on the results calculated.
An example of an IoT analytic application could be one that collects the amount of energy consumed in a manufacturing plant on a thing-by-thing basis. The analytic application could provide reports that contain power consumption on a daily basis that could be correlated with the types of machines and product yield for that day. The plant planner could make changes to his schedule or process based on this information to improve efficiency.
IoT Control Application: This application controls smart things. A key concept is that the IoT control application contains the ability to process logic that the smart thing does not contain, or to provide a level of orchestration across multiple things.
An example of an IoT control application comes from the oil and gas segment, where oil needs to be moved from one location to another. The application would open the necessary valves in the pipeline and then start the pumps so that oil can flow from one location to another. In this example, the valves would not have any knowledge of the pumps, or vice versa, and the control application would orchestrate turning the pumps on/off or making the valves opened/closed.
It is important to note that some IoT applications can perform both control and analytic functions.
Note
Smart services are IoT applications that increase overall efficiency. For example, a program on a thermostat that can detect if a door is open and overrides the thermostat from turning on the HVAC system can be considered a smart service.
The design of an IoT application must take into account the data structure, frequency, size, and volume of the data transmitted. All of this information directly correlates to the volume of the data transmitted from things to the IoT applications:
Structure: Data exists in either a structured or unstructured format when it is transmitted and stored. Structured data is organized in a logical manner and provides a consistent form of data entry. Unstructured data comes from human language. The same data that is sent in structured format could be sent in unstructured format, but would require context to understand where that data maps.
Frequency: The timeframe in which a thing will transmit data to another thing.
Size: The size of the data correlates to whether the data is structured or unstructured. If the data is structured, then every field should be examined to identify whether or not it truly is necessary, because every field will contribute to the size of the update sent from thing to thing.
Volume: The volume directly correlates with the type of data, frequency of transmission, size of the data, and the number of devices. If a thing transmits 10KB of data every 5 seconds, this might not seem like a large amount of data. However, if there are 1,000 such things, then the total amount of daily data is 172.8GB.
On the other hand, if a thing transmits 100KB of data every minute and there are 1,000 such things sending data; then the daily data amounts to only 144GB. So even if a thing sends more data, if the frequency is lower, then the overall amount of data is lower.
Data Transportation and Computation
Normal corporate networks use a hierarchical network model that divides the network into three layers: core, distribution, and access. Most end-user devices connect to the access layer, and the data center (DC) connects to the core devices (or a server switch block that connects to the core). Most of the data is generated, stored, and processed in the data center.
However, IoT networks generate almost all of their data at the access layer. IoT networks are generally very large, and they must scale appropriately to handle the data from all of the smart things. The data structure and number of smart things directly correlate to the volume of traffic that is analyzed.
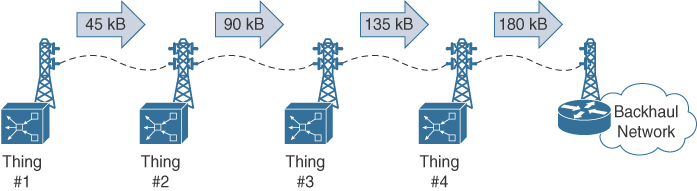
A large IoT network with a million sensors that transmit 15KB of data every 30 seconds can result in 1.8 terabytes (1,800,000MB) of data on an hourly basis (~16 petabytes of data annually). IoT networks of this size must take into account the amount of available bandwidth the access layer has. Depending on the physical access medium, an update could saturate the link.
Figure 1-5 demonstrates four things that transmit via radio towers that can only support 150KB of network traffic. The size of an update is 45KB, which can easily pass across a 150KB link. However, when Thing 1’s packet is combined with the updates for Things 2, 3, and 4, the total data exceeds the supported speed of the radio towers. There is not enough bandwidth for all four things’ updates.
Connected vehicles can generate large amounts of data that exceed 20GB per day. The transfer of this data to the manufacturer on a daily basis is not necessary because most of the relevant processing should be performed within the vehicle. Only a small subset of the data generated is needed by the manufacturer to understand how the vehicle can be improved based on its usage.
Data Center and Cloud
Data centers are the heart of delivering IT services by providing storage, compute resources, communications, and networking to the devices, users, and business processes and applications. Data centers are designed with proper power and cooling requirements to sustain large amounts of servers for the processing of data. Recently, data analytics have added value and growth in data centers by touching on aspects of an enterprise and its processes.
The growth of cloud-based services is due to an increased focus on business agility and cost optimization. The adoption of cloud services and applications enables faster delivery of services with improved operational efficiencies. Connecting to public-based cloud services can provide additional cost reductions with improved accessibility, with the assumption that a mechanism exists to encrypt/protect the data in transit.
Latency can become an issue with sending all the data from sensors to the cloud or DC. Depending on the amount of time for a packet to transmit from a thing to a DC, analysis of the data at the DC with the proper response sent back to the thing could exceed an acceptable amount of time. For example, suppose a camera takes a photo of a manufacturing line as parts leave a stamping press for visual inspection as part of the quality control process. Inferior parts should be discarded and removed from the conveyor belt as they are moved to the next station. If there is too much latency, a failed part could move down the conveyor belt. One solution could be to lower the speed of the conveyor belt, but that might reduce the performance of that manufacturing facility.
Placing compute resources in a hierarchical fashion can result in reducing latency, conserving network bandwidth, and increasing local efficiency.
Fog Computing
Fog computing provides a mechanism for reducing data crossing the network by converting flows into information that is ready to be stored or processed at higher levels. The processing occurs in the gateways and network devices.
Note
The term “fog computing” comes from the fact that the processing is occurring close to the data source, which is similar to how traditional fog is close to the ground. This is in direct contrast to “cloud computing,” which is far away from the source and often outsourced to a third party.
Fog computing can reduce the amount of northbound network traffic through analysis and reduction of data transmitted. The reduction of data occurs outside of typical network data compression techniques. Most network data compression is a data de-duplication algorithm that examines crossing between two devices for redundant patterns. This means that a device examines packets looking for patterns in incremental sizes (for example, 4KB, 16KB, and so on) and creates a signature for each of those patterns. If the pattern is sent a second time, the data is replaced with a signature by the first network device. The signature is sent across the WAN link and replaced with the data by the second network device. This drastically reduces the size of the packet as it crosses the WAN, but still keeps the original payload between the devices communicating.
Analysis and reduction of data could result in changing the way the data flows. For example, if a sensor is sending temperature data from a sensor in 5-second intervals that includes just the sensor’s IP address, temperature, and timestamp, this could result in a 5KB packet being sent every 5 seconds (60KB a minute). However, if the temperature is constant, the fog device could send the first update, which includes the sensor’s IP address, temperature, and start time, but not provide an update if the temperature stays the same. When the temperature does change, the fog device would send a 6KB update that includes the sensor’s IP address, temperature, and the start and stop times for that temperature cycle. It would then send a second update with the sensor’s IP address, the new temperature, and start time.
Just within the timespan of a minute, the fog device reduces 60KB of traffic to 11KB if the temperature does not change. Now if the temperature remains consistent for 1 hour, that would result in a difference of 3.6MB of data, compared to 11KB, which is a drastic reduction in data transmitted.
It is possible for fog computing to be placed into a hierarchical format. For example, a large refinery can contain 100,000 temperature sensors. A fog device could be responsible for receiving and reducing the data that is sent for 1,000 sensors. The fog device could then report to another fog device that receives information from the 100 lower-level fog devices, thus providing a holistic view of the entire refinery with a minimal amount of relevant information to compute in the data center.
Note
Another common use case for fog computing is the translation of information between different network vendors. For example, one sensor may report temperature in Fahrenheit and a different sensor may report temperature in Celsius. It is important for the data analysis to be consistent, so the fog device could translate both sensors’ temperature to Kelvin before transmitting for computation.
More information can be found at http://www.openfogconsortium.org.
Edge Computing
Fog computing presents multiple benefits to IoT applications at a very quick pace because of its location to the devices and sensors. Those same advancements could further be refined by increasing the amount of compute resources on the actual smart things. This allows for basic low-level analytics to be performed, and for even faster decisions to be made. In addition, edge computing can still occur and provide feedback to the local operations in the event of a network failure.
Note
The term “mist computing” has been assigned to edge computing because mist is even lower to the ground when compared to fog.
Hierarchical Computation Structure
The use of edge, fog, and centralized computing (data center and cloud) should be structured in a hierarchical manner to provide the most efficient form of processing. The following constructs should be used:
Time-sensitive data should be analyzed as close to the data source as possible. Processing should occur at the edge or fog node.
Fog nodes should be used as aggregation points of data to reduce the load on the network. This is especially critical in places that have low-bandwidth medium access to reach the gateway/backhaul network.
Data can be stored at smaller on-site data centers for local analysis so that actions can be taken by local resources if necessary. However, in general, all of the data for all sites and facilities is housed in a centralized data center or cloud environment to provide historical analysis and long-term storage.
The IoT network architecture needs to take into account multiple factors, such as the amount of data that the things generate, the density of things (from a cell, area, or region), the network access medium, application latency requirements, and the duration for which data is retained.
IoT Security
A key component of any organization is the data it has. It provides a mechanism to differentiate the organization from its competitors or as an incentive to form partnerships with other organizations. Most users assume that steps have been taken to protect their sensitive data. A properly designed network provides data confidentiality, integrity, and availability. Without these components, a business might lose potential customers if they think their information isn’t secure.
The following list details the terms and functions associated with data confidentiality, data integrity, and data availability:
Data confidentiality: Ensuring that data is viewable only by authorized users. Data confidentiality is maintained through encryption.
Data integrity: Ensuring that data is modified only by authorized users. Information is valuable only if it is accurate. Inaccurate data can result in an unanticipated cost (for example, if a product design is modified and the product then does not work). When a product breaks, the time it takes to identify and correct the issue has a cost associated with it. Data integrity is maintained via an encrypted digital signature, which is typically a checksum.
Data availability: Ensuring that the network is always available allows for the secure transport of the data. Redundancy and proper design ensure data availability.
Other factors must be taken into consideration when we are securing an OT network versus an IT network. With an OT network, the following factors must be considered:
Greater scale: The effects of an outage caused by a security incident could result in a power grid that covers multiple states being shut down.
Physical safety: The compromise of a system could result in the injury of a worker, negative impact to surrounding the environment, or death. If an IoT system for a refinery is compromised, it could open valves that release dangerous or explosive chemicals into an area.
Product quality: The shutdown of the manufacturing processes for some products, or if the processes are modified maliciously, could result in the manufacturing of inferior products that could fail later. Imagine a scenario involving the structural integrity of a product being modified. When the product is later installed and fails, it could result in injury to people years after the security breach.
Software updates: Most of the devices in an IoT environment are older and typically do not receive software updates. Some devices might not receive an update because they are in use 24×7 for manufacturing processes. This results in things running software with potential defects that can be exploited.
Data leaks: Some environments are closed systems (like utilities), so ensuring data confidentiality is critical.
Conflicts between OT and IT teams: It is very common that IT and OT teams do not trust each other. Ensuring a consistent security model between two different teams that do not trust each other can prove to be a difficult task. Another factor is that IT teams will typically attempt to block traffic when an attack is detected, whereas OT teams will allow manufacturing cycles to continue and then attempt to remediate the systems during the next break in the manufacturing cycle. The OT teams use this logic because of safety concerns for shutting down a system for the aforementioned reasons without following preventative processes for the problems identified.
Threat Vectors
A threat is a possible danger to an environment; it could be natural, accidental, environmental, or malicious. Information security (InfoSec) engineers are primarily concerned with threat vectors (methods for maliciously attacking an organization) and putting mechanisms in place to reduce them.
Most enterprise environments use a castle security theory and rely heavily on applying security technologies only at the perimeter of a network that includes the following:
Ecommerce connectivity: These are servers exposed on the Internet that provide additional information to customers or business partners. Generally, hackers are attacking the servers using known software vulnerabilities to gain administrative privileges. Generally, this segment is protected with a firewall, intrusion protection system (IPS), and by ensuring that operating systems and applications are patched for security exploits on a timely basis.
Business-to-business links: These are direct WAN circuits or point-to-point VPN links between business partners to exchange data. Generally, these are safe networks, but a company must protect itself from partner companies in case of malicious activity or if the partner company were to be compromised. This segment is protected with a firewall and IPS system.
Email: Email is a critical component to any business these days. It provides communication both internally and externally, and normally there is no form of authentication for receiving email from an external sender. This makes it a great technology for sending phishing attacks or embedding malware in attachments to users. This segment is protected with a combination of techniques that use DNS, and/or appliances/cloud-based services that specialize in the scanning of content, URLs, and attachments for known attacks and malware.
Internet connectivity: The Internet is one of the largest threat vectors for enterprise networks. It is extremely easy for a user to be directed to a malicious site that infects their machine with a virus or malware that could then spread to other computers on the network. This segment can be protected with web proxy servers that use the categorization of websites to ensure users can access known-safe sites and that scan content. However, these services are not available when the user takes their work laptop home and tries to access the network. Deploying an antivirus or antimalware client to all of the local computers can provide a second layer of defense for this attack vector.
It is important to realize that the threat vectors for an OT network expand drastically when compared to an IT network. The first major component that must be taken into consideration is the scale of the devices in use. An enterprise with 1,000 employees might have a couple hundred servers in a data center and therefore is looking at about 1,300 to 1,500 potential points of compromise. On the other hand, a small refinery with 1,000 employees might have a couple hundred servers as well as 20,000 sensors spread across the plant. Therefore, that refinery could have about 22,000 to 23,000 potential points of compromise.
Starting at the bottom of the Common IoT model, things become the first point of compromise. Some of these things have very small and limited processing capability. Most of the smaller devices probably will not have a method to secure access to their operating system. Even if they did, how can 20,000 things be patched upon discovery of a security exploit? This comes with the assumption that the device manufacturer is aware of the exploit and produces a patch.
The next threat vector comes from the fact that a majority of the manufacturing protocols are insecure. When Profinet, CIP, EthernetIP, and Modbus were built, the programmable logic controllers (PLCs), robots, and other devices all had minimal compute and memory resources, so the protocol was built with efficiency in mind. Security was never taken into consideration because the devices operated in a closed-loop environment.
The physical access can present challenges to securing the network, too. Most OT engineers are concerned with basic connectivity when connecting devices with Ethernet. OT engineers would deploy unmanaged network switches that could not support 802.1x network access control (NAC). The more advanced OT engineers have learned the benefits of a managed switch, but still have yet to deploy 802.1x NAC. In either scenario, anyone can walk up to a switch and have direct access to PLCs, robots, or other components of a network.
Note
Many companies have had their OT networks impacted or shut down because a vendor attached to their network and did not have InfoSec protections that matched the company standard and accidentally released viruses into their company’s network.
Note
Just like some manufacturing protocols do not have security mechanisms included, some of the wireless mediums like LPWAN are built for small packets using low bandwidth, so the use of encryption technologies could have a significant impact on the amount of traffic that can be transmitted across them.
Securing IoT Networks
Developing a security strategy for an IoT network must take into account the OT network priorities:
Availability
Integrity
Confidentiality
Availability takes priority because an IoT network directly correlates with the capability to generate revenue. If an IoT network is down, it could result in hundreds of dollars to millions of dollars of lost revenue per hour. These values are calculated by loss of goods manufactured, wasted man-hours (assembly workers are still paid even if a robot fails on the line), wasted raw product, or financial penalties for failing to meet service level agreements (SLAs) for delivery of utilities (that is, power 99.999% of the time).
Integrity is vital to ensure that data is not manipulated in transit. Manipulated data could result in analytics that result in a different change to a process (that is, the addition of an extra chemical that makes a chemical compound unstable) or that ensure that traffic between a PLC and robot is not modified maliciously (thus causing a motor to break). Integrity is maintained via an encrypted digital signature, which is typically a checksum.
Confidentiality ensures that data is only viewable by authorized users. Data confidentiality is maintained through encryption. The type of data being transmitted between IoT devices typically dictates a company’s requirement for confidentiality of that data. For example, the torque being reported by a manufacturing robot might not require confidentiality, but information flowing across an electrical power grid might require confidentiality for safety reasons.
Note
Some industries contain InfoSec engineers for IT systems, but they do not have InfoSec engineers for OT systems. This results in different levels of security at the OT level, depending on the facility.
IoT Security Model
The Purdue Model for Control Hierarchy is a well-known model among manufacturing, oil and gas, and utility markets. The Purdue model places devices and equipment into seven hierarchical functions, as illustrated in Figure 1-6.
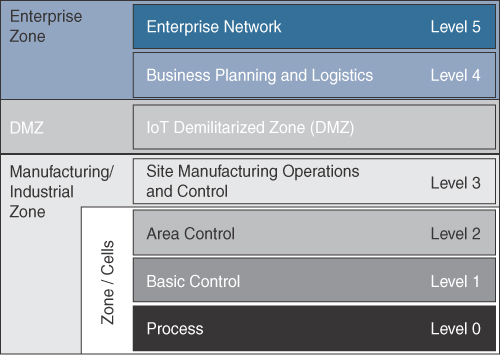
The model consists of the following zones:
Enterprise Network: This is composed of enterprise-level applications that consist of a document repository, sales and billing databases, along with Internet and remote VPN access.
Business Planning and Logistics: This level contains IT-based applications that include scheduling and planning systems such as manufacturing resource planning (MRP). This can also include other services like email, voice, and instant messaging.
IoT Demilitarized Zone: This level is not assigned a number, but it provides a barrier between the manufacturing/industrial and enterprise zones, while allowing users to securely share data and services. All traffic from either side of the DMZ stops in the DMZ. It is possible for a system from the enterprise zone to communicate with a system in the demilitarized zone that triggers a job to send information into the manufacturing/industrial zone. The DMZ should be the only path for traffic in to and out of the manufacturing/industrial zone.
Site Manufacturing Operations and Control: This level includes systems that manage and orchestrate an entire system to produce an entire product. This can include OT network management tools, production scheduling, security management, and control-based applications.
Area Control: This level includes application programming for an entire area or line. It includes access to tools that control a line (that is, human-machine interface, or HMI) and historians that capture data.
Basic Control: This level contains information from within a smaller area or zone of a manufacturing process. There may be HMI interfaces, but it does not allow for control of devices outside of that zone.
Process: This level controls motors, robots, and sensors. In general, these devices will communicate in this area with PLCs that control them.
Deploying proper security mechanisms in an IoT network should use the following technologies and techniques.
Network Access Control
Most IT-based systems provide authentication within the application itself. For example, a login is required to access a file server or an email account. So even if a user was able to gain access to the network, they would still have to bypass the security mechanisms for that application.
However, OT systems do not have these security components integrated into them because they were developed in a closed loop system. This means that access to the network needs to be restricted to only approved users and devices. When NAC is deployed, users can plug in their computers to a network port, but they will not be able to send or receive network traffic until the NAC system grants them access.
Authentication
The central component to NAC is the authentication layer used to provide and verify the identify information of an endpoint. In IT environments, the identity is associated to a user ID; however, in OT environments, the identity must be linked to a device. The identity could be a MAC address, static user credentials, certificates, or some other form of hardware identification.
Authorization
The second component is authorization, which controls the amount of access a device has when connected to the network. This layer builds upon the core authentication layer by leveraging the identity information. For example, one user can authenticate and have access to the entire network, whereas a different user can authenticate and have access to only the email servers.
Vendors are further expanding the capabilities of NAC by adding context. For example, a U.S.-based employee may be able to authenticate to the network while visiting his company’s office in Australia, but the NAC system can detect that he is out of the country and restrict his access. Context within NAC can now check the following items:
Platform (Windows, Macintosh, Android, Linux, and so on)
Operating system version
Patches installed
Antivirus installed
Device that is authenticating the user (abstracting location of the user, too)
Network traffic patterns
Most IoT devices and applications do not have a built-in authentication mechanism to prevent unauthorized access. This limitation can be overcome by deploying NAC globally in an environment to restrict access to devices by user ID and dynamic ACLs, TrustSec, or similar technologies.
Network Segmentation
The role of the network engineer is to ensure that network traffic can flow from one device to the other, and the role of an InfoSec engineer is to put security measures and controls in place to keep the network safe. The Purdue model does a great job of forcing segmentation between the IT and OT networks, but IT and OT networks are still vulnerable to east/west traffic. For example, assume that a user/device becomes infected with a computer virus in one portion of the network. Because access is not restricted in an area, the virus can spread freely to all the devices within the same network segment.
Outbreaks like this have forced network engineers to become more conscious of security. They are being forced to understand the traffic patterns between devices and insert security mechanisms to permit only business-relevant traffic between areas of the network. This same concept needs to be applied to the OT space because most systems only need to communicate within their area. It is the fog or edge devices that need to communicate northbound, and that traffic could then be inspected further by firewalls or intrusion protection systems.
Figure 1-7 demonstrates a set of four manufacturing cells. Each cell contains its own HMI stations, PLCs, input/output blocks, and robots. There is no interaction between these cells. Proper network segmentation would block communication between cells at the area switch. This can be accomplished with ACLs, private VLANs, or by forcing traffic through a firewall at a higher level.
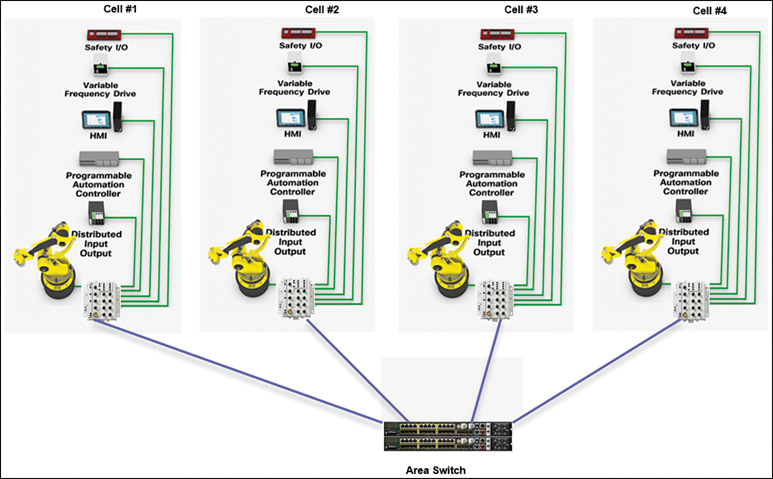
Note
Network segmentation should occur at every level possible: the cell, area, and zone. Conduits are then created to allow proper communication between devices that need to talk to each other.
Network Visibility
Historically, InfoSec engineers would review the logs and information provided to them from their firewalls and intrusion protection systems to detect security incidents. This information would be fed into a security information and event management (SIEM) system that would cross-correlate events to detect an attack. However, the ratio of security devices to hosts or network devices is very small, and these security devices might not detect every security incident.
More advanced security departments have realized that they can collect information from network devices (routers and switches) that can provide additional contextual information for traffic patterns. Specifically, collecting information about network traffic (source/destination IP address, protocol, and port) through NetFlow can provide relevant data. This data can then be processed with analytics to create a baseline of normal network traffic. If a host starts to transmit data that is irregular from a new application or volume, it could alert InfoSec engineers of a potential security incident so that it can be investigated. This same type of analytics can also be used by NAC to help provide context to the device and identify the type or function of the device as part of the authorization process.
Note
There are significant advances in network visibility systems that provide direct interaction with NAC systems. For example, a threat could be detected on the network visibility system that forwards commands to the NAC system. The NAC system notifies the switch to shut down the switch port that the attacker/infected PC is connected to.
Secure Remote Access
Supporting devices in the lower levels of the OT network can provide complications of their own. If a device fails and requires troubleshooting, it could take hours for an engineer to travel for on-site diagnostics. Often, organizations will ask for remote connectivity to their robots and sensors to improve responsiveness to customer demands and reduce travel costs.
In IT environments, a vendor is provided with VPN credentials to log in to the organization’s network, which then provides the vendor with connectivity to their systems to provide support. While this works well, as those systems are in the enterprise portion of the Purdue model, access to OT devices in the manufacturing/industrial zone need more scrutiny for safety reasons.
How can an organization be assured that the vendor has verified that it is safe to operate a device (like a robot) without causing injury to someone nearby? This question alone reiterates the fact that no traffic from the enterprise level should be allowed direct access to the manufacturing/industrial zone.
The best way is to provide a jump box system in the industrial DMZ. A jump box is a dedicated computer with all of the appropriate tools to manage devices in the OT portion of the network. The vendor then establishes connectivity to the OT network through the jump box in the DMZ. For example, an on-site technician can implement all the proper physical safety controls and then launch a screen share session on the jump box.
Note
Remote access via dial-up modem, LTE router, or other VPN device that is placed in the OT network could represent a threat. Some vendors will place these devices as part of their design, unbeknown to the customer, as a backdoor. In some countries, this is an illegal activity for certain industries like utility companies.
Summary
The Internet of Things has grown drastically over the past years. Businesses are now realizing the value that can be extracted from sensors when combined with real-time analytics. These technologies are allowing them to digitize their business model and reinvent themselves by inserting technology into markets that reside outside of the tech industry. These technologies provide them with a differentiator, thus allowing them to be more efficient and profitable.
Enterprise networks are managed by IT network engineers, whereas OT networks have been managed by non-IT engineers. A company is more successful with its IoT deployment when it can have the IT and OT networks communicate and exchange information.
The design of an IoT network must accommodate the following items:
Things: What type of thing is being used, how much data is being sent, how frequently is the data being sent, and how many things are deployed in an area?
Communications: What network medium is being selected, is a gateway being used, what does the backhaul network look like, what network protocol is being used, and which protocol is being used to exchange information between devices?
Computation models: Are the things capable of edge processing, or can we use fog-based processing to reduce latency and bandwidth requirements on the network?
Security: How can we ensure secure communication between the devices, and how can the number of threat vectors be reduced?
The widespread adoption of IoT devices has begun. Some companies have migrated their product portfolio to IoT devices because of the future growth. Analysts predict that there will be 50 billion devices that produce over 3.3 zettabytes (that is, 3,300,000,000,000,000,000,000 bytes) of traffic in the near future (2021).
Review Questions
1. Where is the preferred location for the processing of IoT data?
Edge nodes
Fog nodes
Data centers
Mainframe computers
Cloud service providers
2. A fog node can process data and send the data to another fog node. True or False?
True
False
3. IoT networks are easier to secure than traditional IT networks. True or False?
True
False
4. When defining an IoT security model, which factor is the most important to consider?
Cost of solution
Availability
Complexity
Integrity
Confidentiality
None of the above
5. What is one significant factor that must be taken into consideration with an OT network as compared to an IT network?
Data confidentiality
Safety
Data integrity
OT protocol capability for encryption
Remote access for vendors
References
Hanes, David, Gonzalo Salgueiro, Patrick Grossetete, Rob Barton, Jerome Henry. IoT Fundamentals. Indianapolis: Cisco Press, 2017. Print
Philippe Roggeband. “Architecting Security for the Internet of Things” (presented at Cisco Live, Barcelona, 2018).
JP Vasseur. “The Internet of Things: An Architectural Foundation and Its Protocols” (presented at Cisco Live, Milan, 2014).
Robert Albach, Sr. “Industrial Security: IT vs. OT Deployment Practices” (presented at Cisco Live, Las Vegas, 2017).
Marc Breissinger. “Understanding and Troubleshooting Edge and Fog Fabric Solution” (presented at Cisco Live, Barcelona, 2018).
Samer Salam. “The Evolution from Machine-Machine (M2M) to the Internet of Everything: Technologies and Standards” (presented at Cisco Live, San Diego, 2015).
The Zettabyte Era: Trends and Analysis. 2017. https://www.cisco.com/c/en/us/solutions/collateral/service-provider/visual-networking-index-vni/vni-hyperconnectivity-wp.html. June 7, 2017.