
2

Capital’s Vanishing Act
Investment is one of the most important activities in the economy. But over the past thirty years, the nature of investment has changed. This chapter describes the nature of that change and considers its causes. In chapter 3, we look at how this change in investment can be measured. In chapter 4, we explore the unusual economic properties of these new types of investment, and why they might be important.
Investment is central to the functioning of any economy. The process of committing time, resources, and money so that we can produce useful things in the future is, from an economic point of view, a defining part of what businesses, governments, and individuals do.
The starting point of this book is an observation: Over the last few decades, the nature of investment has been gradually but significantly changing.
The change isn’t primarily about information technology. The new investment does not take the form of robots, computers, or silicon chips, although, as we will see, they all play supporting roles in the story. The type of investment that has risen inexorably is intangible: investment in ideas, in knowledge, in aesthetic content, in software, in brands, in networks and relationships.
This chapter describes this change and why it has happened.
A Trip to the Gym
Our story begins in the gym, or rather in two gyms. We’re going to step inside a commercial gym in 2017 and in 1977 and look at some of the differences. As we will see, gyms provide a vivid but typical example of how even industries that are not obviously high-tech have subtly changed the types of investment they make.
Gyms are an interesting place to begin our search for the intangible economy because at first glance there’s nothing much intangible about them. Even if you avoid gyms like the plague, you probably have an idea of the sort of things you would find there. Our gym in 2017 is full of equipment that the business needs to run: a reception desk with a computer and maybe a turnstile, exercise machines, some weights, shower fittings, lockers, mats, and mirrors (“the most heavily used equipment in the gym,” as one gym owner joked). All this kit is reflected in the finances of businesses that own and run gyms: their accounts typically contain lots of assets that you can touch and see, from the premises they operate in to the treadmills and barbells their customers use.
Now, consider a gym from forty years ago. By 1977 the United States was full of gyms. Arnold Schwarzenegger’s breakout movie Pumping Iron had just been released, featuring scenes of him training in Gold’s Gym in Venice Beach, Los Angeles, which had been established in 1965 and was widely franchised across America. Other gyms contained machines like the Nautilus, the original fixed-weight machine, invented by Arthur Jones in the late 1960s. If you were to look around a gym of the time, you might be surprised to see many similarities to today’s gym. Granted, there might be fewer weight machines and they would be less advanced. Membership would be recorded on index cards rather than on a computer; perhaps the physical fittings would be more rough-and-ready, but otherwise many of the business’s visible assets would look the same: some workout rooms, some changing rooms, some equipment.
But if we return to our 2017 gym and look more closely, we’ll notice a few differences. It turns out that the modern gym has invested in a range of things that its 1977 counterpart hasn’t. There is the software behind the computer on the front desk, recording memberships, booking classes, and scheduling the staff roster, linked to a central database. The gym has a brand, which has been built up through advertising campaigns whose sophistication and expense dwarf those of gyms in the 1970s. There’s an operations handbook, telling the staff how to do various tasks from inducting new members to dealing with delinquent customers. Staff members are trained to follow the handbook and are doing things with a routinized efficiency that would seem strange in the easygoing world of Pumping Iron. All these things—software, brands, processes, and training—are all a bit like the weight machines or the turnstile or the building the gym sits in, in that they cost money in the short run, but over time help the gym function and make money. But unlike the physical features, most of these things can’t be touched—certainly no risk of dropping them on your foot. Gym businesses are still quite heavy users of assets that are physical (all of the UK’s four biggest gyms are owned by private equity firms, which tend to like asset-intensive businesses), but compared to their counterparts of four decades ago, they have far more assets that you cannot touch.
And the transformation goes deeper than this. In one of its rooms, the gym puts on regular exercise classes for its members; one of the most popular is called Bodypump, or, as the sign on the door significantly puts it “Bodypump®.” It turns out the company that runs the gym is not the only business operating in the premises—and this second business is even more interesting from an economic point of view.
Bodypump is a type of exercise called “high-intensity interval training” (HIIT), where participants move about vigorously and lift small weights in time to music, but this description does not do justice to the intensity of the workouts or the adrenaline-induced devotion that well-run HIIT classes engender in their customers. The reason for the registered trademark sign is that Bodypump is designed and owned by the other company at work in the building, a business from New Zealand called Les Mills International.
Les Mills was an Olympic weightlifter who set up a small gym in Auckland three years after Joe Gold opened his first gym in Los Angeles. His son Philip, after a visit to LA, saw the potential for merging music with group exercise: he brought it back to New Zealand and added weights to the routines to produce Bodypump in 1997. He realized that by writing up the routines and synchronizing them with compilations of up-to-date, high-energy music, he had a product that could be sold to other gyms. By 2005 Les Mills classes like Bodypump and Bodycombat were being offered in some 10,000 venues in 55 countries with an estimated 4 million participants a week (Parviainen 2011); the company’s website now estimates 6 million participants per week. Les Mills’s designers create new choreography for their programs every three months. They film them and dispatch the film with guidance on the choreography notes and the music files to their licensed instructors. At the time of writing, they have 130,000 such instructors. To become an instructor, you have to complete three days of training, currently costing around £300, after which you can start teaching, but to proceed further you have to submit a video of a complete class to Les Mills, which checks your technique, choreography, and coaching.
The things that a business like Les Mills uses to make money look very different from the barbells and mats of a 1977 Gold’s Gym. True, some of their assets are physical—recording equipment, computers, offices—but most of them are not. They have a set of very valuable brands (gym customers have been known to mutiny if their gym stops offering Bodypump), intellectual property (IP) protected by copyrights and trademarks, expertise on designing exercise classes, and proprietary relationships with a set of suppliers and partners (such as music distributors and trainers). The idea of making money from ideas about how to work out is not new—Charles Atlas was selling bodybuilding courses a decade before Les Mills was born—but the scale on which Les Mills International operates, and the way it combines brands, music, course design, and training is remarkable.
Our excursion into the world of gyms suggests that even a very physical business—literally, the business of physiques—has in the last few decades become a lot more dependent on things that are immaterial. This is not a story of Internet-driven disruption of the kind we are familiar with from a hundred news stories: gyms were not replaced with an app the way record shops were replaced by Napster, iTunes, and Spotify. Software does not replace the need to lift weights. But the business has nevertheless changed in two different ways. The part that looks superficially similar to how it did in the 1970s—the gym itself—has become shot through with systems, processes, relationships, and software. This is not so much innovation, but innervation—the process of a body part being supplied with nerves, making it sensate, orderly, and controllable. And new businesses have been set up that rely almost entirely for their success on things you cannot touch.
In the rest of this chapter, we will look at how the changes in investment and in assets that took place in the gym industry can be seen throughout the economy, and the reasons for these changes. But first, let us look more rigorously at what investment actually is.
What Are Investment, Assets, and Capital?
When we looked at the things that gyms bought or developed to run and make money, we were talking about assets and investments. Investment is very important to economists because it builds up what they call the “capital stock” of the economy: the tools and equipment that workers use to produce the goods and services that together make up economic output.
But “investment,” “assets,” and “capital” can be confusing terms. Take “investment.” Financial journalists typically refer to people who buy and sell securities as “investors,” and nervously diagnose the “mood of investors.” The same journalist might call a long-term financier like Warren Buffett an “investor” and his short-term rivals “speculators.” Someone considering going to college might be advised that “education is the best investment you can make.”
The terms “assets” and “capital” are also used in a confusing variety of ways. In his justly famous Capital in the Twenty-First Century, Thomas Piketty (2014) defined capital as “all forms of wealth that individuals . . . can own.” Marxist writers commonly ascribe to “capital” not just an accounting definition, but an entire exploitative system. “Assets” also have different definitions. Many firms think of their business assets as their stock of plant and equipment. For an accountant, business assets commonly include the cash in the firm’s bank account and bills its customers have yet to pay, which don’t seem to be machines used in the business production but rather the results of doing that business.
Because of these multiple meanings, and because we’ll be coming back to these terms frequently, it will be helpful to establish working definitions for investment, capital, and assets. We will stick to the internationally agreed definition of investment used by statistics agencies the world over when they measure the performance of national economies. This has the benefit of being standardized and the fruit of much thought, and of being directly linked to figures like GDP that we are used to seeing in news bulletins.
According to the UN’s System of National Accounts, the bible of national accounting, “investment is what happens when a producer either acquires a fixed asset or spends resources (money, effort, raw materials) to improve it.”1 This is a quite dense statement, so let’s unpack what it means.
First of all, let’s look at the definition of assets. An asset is an economic resource that is expected to provide a benefit over a period of time.2 If a bank buys a new server or a new office building, it expects to get a benefit that lasts for some time—certainly longer than just a year. If it pays its electricity bill quarterly, the benefit lasts for three months. So the server and the building are assets, but neither the electricity nor the fact of having paid the bill is.
Second, consider the word fixed. A fixed asset is an asset that results from using up resources in the process of its production. A plane or a car or a drug patent all have to be produced—someone has to do work to create something from nothing. This can be distinguished from a financial asset, like an equity stake in a public company. An equity stake is not produced (except in the trivial sense that a share certificate might be printed to represent the claim). This means that when economists talk about investment they are not talking about investing in the personal finance sense, that is, buying stocks and shares. And because they are talking about fixed assets they are not talking about the accountancy concept of cash in a company bank account.
Third, there is the idea of spending resources. To be deemed an investment, the business doing the investing has to either acquire the asset from somewhere else or incur some cost to produce it themselves.
Finally, there is the word producers. National accounts measure production by firms or government or the third sector. Production by households (say, doing the laundry or cooking at home) is not included, and so neither is investment by a household, say, in a washing machine or stove. This is a definitional feature of the way national accounts are calculated, and it is one of the reasons people criticize GDP (not least because it is large, and because it excludes from the record a part of the economy that has historically been run primarily by women). Perhaps one day “production” will have a broader definition in national accounts; for our purposes, most of the changes we describe in this book would, we believe, apply to the household sector as well as to so-called producers.
So, in this book when we talk about “investment” we are not talking about the buying or selling of pieces of paper on a stock market or households paying university tuition. Rather, we are talking about spending by business, government, or the third sector that creates a fixed (i.e., nonfinancial) asset, that is, resources spent that create a long-lived stream of productive services. We shall call such a fixed asset providing these long-lived productive services “capital.” Because both capital and labor produce such productive services, economists refer to them as “factors of production.”3
Not All Investments Are Things You Can Touch
One of the examples of an investment in the section above was a drug patent, say, one owned by a pharmaceutical company. The pharmaceutical company is obviously a producer, not a household; the company has to expend resources to produce the patent or acquire it; the patent arises from a process of production—in this case, the work of scientists in a lab—and if the patent is any good, it will have a long-term value, since the company can develop it for future use and perhaps sell medicines based on it. The patent is an example of an intangible asset, created by a process of intangible investment. So too were the various assets in the gym story, from the gym’s membership software to Les Mills International’s Bodypump brand. They arose from a process of production, were acquired or improved by producers, and provide a benefit over time.
These kinds of investments can be found throughout the economy. Suppose a solar panel manufacturer researches and discovers a cheaper process for making photovoltaic cells: it is incurring expense in the present to generate knowledge it expects to benefit from in the future. Or consider a streaming music start-up that spends months designing and negotiating deals with record labels to allow it to use songs the record labels own—again, short-term expenditure to create longer-term gain. Or imagine a training company pays for the long-term rights to run a popular psychometric test: it too is investing.
Some of these investments are new technological ideas. Some are other sorts of ideas that have less to do with high technology: new product designs or new business models. Some take the form of lasting or proprietary relationships, such as a taxi app’s network of drivers. Some are codified information, like a customer loyalty card database. What they have in common is that they are not physical. Hence we call them intangible investment.
Table 2.1 sets out some examples. On the left-hand side are tangible business investments: buildings, ICT equipment like computer hardware, non-ICT equipment, and vehicles. On the right are intangibles: software, databases, design, mineral exploration, R&D, and business processes, for example. These intangibles in the right column are those elements of spending that business and national accountants have been reluctant to count as investment, though, as we shall see, over the last forty years some of them have been included as such.
Source: Adapted from the System of National Accounts (SNA) 2008, para 10.67 and table 10.2, and Corrado, Hulten, and Sichel 2005. The SNA also includes as tangible assets weapons systems and cultivated biological resources. As intangibles it includes R&D, mineral exploration and evaluation, computer software and databases, and creating artistic originals. The other intangible assets are those set out in Corrado, Hulten, and Sichel 2005.
Intangible Investment Has Steadily Grown
The story of how intangible investment expanded in the gym business is not unusual.
Consider another sector that is familiar to most people: supermarket retail. If you found yourself in a self-service supermarket of forty years ago, it would look dated, but not unrecognizable. Supermarkets then were big rooms full of shelves, fridges, and freezers just as they are now; customers put their own goods in a shopping cart and took them to a checkout to pay; behind the scenes, trucks resupplied the supermarket from central warehouses. Of course, aspects of the tangible assets of a supermarket business have changed since then: the stores have changed shape (some are bigger and outside of town, others are much smaller and in city centers), and the checkouts have more silicon chips in them and some of them are self-service. But these changes are minor compared to the changes in supermarkets’ intangible assets. Even in the 1970s bar codes were increasingly being used to keep track of supermarket inventories; as the 1980s and 1990s went on, this gave rise to computerized systems for managing supply chains, significantly increasing the productivity of the sector. Supermarkets began to invest in complex pricing systems; more ambitious branding and marketing campaigns (including launching ranges of own-label products); more detailed processes and systems for staff to follow, backed up by training; and management systems to allow stores and central offices to track performance, balance stock levels, and plan promotions. Alongside this, a host of intangible-intensive businesses have appeared in the sector, ranging from online competitors like FreshDirect and Ocado, which use software to replace stores, to businesses that process information to help supermarkets, such as loyalty data experts DunnHumby and LMUK.
Fast-growing tech companies are some of the most intangible-intensive of firms. This is in part because software and data are intangibles, and the growing power of computers and telecommunications is increasing the scope of things that software can achieve. But the process of “software eating the world,” in venture capitalist Marc Andreessen’s words, is not just about software: it involves other intangibles in abundance. Consider Apple’s designs and its unrivaled supply chain, which has helped it to bring elegant products to market quickly and in sufficient numbers to meet customer demand, or the networks of drivers and hosts that sharing-economy giants like Uber and AirBnB have developed, or Tesla’s manufacturing know-how. Computers and the Internet are important drivers of this change in investment, but the change is long running and predates not only the World Wide Web but even the Internet and the PC.
The rise of intangible investment becomes clear if we look at data for the economy as a whole. For some years, economists have been measuring those aspects of intangible capital not in the national accounts and building increasingly accurate estimates of the amount of intangible investment going on. We will discuss the components of this measurement and how it is undertaken in the next chapter, but figure 2.1 shows the general trend.
Even though the economists of the time were not focused on measuring intangible investment, in recent years scholars have been able to reconstruct how much was invested by businesses in intangible assets decades ago.

In the early years, even in the most developed countries, intangible investment was something of a sideshow. As the graph shows, over time this balance began to shift. Intangible investment steadily increased. Tangible investment, as a proportion of the economy as a whole, grew slower and in some cases decreased. In the United States, it looks as though intangible investment got the better of tangible investment by the mid-1990s.4
Only in the United States can we go back this far, but for the UK, we have some estimates by Peter Goodridge and his colleagues back to 1992 (Goodridge et al. 2016). They find that intangible investment overtook tangible investment by around the late 1990s (see figure 2.2).
A series of recent EU-funded projects have tried to gather this data consistently across EU countries.5 The data for the major European economies is set out in figure 2.3 and shows that while intangibles are growing, they have not yet overtaken intangible investment.
If we put all the countries together, we get figure 2.4, which suggests that intangible investment overtook tangible investment around the time of the global financial crisis.

Breaking down the results by country shows that some countries are more intangible-intensive than others. Figure 2.5 shows for countries with available data the shares of GDP accounted for by tangible and intangible investment. The graph is ranked by the share of intangibles. Starting on the left are Spain and Italy. Both have the lowest levels of intangible investment as a proportion of GDP and relatively high levels of tangibles—they are tangible-intensive economies. Germany, Austria, Denmark, the Netherlands, and France are next, with low-to-moderate intangible intensity and high-to-moderate tangible intensity; all of them invest more in tangibles than in intangibles. Finland, the UK, the United States, and Sweden all have higher intangible than tangible investment intensity.

Figure 2.3. Intangible and tangible investment in Europe. Data are EU country whole-economy investment in intangible and tangible assets relative to GDP, including intangible output. Last datapoint is 2013. European countries are Austria, Czech Republic, Denmark, Finland, France, Germany, Italy, Netherlands, Spain, Sweden, UK. Source: authors’ calculations based on INTAN-Invest database (www.intan-invest.net).

Figure 2.4. Intangible and tangible investment in Europe and the United States. Countries are Austria, Czech Republic, Denmark, Finland, France, Germany, Italy, Netherlands, Spain, Sweden, UK, USA. Source: authors’ calculations based on INTAN-Invest database (www.intan-invest.net).
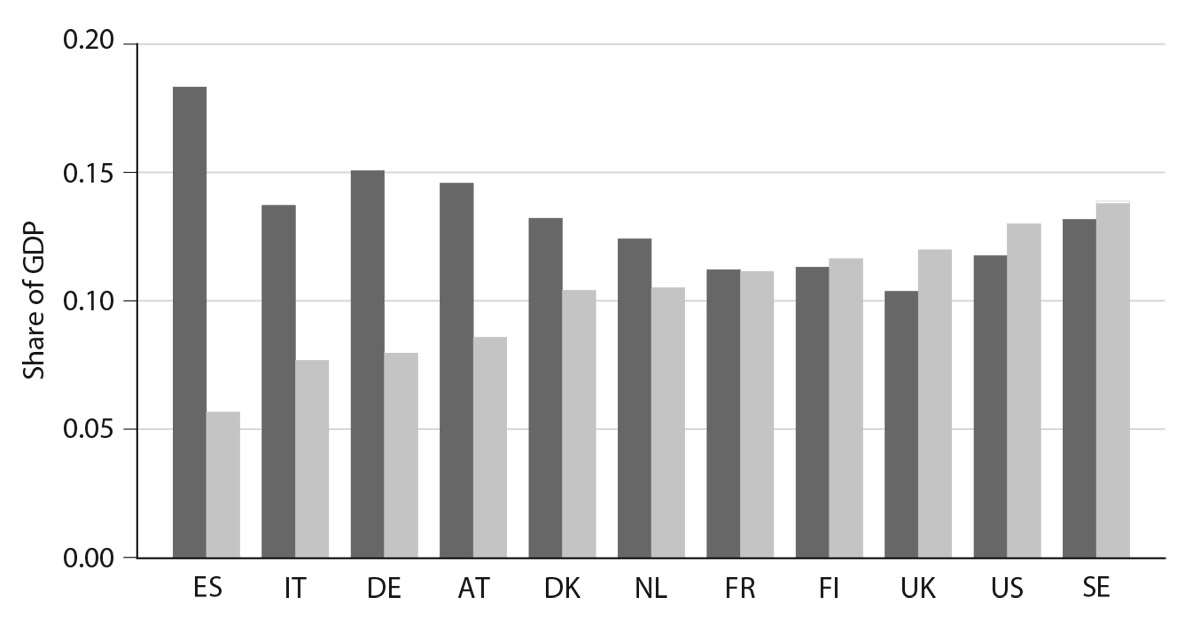
Figure 2.5. Intangible and tangible investment as shares of country GDP (averages, 1999–2013). Data are whole economy, GDP adjusted to include intangibles. Countries are Austria (AT), Denmark (DK), Finland (FI), France (FR), Germany (DE), Italy (IT), Netherlands (NL), Spain (ES), Sweden (SE), UK (UK), USA (US). Source: authors’ calculations based on INTAN-Invest database (www.intan-invest.net).
These differences across countries seem to line up with intuition. Broadly, the Mediterranean countries are at the bottom of the intangible investment pack, with the Nordics, the United States, and UK at the top and the rest of Continental Europe in the middle.
These charts are the result of over a decade of research to codify and measure intangibles. In the next chapter, we’ll look at this research and at how these measurements are carried out. But before we do, it is worth giving some thought to the reasons for this long-term increase in intangible investment.
Reasons for the Growth of Intangible Investment
It is not the main aim of this book to explain why intangible investment has undergone such a steady and long-lasting increase: we are more concerned with describing the rise and its consequences for the wider economy. But before we move on to look in detail at how intangible investment has been measured, let us consider some of the likely reasons.
To understand the causes of this remarkable change, we will go back to some of the differences across countries that were hinted at in the earlier figures.
Technology and Cost
It has long been understood that the productivity of the manufacturing sector generally increases faster than that of the services industries, since automation and labor-saving equipment tend to be more useful for manufacturers. Over time, this means that labor-intensive services become more expensive relative to manufactured goods. (In honor of William Baumol’s description of this effect, economists call it Baumol’s Cost Disease.)
Now, most tangible investments are manufactured (think of the many factories around the world that churn out everything from vans to machine tools to silicon chips). There is certainly a lot of labor involved in tangible investments (laying cables, shop fitting, the whole construction industry), but manufacturing matters too.
Intangible investments, on the other hand, depend much more on labor. Design involves paying designers. R&D involves paying scientists. Software involves paying developers. So over time, we would expect intangible investment spending to gradually rise relative to tangible as Baumol predicted. Some of that rise might be offset by the point, which we look at in detail below, that some intangibles costs are mostly “fixed” or one-off, so this cannot be the whole story, but it is likely to be at least one element of it.
Technology and Productivity of Intangibles
New technology also seems to be increasing the opportunities for businesses to invest productively in intangibles. The most obvious example is IT. Because many intangibles involve information and communication, they can almost by definition be made more efficient with better IT. Think of Uber’s organizational investment in building its vast networks of drivers: it would have been theoretically possible before the invention of computers and smartphones (after all, radio cab networks existed), but the return on the investment was massively increased by smartphones, with their ability to connect people quickly and enable the rating of drivers and the metering of rides.
Social technologies have also improved the return on intangible investment. The concept of the corporate R&D lab in nineteenth-century Germany, and its development in both Germany and the United States (intangible investments in the process of producing intangible investments), made commercial R&D more systematic and more worthwhile. The invention and development of systems, such as Kanban, the lean manufacturing technique associated with Toyota, increase the return on organizational investment. Code repositories like GitHub and Stack Overflow and the way they are used are a type of social technology—one that increases the return on software investments by helping programmers collaborate.
Country-by-country data on intangible investment gives us a hint of this. Figure 2.6 shows some correlation between the share of intangible investment in GDP in a country and the share of tangible investment accounted for by IT.
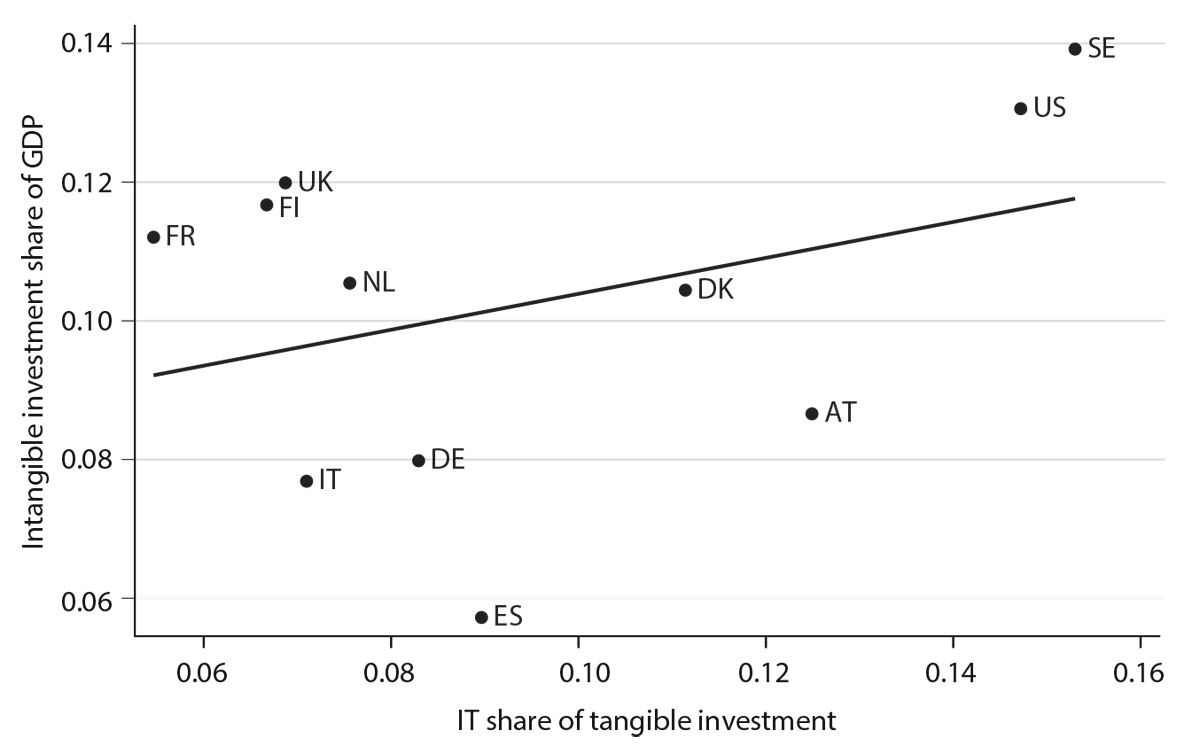
Figure 2.6. Intangible and IT investment (averages, 1999–2013). Countries are Austria (AT), Denmark (DK), Finland (FI), France (FR), Germany (DE), Italy (IT), Netherlands (NL), Spain (ES), Sweden (SE), UK (UK), USA (US). Source: authors’ calculations based on INTAN-Invest database (www.intan-invest.net).
This raises an interesting question: Is it possible that the rise of intangible investment is nothing more than a consequence of improvements in IT? Is the intangible economy a sort of corollary of Moore’s Law or an epiphenomenon of what Erik Brynjolfsson and Andrew McAfee call the Second Machine Age? It is difficult to prove causality in technological change, but there are grounds to think it is a bit more complicated than that. It is certainly true that some intangibles operate through computers—indeed, for one category of intangibles, software, computers are a necessary precondition. And it seems more than likely that the market size for many intangible assets, such as entertainment, has been greatly expanded by IT.
But it seems unlikely that the rise of computers is the only cause of the intangible economy. First of all, as we saw earlier, the rise of intangible investment began before the semiconductor revolution, in the 1940s and 1950s and perhaps before. Second, while some intangibles like software and data strongly rely on computers, others do not: brands, organizational development, and training, for example. Finally, a number of writers in the innovation studies literature argue that it may be that it was the rise of intangibles that led to the development of modern IT as much as the other way around. The historian James Beniger (1986) argued that modern information technology developed as it did because of an overwhelming need to control production and operations, first on the part of the military, and then in the world of business—by this logic, IT and the research that led to it was shaped by an economy hungry for intangible investment rather than intangible investment happening as a response to the serendipitous invention of various forms of IT.6
Industrial Structure
One plausible explanation for the rise in intangible investment is that the balance of what businesses produce has changed. Everyone knows that the output of developed countries, even ones with large manufacturing sectors like Germany or Japan, consists mostly of services. Some of the sociologists and futurists who first heralded the rise of “post-industrial society” were also prophets of what became known as the knowledge economy. Is it true, then, that the modern world is replacing dark satanic mills with service businesses that invest in systems, information, and ideas?
It turns out the evidence is not so clear-cut. Figure 2.7 shows that, in all our countries, the service sector was, in the late 1990s, more tangible-intensive, but this has reversed. Remarkably, the manufacturing sector is more intangible-intensive than tangible-intensive and has grown more so. So, the structure of the economy will affect the relative importance of intangibles, but that effect will change over time. The data for manufacturing should not come as a surprise, since it is likely in part due to globalization. When trade opens up with developing countries, as when China joined the WTO in 2000, developed countries have to further specialize where they have a comparative advantage. The manufacturing businesses that tend to thrive in high-wage economies are ones that invest a lot in intangibles, from the R&D programs of Pfizer or Rolls-Royce to the lean production techniques of the Japanese motor industry. (To the extent that globalization requires the construction of more complex organizations and networks, it could also drive increased intangible investment directly.)
A Changing Business Climate

Figure 2.7. Intangible intensity in manufacturing and services (real shares of real sector value added, EU and US, non-farm business). Source: authors’ calculations from INTAN-Invest (www.intan-invest.net) and SPINTAN (www.spintan.net) databases.
The years since 1980 have seen a steady relaxation of a whole range of regulations on both products and labor markets in most of the world’s biggest economies. At the same time, most governments on both the right and the left have prided themselves on a degree of business-friendliness that would have surprised politicians of the 1960s or 1970s. Might this have encouraged a long-term rise in intangible investment?
Turning back to the comparison of intangibles across countries, we see some evidence that looser regulation of product markets and labor markets encourages intangible investment. Figure 2.8 shows the share of business-sector GDP accounted for by tangible and intangible investment, plotted against an index of what the OECD calls “employment strictness,” where a high value of the index, such as in countries like Italy, means that it is costly to hire and fire workers and a low value, for example, in the United States and the UK, means that it’s relatively cheap.
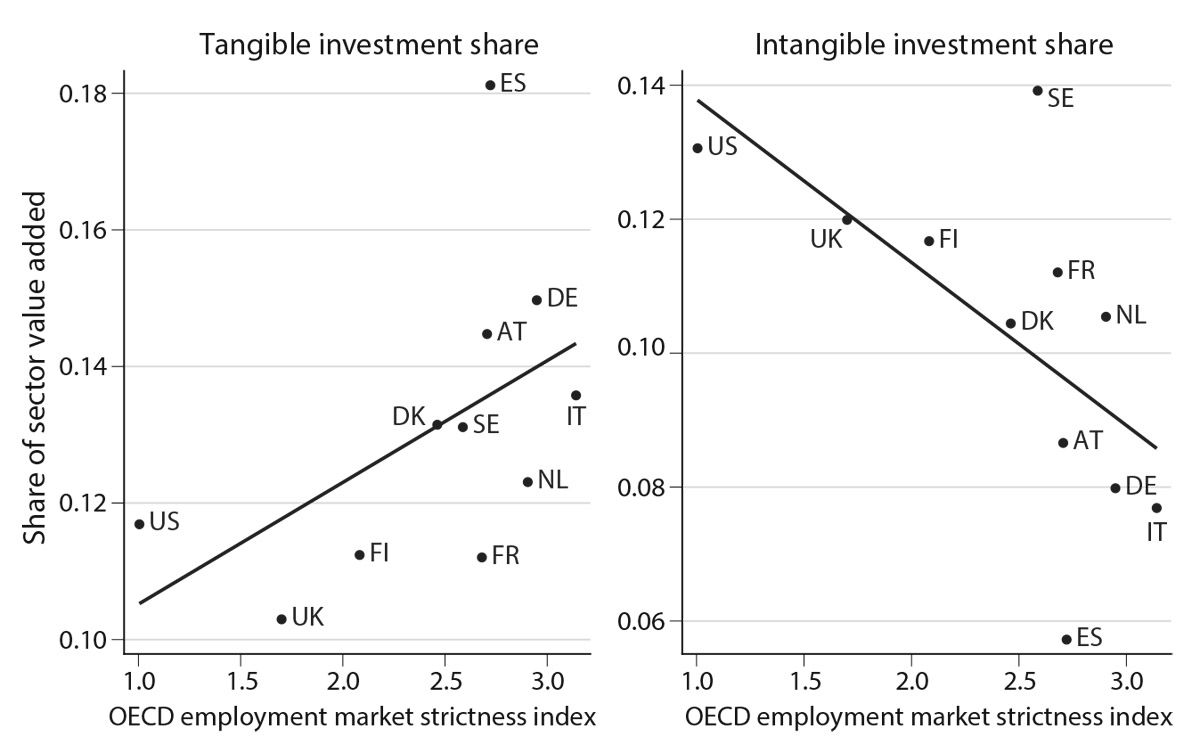
Figure 2.8. Tangible and intangible investment and regulation (shares of sector value added, average 1999–2013). Countries are Austria (AT), Denmark (DK), Finland (FI), France (FR), Germany (DE), Italy (IT), Netherlands (NL), Spain (ES), Sweden (SE), UK (UK), USA (US). Source: authors’ calculations based on INTAN-Invest database (www.intan-invest.net) and OECD data.
The figure shows something interesting. Countries with more restrictive hiring and firing invest more in tangibles, but less in intangibles. The effect of labor market rules on tangible effect is intuitive: if hiring and managing staff is a real pain, then businesses may invest in machines instead. But the effect on intangible investment is the opposite. Why? New intangibles often require workers to change the way they work: imagine a factory implementing a lean process—a type of organizational development investment—or changing the nature of its products. New intangibles might also be risky and entrepreneurs might reasonably forecast a high possibility of failure in the future. Less flexible workforces might deter such investment in the first place.7
This is not intended to be a blithe endorsement for undermining workers’ rights. But it does provide a further possible explanation for the continued difference in investment in the last few decades, and a reminder that politics is not irrelevant to these changes.

Figure 2.9. Intangible investment and government R&D spending (averages, 1999–2013). Countries are Austria (AT), Denmark (DK), Finland (FI), France (FR), Germany (DE), Italy (IT), Netherlands (NL), Spain (ES), Sweden (SE), UK (UK), USA (US). Source: authors’ calculations based on INTAN-Invest database (www.intan-invest.net) and OECD data.
Figure 2.9 shows there is a correlation between intangible spending, this time by the market sector, and R&D spending by the government. So countries like Finland and Sweden, for example, have very high government R&D spending and high market sector intangible spending, in contrast with Spain and Italy. Thus intangible investment can vary by country depending on the extent of public sector coinvestment.
Finally, it also seems that intangible investment is higher as a fraction of GDP in more developed countries. Corrado and Hao (2013), for example, document this for spending on brands, which is around 1 percent of GDP per capita in the United States but 0.1 percent for China (for their data, 1988–2011), and it is well known that most R&D is accounted for by a small fraction of developed countries (see, e.g., the data in van Ark et al. 2009). This might be due to low-income countries specializing in labor-intensive manufacturing or not having the financial and science base to make large-scale intangible investments.
Globalization and Growing Market Sizes
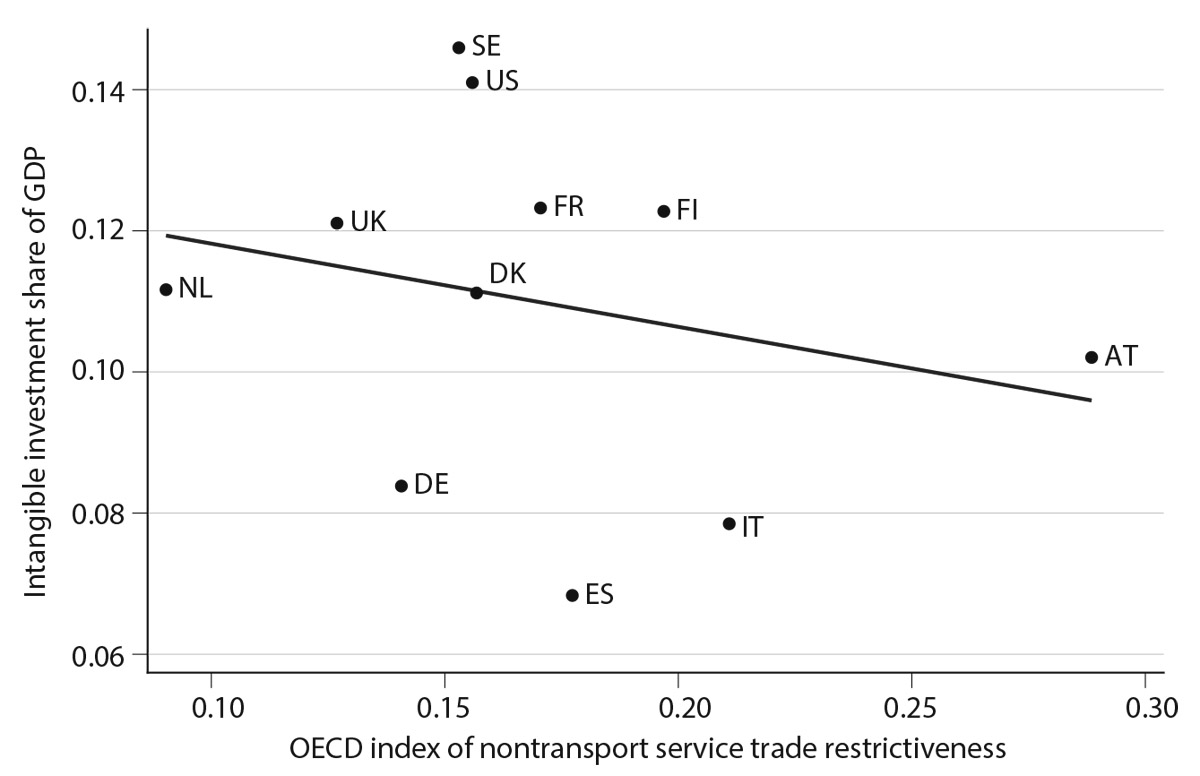
Figure 2.10. Intangible investment and trade restrictiveness, 2013. Countries are Austria (AT), Denmark (DK), Finland (FI), France (FR), Germany (DE), Italy (IT), Netherlands (NL), Spain (ES), Sweden (SE), UK (UK), USA (US). Source: authors’ calculations based on INTAN-Invest database (www.intan-invest.net) and OECD data.
A final determinant is the size of the market. Many intangibles, such as Starbucks’s brand or Facebook’s software, can be scaled more or less infinitely (a point we shall return to in chapter 4). So, smaller markets (for example, countries surrounded by trade barriers) would be less attractive places to make intangible investment.
Figure 2.10 shows the share of GDP accounted for by intangible investment plotted against the OECD index of restrictiveness of trade in services (countries on the right of the graph have more restrictive trade in their services). This helps explain some of the spread in country investment patterns that we see: Austria, for example, hardly a basket case economy, spends relatively little on intangible investment but has quite restrictive trade opportunities, limiting, therefore, the possibility of scale.
The steady increase of international trade over the past fifty years would, therefore, provide a greater incentive for companies with exposure to it to invest in intangibles. And this means that if trade barriers rise, via either Brexit or trade policy, there will be lower incentive for intangible investment.
Conclusion: Capital’s Vanishing Act
Intangible investment has become increasingly important. New methods of measurement show how it now exceeds tangible investment in some developed countries and has been growing for several decades, while tangible investment has steadily declined. There are a number of reasons for the growth of intangible investment, including the changing balance of services and manufacturing in the economy, globalization, the increased liberalization of markets, developments in IT and management technologies, and the changing input costs of services (which play a greater role in intangible investment). In the next chapter, we will look in more depth at how to measure intangible investment in the economy.