
3
BUILD YOUR STRATEGIC HIGH GROUND
Several years ago, we worked with one of the nation’s largest, most successful telephone companies in the early days of regulatory change, when new competitors were first entering the market.
We had the privilege of working with the executive vice president (EVP) of this telephone company, helping guide the company’s transformation into its new world of competition. We had earlier worked with the prior EVP, who had just retired.
The prior EVP was legendary in the industry. Every morning, when he arrived, he had on his desk a “trouble report” showing outages throughout the system. If the responsible lower-level manager did not clear the trouble in two hours, a report was escalated to the regional vice president, and if the trouble was not cleared in four to eight hours, it wound up on the EVP’s desk.
First thing in the morning, at 5:00 a.m., the EVP would call the responsible manager. No one ever wanted to take that call. Then the EVP personally would call the customer to apologize. That is how the company was run.
Think about how the EVP defined his job. Certainly, it was very important for a telephone company, especially in the very early days of wireless and private networks, to be extremely reliable, but a lot was happening in the background that was pushed aside. This telephone company had in its territory one of the largest, most important cities in the country.
At this time, a competitor, a large capable construction company, had targeted the downtown area of the city and was laying optical fiber spines along all the main streets—which were lined by skyscrapers full of the company’s Profit Peak customers. The competitor hired a number of young sales reps who went door to door along each main street and avenue selling the new service, and they were steadily capturing the telephone company’s most lucrative customers.
Meanwhile, the prior EVP was managing the telephone company as if it were a monopoly—replacing the oldest assets first and marketing to increase sales equally in all areas, regardless of whether an area was a highly competitive urban business district or a rural region. The result: profits dropped through the floor. In essence, this was Mass Markets Age management confronting an emerging Age of Diverse Markets business environment.
MANAGING THE TELECOMMUNICATIONS REVOLUTION
The prior EVP retired, and a new EVP was named. The new EVP saw that managing the telephone company in the old monopolistic, mass market way was leading to the loss of the company’s best customers.
In response, he reorganized the company by dividing it into five regional units: two focused on the company’s major cities, two focused on the rings of suburbs that surrounded these major cities, and the remaining unit focused on the company’s rural and semi-rural regions. He divided the company’s organization into multifunctional business teams (each had marketing, sales, engineering, operations, and finance capabilities), with each team managing a region. His logic was that the regions were becoming very different from one another, so they needed to be managed in disparate ways.
The EVP charged each regional management team with dividing its region into a set of about 20 smaller geographically defined “business blocks,” such as a particular downtown business area, a busy suburb, or a specific rural area. He created a planning process in which each regional team analyzed each of its business blocks using transaction-based profit metrics and analytics. A planning team in each region first determined the profitability of every component of each business block and then estimated the likely competitor inroads, along with the telephone company’s potential marketing initiatives (competitors would avoid areas in which the company was investing heavily on marketing).
The planning team projected the expenditures and profits for several scenarios for each business block, then selected the set of plans that would produce the best short-term and long-term results, along with a transition plan to guide their market development efforts. The company’s CFO gathered these plans from the regions, compared the results to the company’s needs, and suggested revisions where needed. This decentralized process became the company’s primary financial planning and analysis process.
THREE IMPERATIVES
The telephone company’s new process embodied the three imperatives we highlighted in Chapter 1: choosing the target customers, aligning the company’s capabilities to capture and manage these customers, and managing through a decentralized organization featuring multifunctional teams, each focused on a unique set of customer needs. Transaction-based profit metrics and analytics were central to this process. This is emblematic of successful companies in the Age of Diverse Markets.
The EVP wisely aligned the company’s organization with its geographic regions because the company’s assets were primarily regional, competitors were entering the market regionally, and the regions were very different from one another. Other companies, however, might divide their organizations to align with customer market segments (for example, machine shops versus trucking companies) or product categories (for example, equipment versus consumables), or network effects, which combine both.
We call each major grouping, like the telephone company’s regions, a profit river, and we call each focused grouping within a profit river, like a business block, a profit stream. As markets become fragmented at an accelerating pace, having a clear understanding of a company’s profit rivers and profit streams, and aligning its organization and management processes with them, is a critical success factor.
THE CASE OF ADRIAN ENTERPRISES
Adrian Enterprises, a disguised actual company, sells process control equipment. It had a problem: its revenues were rising, but its profits were falling. The company appointed a team to figure out why this was happening and how to rectify it.
The company had two main customer groups: university laboratories and suppliers to semiconductor fabrication plants (fabs). The sales reps strongly favored the university laboratories over the semiconductor fab suppliers because the laboratories had much higher gross margins.
Using transaction-based profit metrics and analytics, the team looked carefully at the company’s customer profitability landscape. When they created separate profit stacks for the semiconductor fab suppliers and the university laboratories, the team was surprised to see that the company was making a huge amount of money on the fab suppliers and was losing its shirt on the university laboratories.
When they investigated why this was happening, they saw that the semiconductor fab suppliers had very low selling and customer support costs because they negotiated annual blanket contracts; had low shipping costs due to stable, predictable order patterns; had no returns; and had no need for ancillary services like engineering or technical support.
The university laboratories, on the other hand, were extremely costly to serve. Nearly every order was for a unique experiment—and every experiment required significant sales and engineering time. In addition, this segment generated many returns and unpredictable orders.
The answer was to define each of these customer segments as a profit river (and particular types of fab suppliers and university laboratories as profit streams) and to create a closely aligned, high-impact sales and support capability for each.
They decided to devote a lot more sales resources to obtaining the low gross margin, high net profit semiconductor fab business. Then they had an inspired thought: hire and train a set of graduate students in each major university to be “product representatives” who could help the researchers identify the right equipment, pay them $10 to $15 per hour, and let them serve free pizza to the researchers.
The fab supplier business skyrocketed, the laboratory business became much more profitable, and the company’s net profits went through the roof.
Again, the three imperatives were the keys to success: choosing the right customers, aligning the functions to meet the specific characteristics and needs of each profit river (customer segment), and managing the organization to meet each profit river’s disparate needs. Again, transaction- based profit metrics and analytics were essential to the success of the process.
FOUR STEPS TO BUILD YOUR STRATEGIC HIGH GROUND
For this approach to succeed, you need to see your business’s profit landscape— the detailed set of profits and losses that total your overall profitability. Transaction-based profit metrics show you the all-in net profit of every segment of your company and provide the foundation for a powerful set of processes that enable you to choose your customer, align your functions, and manage your organization.
In order to build your strategic high ground, four cornerstone business processes are especially important:
Choose Your Customer
1. Strategic positioning and risk management: Profit maps and profit contours, which we will discuss shortly, enable managers to evaluate and reshape their companies’ competitive positioning and risk profile as the currents of change transform their respective industries.
Align Your Functions
2. Profit river management: Profit rivers are a company’s prime sources of profit or loss. Typically, they have three characteristics: (1) each is important, (2) each is relatively homogeneous and somewhat different from the others, and (3) each has a natural cross-functional management constituency.
3. Transition initiative management: These initiatives are essential in repositioning a company for increased profitability and success in its transforming industry.
Manage Your Organization
4. Profit-driven process management: Transaction-based profit information is critical to maximize the performance of a company’s core set of business processes essential for managing customer, product, and supply chain activities.
Together, these enable managers to maximize their companies’ performance in the near term, in the long term, and in the transition period in between.
Strategic Positioning and Risk Management
Profit contours are essential for managing strategic positioning and risk. A profit contour shows the joint profitability of two intersecting dimensions of a company, like customers and products, or stores and product categories.*
Figure 3.1 shows the profit breakdown of a disguised distribution company that we will call Kimberly Products. The three customer segments (Profit Peaks, Profit Drains, and Profit Deserts) are on the vertical axis, while the three product segments are on the horizontal axis. This company is very profitable overall.
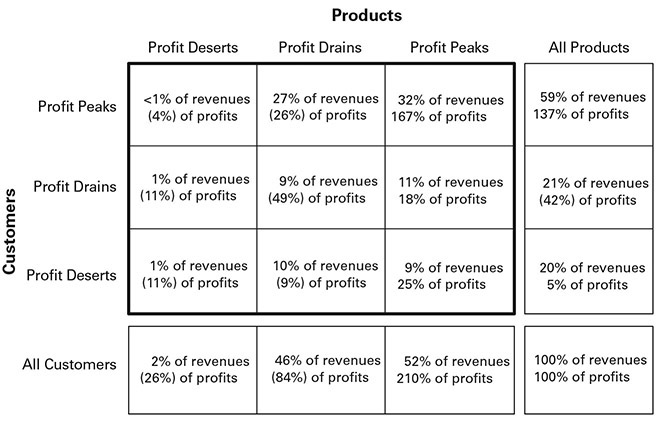
FIGURE 3.1 Three-Segment Profit Contour of Kimberly Products’ Customers Versus Products
This company’s profit contour shows a remarkable concentration of profits and losses. Profit Peak customers buying Profit Peak products generate 32 percent of the company’s revenues, but fully 167 percent of the profits, while Profit Drain customers buying Profit Drain products produce only 9 percent of the revenues but erode 49 percent of the profits.
This profit contour invites a number of important questions—some relating to the current business paradigm and others relating to the transforming industry. In the former, managers can ask what factors in the profit stacks of their Profit Drain customers are causing the huge losses. In the latter, managers can ask whether their current Profit Peak customers are vulnerable to particular currents of change, ranging from additive manufacturing to incursion of B2C companies with network effects that are skilled in omnichannel management. All these questions, and more, are easily answered by transaction-based profit analytics.
Profit contours are extremely important for strategic positioning. Let’s look at the example of another disguised furniture retailer, which we will call Northwest Interiors, with revenues of about $700 million and profits of about $65 million. Figure 3.2 shows this company’s customer and product profit maps.
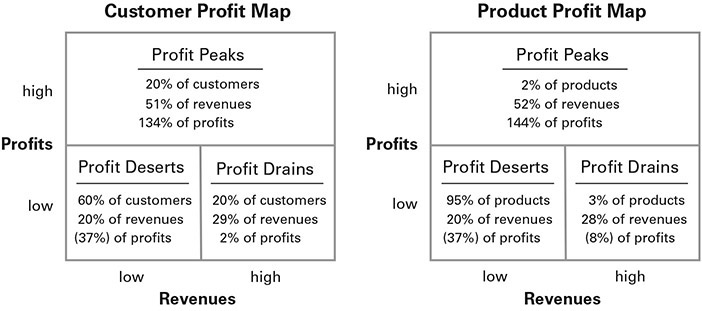
FIGURE 3.2 Northwest Interiors Profit Maps
Here are the customer segments:
• Profit Peak customers: About 20 percent of the customers produce 51 percent of the revenue and 134 percent of the profit.
• Profit Drain customers: About 20 percent of the customers produce 29 percent of the revenue and only 2 percent of the profit.
• Profit Desert customers: About 60 percent of the customers produce 20 percent of the revenue but erode fully 37 percent of the profits.
Here are the product segments:
• Profit Peak products: Only 2 percent of the products produce 52 percent of the revenue and fully 144 percent of the profits.
• Profit Drain products: Only 3 percent of the products produce 28 percent of the revenue and erode 8 percent of the profits.
• Profit Desert products: Fully 95 percent of the products produce 20 percent of the revenue and drain a whopping 37 percent of the profits.
Figure 3.3 shows the distribution of profits by the intersections of Northwest Interiors’ customer segments and product segments.
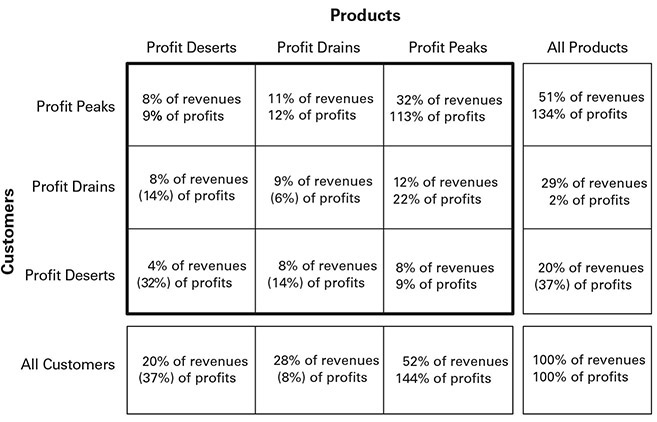
FIGURE 3.3 Three-Segment Profit Contour of Northwest Interiors’ Customers Versus Products
This figure shows the strong concentration of Northwest Interiors’ profits and losses. Profit Peak customers buying Profit Peak products generate 32 percent of the company’s revenues but contribute fully 113 percent of the profits. Surprisingly, Profit Drain customers buying Profit Peak products account for only 12 percent of the revenue but produce 22 percent of the profits.
Interestingly, Profit Drain customers buying Profit Drain products account for only 9 percent of the revenues and erode only 6 percent of the profits. However, Profit Desert customers buying Profit Desert products contribute a minor 4 percent of the revenue but erode fully 32 percent of the profits.
With a relatively quick investigation, the company’s managers determined how to significantly increase and sustain the company’s Profit Peak business and dramatically diminish the Profit Desert losses (which were primarily in returns, delivery fee discounts, and handling costs for low-ticket items like bedding and housewares).
Strategic Positioning
Most strategic analyses are based on an assessment of a company as a whole. This is an artifact of the Age of Mass Markets. So-called strengths-weaknesses- opportunities-threats (SWOT) analysis, and even Michael Porter’s powerful Five Forces framework, illustrate this approach.* Profit contour analysis significantly enriches these analytical models because it shows the composition of a company’s component segments and activities, allowing managers to see their underlying patterns of profitability, which have historically been hidden by aggregate, average metrics.
Companies are not monolithic. For example, profit contour analysis indicates how much a company would be helped by better positioning (for example, which segments are helped, which would suffer profit erosion in the absence of repositioning, and which are well positioned already). It also indicates how difficult, costly, or time-consuming the transition will be (for example, what proportion of the products or vendors have to be changed). This is especially important in addressing the specific problems and opportunities that the currents of change pose.
For example, Chapter 2 explains how an increase in additive manufacturing could have either a minor or huge impact on a company’s profitability, depending on whether the customers who are vulnerable to displacement by additive manufacturers are primarily Profit Peaks. Every current of change has a similar differential impact on particular segments of a company.
Profit contours rooted in transaction-based profit metrics provide fact-based answers to strategic questions like these: Which stores will be most affected by a vendor bankruptcy (as a function of the product mix and substitute preferences of the store’s Profit Peak customers)? Which services will be endangered or helped by new developments in artificial intelligence and machine learning?
Not only do profit contours provide essential information when formulating strategy, but they also enable a company to track its repositioning progress with a remarkable degree of exactitude. Managers can watch the erosion rate of vulnerable Profit Peak customers and products, literally day by day, and they can then focus their resources for initiating their repositioning transition on specific customers, products, stores, or even sales reps.
These granular issues are critical for strategic positioning: choosing your customer, aligning your organization with your company’s emerging Profit Peak customer needs, and managing the company both during the transition period and in its transformed industry.
In analyzing possible strategic groups in both your current and transformed industry, it is very instructive to focus on the value-to-cost relationship of your major profit segments: Profit Peaks, Profit Drains, and Profit Deserts. The key questions are, How can you improve your customer value footprint, reduce your cost, or both, creating a new basis for competitive advantage? The cases we present throughout this book illustrate this process.
For example, Edison Furniture increased its value footprint for its Profit Peak customers, while Baxter both increased its value footprint and reduced its cost for its Profit Peak customers. In Chapter 9, we provide a more comprehensive range of examples, all from cases in this book.
Bad Profits
Recently, we had a lengthy conversation with the vice president of finance of a major company. She was immersed in the capital budgeting process and wanted to explore ways to evaluate investment proposals.
Our conversation started with a discussion of the cost of capital, which is an important ingredient in evaluating investments. She was going through the periodic process of ranking investment opportunities by their projected returns, taking into account the cost of capital in order to select and fund the most lucrative opportunities.
Throughout this book, we argue that all revenues are not equally profitable—some produce high profits, and some actually produce losses. But are all profits equally desirable?
The surprising answer is no—and the key to understanding the difference between “good profits” and “bad profits” is demonstrated in Figure 3.4.

FIGURE 3.4 Investment Decision Matrix
The desirability of an investment is not just a function of the likely returns but also a function of the strategic relevance (whether the investment moves the company’s strategy forward). This is especially important in today’s Age of Diverse Markets when the currents of change are transforming key aspects of every industry.
Two quadrants of the matrix are easy to evaluate; the other two take some thought. The upper right, high returns and high strategic relevance, is an obvious winner. The lower left, low returns and low strategic relevance, clearly is a poor bet.
Consider the upper left quadrant: high returns but low strategic relevance. This quadrant is quicksand. These investments look very attractive, but they take the company’s capital and focus away from its main line of business. All too many companies have unclear and unproductive positioning because they lack the discipline to say no to attractive-looking investments that don’t fit. Ultimately, companies that pursue these types of investments get picked off by highly focused competitors. These are the investments that produce bad profits.
Think about the lower right quadrant: low returns but high strategic relevance. These are investments that would show up at the bottom of a simple capital budgeting ranking, but they are essential to moving the company forward. Here, the watchword is courage, a character trait that is especially critical in today’s transforming business world.
For example, several years ago we met with the top officers of another major telephone company when telephone companies first began to develop video capabilities that could compete with cable TV. The company had a study that showed that an early investment in video would not pass the company’s investment hurdle rate. The question was whether to invest.
After discussion, the officers saw that the real question was not whether this initial video investment produced high enough returns. Instead, the right question was which customers should they choose. Did the company want to remain the dominant communications channel into millions of customers, or was it willing to open the door for a host of competitors to get a foothold in their customers—especially the early adopting Profit Peaks customers. Fortunately, the management team made the right decision.
The moral of the story is that while investments in the upper left quadrant produce bad profits, investments in the lower right produce “good losses.”
How is this possible? Investments are virtually always part of larger business or strategic initiatives. The correct frame of analysis is the overall initiative, not just the component investment.
Within this strategic context, capital budgeting is a useful way to evaluate alternative ways to accomplish a strategic goal (for example, which machine to choose to accomplish a given task), but it is inappropriate to use capital budgeting to determine strategy.
This is why it is so important that CFOs and other top finance managers be broad-gauge strategic thinkers, as well as disciplined business managers—especially during this Age of Diverse Markets. This is the power of choosing your customer wisely.
Risk Management
In most companies today, risk assessment and management are largely a qualitative process. The core analytical tool is a heat map. Managers develop heat maps by identifying the main operating elements of their companies and then assessing whether each element is likely to be affected by an identified risk factor.
For example, a company’s sales force is a critical operating element, so it probably would be ranked high in importance. The risk of massive resignations in the sales force or of technology replacing sales reps probably is low. So on a risk heat map, on which the horizontal axis represents an element’s importance and the vertical axis represents an element’s risk of damage (and potential impact), the data point for sales will be in the lower right quadrant, as shown in Figure 3.5.

FIGURE 3.5 Example of a Risk Heat Map
Here’s another example. Assume that the same company has its main warehouse located in an area that is prone to be hit by major hurricanes. The importance is high, and the risk is high (reflecting the somewhat high risk of being shut down and the extreme damage that a shutdown would cause). This also is shown in Figure 3.5.
In a third example, the company may have a DC in the Northeast. The importance of this DC is gauged at medium because in a pinch, the products could be moved into the area from DCs in nearby regions or through a set of cross-docks from the main warehouse. The risk is assessed at medium, primarily from a possible unionization that would increase the DC’s operating costs. Figure 3.5 shows this as well.
The point here is not that a risk heat map is useless but that it is very qualitative and vague.
Profit contours, on the other hand, enable managers to identify and quantify the exact impact of risk factors on their specific customer segments, product families, stores, and other business elements.
More importantly, virtually all risk analyses ignore the most important risk: loss of core profitability. For example, we recently met with the CEO of a major company. He showed us his latest heat map risk analysis. His risk management team had identified several factors as priority risks, including potential price pressure from a rising digital competitor, along with certain operational and systems risks. These potential threats raised concerns.
We had recently completed a profit landscape analysis and profit strategy for his company. We found that about 4 percent of the customers provided over 70 percent of the company’s net profits, and when these same customers bought the most profitable 3 percent of the company’s products, this customer and product segment provided about 60 percent of the total net profits.
We asked the CEO whether he considered this profit concentration to be a business risk. He replied with a strong yes. The number of customers in this segment amounted to a few thousand, and a quick query showed that the sales reps serving these all-important customers were distributed almost randomly among the company’s segments of sales rep performance—in fact, many more were served by underperforming reps than by Profit Peak reps.
When we dug further into the company’s Profit Peak customer segment, we found that most of these customers were significantly integrated with the supplier through vendor-managed inventory and other innovations, they had a strongly coordinated planning process, and they were long-time customers with broad portfolios of products. Interviews with the sales reps showed that these customers were very receptive to service innovations. Moreover, they were not price sensitive because the products constituted only a small proportion of the customers’ cost of goods sold and were critical to the quality of the customers’ products.
A new digital competitor was trying to pick up market share by price-cutting on products that were relatively undifferentiated and sold to customers who were bargain hunters. In fact, the CEO’s company had lost some of its Profit Desert and Profit Drain customers to this competitor, while most of its Profit Peak customers had remained loyal.
The glaring question was why this company’s exhaustive risk management process, which involved interviews with all the company’s top officers as inputs into the heat map, had not picked up its customer profit risk profile. The direct answer was that this profile, which initially was concerning (with its concentration of profits), but was shown upon examination to be quite low, was “hidden” from the company’s traditional risk metrics— although it was glaring once the company adopted transaction-based profit metrics and analytics.
The sources of risk can reside within the industry’s current strategic paradigm, or they can stem from breakout currents of change—or even force majeure events like the pandemic crisis. A current competitor low- ering prices exemplifies the former, while a new innovation (like Apple moving from its computer platform to take over the phone, music, and camera industries) or a new business model (like Southwest Airlines’ revolutionary low-cost, low-price strategy) exemplifies the latter.
Profit contours show a risk management team the exact location of their company’s Profit Peaks and Profit Drains. They provide a mechanism for precise quantification and modeling of various risk-increasing scenarios and for identifying and modeling various risk-reducing actions.
Profit River Management
The objective of profit river management is to give top management a small set of natural business units (we think of these as profit-based strategic business units, or SBUs) to monitor and manage that are critical to the company’s success. The company should coordinate and align its functions to meet the needs of each profit river.
For example, N. Oliver Designs, a disguised retailer, has six profit rivers:
• Profit Peak stores
![]() Profit Peak categories
Profit Peak categories
![]() Other categories
Other categories
• Profit Drain and Profit Desert stores
![]() Profit Peak categories
Profit Peak categories
![]() Other categories
Other categories
• Profit Peak customers and prospects
• Profit Drain and Profit Desert customers
Note that these profit rivers overlap each other; this provides a valuable set of complementary perspectives. Alternatively, management could define its profit rivers so that they have no overlap and together constitute the whole company’s bottom line.
Profit rivers often cross functional boundaries, and they almost always have profit generation (or loss reduction) as a defining characteristic. They are major rivers of business that flow through the functional areas, and functional area managers are responsible for coordinating and aligning in order to meet each river’s needs in a specifically appropriate way. Profit rivers should not simply be a company’s traditional business units carried forward from the prior Age of Mass Markets.
The following sections describe the characteristics of each of N. Oliver Designs’ profit rivers.
Profit Peak Categories in Profit Peak Stores
In these high-profit stores, this group of product categories accounts for about $470 million in revenues and $59 million in profits. The high-profit (Profit Peak) products within this group of categories (bear in mind that a product category is composed of many products, some highly profitable, others not) contribute $274 million in revenues and $66 million in profits, while the low-profit (Profit Drain and Profit Desert) products in this group contribute $196 million in revenues but lose a surprising $7 million.
This group of categories in this set of stores constitutes the highest-profit-leverage sales channel in the company. Its natural management constituency is composed of relevant managers from store operations, category management, supply chain management, and several other functions.
Other Categories in Profit Peak Stores
In these high-profit stores, this group of product categories contributes about $355 million in revenues but only $8 million in profits. The high-profit products in this group contribute $140 million in revenue and $21 million in profits, while the low-profit products contribute $215 million in revenues but lose $13 million.
This broad group of categories produces strong revenues but contributes relatively low profits, even though the stores in this group are the strongest earners in the company. The natural constituency set of managers is composed of largely the same set of relevant store operations managers and supply chain managers as above, but different category managers, plus other selected functional managers.
Profit Peak Categories in Profit Drain and Profit Desert Stores
In this group of low-profit stores, this set of high-profit product categories produces $234 million in revenues and $18 million in profits. The high-profit products in this group account for about $130 million in revenues and $25 million in profits, while the low-profit products contribute $104 million in revenues but lose $7 million.
This group of products produces moderate revenues and moderate profits. The natural constituency is composed of a different set of store managers than the profit rivers above, but the same relevant category and supply chain managers, plus selected others.
Other Categories in Profit Drain and Profit Desert Stores
In these low-profit stores, this group of product categories contributes $158 million in revenues but loses $8 million. The high-profit products account for $69 million in revenues and produce a surprising $8 million in profits, while the low-profit products contribute $89 million and lose a whopping $16 million.
The natural constituency for this group consists of the relevant store managers and supply chain managers as above, but a different set of category managers, plus other relevant managers.
Profit Peak Customers and Prospects
This group of customers overlaps with the profit rivers above because they shop in virtually all stores for all product categories. However, this profit river’s specific focus on this very important set of customers, and its priority on the extremely critical tasks of identifying, obtaining, and developing prospective customers for this group, suggests that it be accorded its special profit river status.
This group of customers generates a very strong $615 million in revenues and $130 million in profits. The high-profit products bought by this group generate $378 million in revenues and $102 million in profits, while the low-profit products bought by this group account for $236 million in revenues and a strong $28 million in profits. Importantly, note that even the low-profit products bought by these premier customers produce strong profits.
The natural constituency of managers involved in this group has some overlap with the profit rivers above, but also has a unique and important set of involved managers.
Profit Drain and Profit Desert Customers
This group of customers overlaps with the first four profit rivers, but it requires a very different focus and a different set of activities. These customers are very important, but for very different reasons from those in the profit river above: they are underperformers who must be improved, either by increasing their profit contribution to the Profit Peaks level (or at least to break even), or by differentiating the service they receive to reduce the cost to serve to compensatory levels. As above, the natural constituency set of managers has some overlap with those above, but the activities involved are very separate and different.
This group of customers is much more problematic. They generate $602 million in revenues but lose $53 million. Importantly, the high-profit products bought by these customers account for $234 million in revenues and a reasonably strong $18 million in profits, while the low-profit products bought by these customers produce $368 million in revenues but lose an amazing $71 million. This certainly warrants an intensive focus because it is a critically important profit drain.
Profit River Structure
This profit river structure provides N. Oliver Designs with a set of six extremely important business segments, some overlapping. Each has a specific, unique situation, a unique set of profit levers, and a unique set of profit opportunities and imperatives. The relevant functional areas need to organize and align in an appropriate way to manage each profit river (and profit stream) effectively.
Together, these profit-based SBUs provide management with a concise, but comprehensive, set of focal points to understand and judge the integrated effects of the company’s initiatives and activities for managing profitable growth.
Transition Initiatives Management
A transition initiative is a project that is undertaken by a team of managers over a period of a few months to address a profit improvement or strategic repositioning opportunity that transaction-based profit metrics and analytics uncovers. These opportunities might involve improving current operating and sales processes, or they may address needs to develop new capabilities as the currents of change transform the industry.
Generally, a company should undertake two or three initiatives at a time. As an initiative is completed, another can be added. This allows the teams to focus on a few specific, high-impact issues without disrupting the ongoing business. The company should assess its portfolio of transition initiatives each quarter. We will explain this process in more detail in Chapter 8.
For example, N. Oliver Designs identified four candidate initiatives that together promised to add about $50 million per year to the company’s bottom line, a 75 percent increase in profitability:
• Refocus advertising toward Profit Peak customers: $14.2 million.
• Train sales associates to accelerate Profit Peak orders and customers: $11.5 million.
• Consolidate vendors to raise Profit Drain and Profit Desert products’ profitability: $8.9 million.
• Begin to adjust the store portfolio: $15.4 million.
Refocus Advertising Toward Profit Peak Customers
Traditionally, the company’s sizable advertising program was aimed at the broad market, with a focus on newspaper flyers and similar wide-market vehicles. Diverting even a relatively small fraction of this to highly targeted Profit Peak customers and prospects would provide great profit leverage to increase the Profit Peak customer count; to increase their Profit Peak product purchases; and to develop the customers who will become Profit Peaks in the transformed industry.
Train Sales Associates to Accelerate Profit Peak Orders and Customers
The Profit Peak sales reps, especially in Profit Peak stores, provided virtually all the company’s profits. Training this group to (1) increase Profit Peak product sales, and (2) convert a small fraction of Profit Drain, and especially Profit Desert, customers to Profit Peaks promised to have a huge impact on profits very quickly. After that, the training program could be spread to other reps throughout the company and adapted to provide a vehicle for introducing and growing the new customers and products that will become Profit Peaks as the industry changes.
It is important to develop a supplemental near real-time profit-monitoring system, with order-by-order profit monitoring and frequent coaching, perhaps daily. It is best to start with the Profit Peak stores, which have the highest leverage. (The highest-profit customers and stores are the easiest to grow because they have shown their ability to form productive relationships.) When their profits skyrocket, the other stores will want to follow fast.
Consolidate Vendors to Raise Profit Drain and Profit Desert Products’ Profitability
The objective is to systematically build volume in the Profit Peak vendors (and those who should be or will be) by consolidating vendors in return for support and price reductions to lower the cost of goods sold (COGS) and increase profitable sales.
It is very helpful to share with each vendor the evidence of the unprofitability of the vendor’s products and to challenge the vendor to enable you to carry its products profitably. Your transaction-based profit metrics and analytics are very helpful in this discussion. In our experience, vendors respond very positively to this concrete evidence.
Begin to Adjust the Store Portfolio
The company’s 63 Profit Peak stores generated nearly $38 million in profits, while the worst-performing 31 stores generated $109.2 million in revenue but lost $15.2 million. The objective is to begin to shift resources from the money-losing stores to the Profit Peak stores (both current and prospective stores).
Profit-Driven Processes
A company’s core business processes—ranging from account selection to pricing to supplier management—are the prime drivers of day-to-day profitability. Today, most companies’ business processes are disconnected from direct profit maximization.
For example, sales—choosing your customer—is the front-wheel drive that moves the company through its industry. Yet, virtually all sales reps are compensated on revenues, sometimes on gross margin or other factors like new product introductions. As we have seen, neither revenue nor gross margin maximization produces maximum profits, and some revenues are vulnerable to impending competition from digital giants with arm’s-length customer relationships, low costs, and network effects.
Instead, managers can insert net profit information directly into their sales-targeting and product mix development processes, directly increasing net profits. The same is true for operating-cost reduction. Managers can supplement this profit information with transition initiative inputs that steer the company toward its defensible strategic high ground, and away from destructive competition. Moreover, several very important business processes like demand management (managing order frequency and volatility) are nearly always unseen and unmanaged; profit information strongly impacts these processes as well.
Profit-driven processes utilize transaction-based profit information to directly maximize the profitability of each of these core business processes in three vital areas: customer, product, and supply chain management. This includes descriptive information—showing the current profitability, profit-generating efficiency (current profitability relative to potential total profit opportunity—that is, projected profitability if the process were operating at company demonstrated best practice), and existing profit opportunity (remaining potential profit upside); and prescriptive information—identifying and prioritizing profit opportunities across the relevant processes, including the changes that need to be developed to adapt to the currents of change.
Moreover, it is important to separate each set of profit-driven processes—customer, product, and supply chain—into the three profit segments: Profit Peaks, Profit Drains, and Profit Deserts. Each profit segment has a very different population, and each is reasonably homogeneous, but the three are very different from one another. For very granular analysis, it is best to use a nine-node customer-versus-product profit contour. This clustering is especially important when applying machine learning to the processes because each node has different customer behavior and profitability patterns.
For a company starting to develop its profit-driven processes, it is helpful to cluster them into near-term opportunities (mostly adding the right profit information to existing processes); midterm opportunities (mostly completing adding the right profit information to existing processes, plus starting to modify existing processes and developing processes that do not exist); and longer-term opportunities (completing the development of profit-generating processes).
Customer Profit-Driven Processes
Seven profit-driven processes are important determinants of customer profitability: the right customers, prices, contracts, product mix (by customer), sales process and channels, customer relationships, and customer promotions.
Product Profit-Driven Processes
Seven profit-driven processes are key determinants of product profitability: the right products, prices, customer mix (by product), suppliers and product cost, product promotions, returns process, and manufacturing process.
Supply Chain Profit-Driven Processes
Six profit-driven processes are crucial determinants of supply chain profitability: the right order pattern, supply chain product flow (for example, drop ship from main warehouse, ship from local DC), facility network, inventory (overall and at each stocking point), transportation, and supplier relationship.
It is important to bear in mind that the currents of change make this a moving target. While these processes will maximize a company’s ongoing profitability, it is crucial to overlay a set of repositioning goals (for example, develop a set of new accounts or products that are increasing in importance, or, conversely, reducing exposure in the accounts or products that are becoming vulnerable to new competitors). Transaction-based profit metrics and analytics enable managers both to identify these emerging needs and to manage the transition through transition initiatives.
Profit Crossroads
The profit crossroads is an information exchange forum that fulfills a critical need for coordination among operating managers who are working on profit-driven processes. While this need is very important, it is rarely systematically addressed in companies today.
In current practice, most day-to-day interfunctional communications (for example, a product manager asking a sales rep to alter the product mix in a particular customer) are done largely through ad hoc emails or other means. The profit crossroads provides a systematic and effective solution to this important unmet need.
As operating managers and sales reps work to bring every process of the company to best practice, they need detailed information, and they require coordinated responses from their counterpart managers for tasks that they cannot alone achieve. For example, if a sales rep sees that a customer’s order pattern is much too frequent and is driving the customer into unprofitability, the rep should ask his or her supply chain counterpart to discuss changing the order pattern with the customer’s inventory replenishment manager.
The number of information and action requests increases exponentially as granular profitability management through a company’s profit-driven processes ramps up. This is a natural consequence of moving from the isolated all-the-same functional management of the mass market world to the current diverse markets era with its multiplicity of tightly coordinated teams of managers responding to diverse customer needs.
The profit crossroads has two functions: information sharing and action coordination. Both are critical success factors.
Information Sharing
The company’s profit landscape contains important profit information, including current profit stack information for literally every transaction. This information is available to the company’s managers through simple profit crossroads queries. Managers can aggregate and explore it in any way the company’s data will allow. The profit crossroads also shows a side-by-side comparison of any particular company element, like customer or product, to the company’s best practice.
A second set of information available through the profit crossroads is the agenda of profit improvement tasks that managers have committed to accomplish, along with the expected and actual gain to date. This is a valuable reference for other managers working on particular customers, products, operating plans, and the like.
A third set of information provided by the profit crossroads is a capability to “follow” particular customers, products, or other company elements, as events unfold. This is provided in the form of “profit notices” sent to managers who “subscribe,” and it is updated as new tasks are undertaken or completed or as new information becomes available.
Action Coordination
As managers consider committing to profit tasks in the context of their profit-driven processes, they need to coordinate with their counterpart managers both to request coordinated action and to find out whether the counterpart can agree. The profit crossroads provides this capability.
For example, a manager might post a request to another manager. The request would remain open until the other manager responds. If the request were agreed to, it would be posted to the manager’s notes, as well as to the relevant customer’s and/or product’s (or other element’s) notes. The profit crossroads would keep a set of these notes, including if and when the requested action was completed so others could see the ongoing profit improvement activities by customer, product, or other element, as well as open requests.
Inevitably, some requests are a high priority to the requestor and low priority to the responder. The profit crossroads accommodates this by keeping a list of denied requests. If the requestor still wants action, he or she can appeal to a supervising manager, who will decide what to do.
Transforming the Profit Landscape
The four cornerstone business processes—strategic positioning and risk management, profit river management, transition initiative management, and profit-driven process management—are critical building blocks for success both in accelerating the profits of your ongoing business, and in repositioning your company for sustained profitability in the transforming profit landscape of the Age of Diverse Markets.
These processes cover the three success imperatives: choosing your customer, aligning your functions, and managing your organization.
Managers who creatively and systematically drive these powerful processes will pilot their companies through today’s turbulent business conditions, while competitors focused on tuning up their traditional business practices are left wondering why they are falling further and further behind.
THINGS TO THINK ABOUT
1. Have you created a defensible strategic positioning against the digital giants for your Profit Peak customers? For the customers who will be your Profit Peaks in three to five years?
2. Have you quantitatively evaluated the risks of this positioning against the upcoming changes in your competitive environment?
3. Have you aligned your organization’s functional departments to create and manage your profit rivers?
4. What are your priorities in transforming your organization to align with your Profit Peaks?
![]()
* See also: Ben Shapiro and Jonathan Byrnes, “Bridge the Gap Between Strategy and Tactics,” Harvard Business School Working Knowledge, November 3, 2003. Also see: Ben Shapiro and Jonathan Byrnes, Bridge the Gap Between Strategy and Tactics with the Magic Matrix, Harvard Business School Publishing Working Paper, 2003 (Note #9-999-008).
* Michael Porter, Competitive Strategy (New York: Free Press, 1980).