
Chapter 11. Verifying Firewall Operation
Refer to the following sections for information about these topics:
• 11-1: Checking Firewall Vital Signs—Discusses methods you can use to diagnose a firewall’s health. System resources, logging output, throughput, failover, interface operation, and packet queuing are all covered.
• 11-2: Watching Data Pass Through a Firewall—Covers ways that packets can be logged or captured as they pass through a firewall or through its interfaces.
• 11-3: Verifying Firewall Connectivity—Provides a set of basic approaches to verify working communication through a firewall.
In the course of configuring and using a firewall, it is important to follow the appropriate security policies and offer the proper connectivity to the user community, all while making sure the firewall is operating properly.
A firewall’s operation has many aspects, so it can be difficult to assess its health. When users call to complain about slow or lost connectivity, you should be able to decide if the problem is in the firewall or somewhere else.
This chapter presents several ways you can check a firewall’s operation. This chapter also covers data-capture methods so that you can verify if data is passing through a firewall as expected.
11-1 Checking Firewall Vital Signs
After a firewall is put into production, it is important to know how to check its health. You can proactively monitor various resources and statistics in an effort to determine when the firewall has a problem or becomes underpowered. As well, when users complain of problems or slow response times, you should be able to look into some of the firewall’s inner workings to quickly spot issues.
How a firewall will behave under the load of a production network with real users and real applications is difficult to predict. When a problem is reported, you can rely on many of the available firewall statistics to see what is wrong. However, those numbers do not mean much if you do not have anything to compare them against.
You should make every effort to determine a baseline or average for several firewall parameters. Do this while the firewall is operating normally and all users are satisfied with its performance. Monitor the following statistics periodically so that you get an idea about their values and how they change during a business day or week:
• CPU utilization
• Memory usage
• Xlate table size
• Conn table size
• Failover activity and synchronization rates (if applicable)
The following sections show you how to monitor these functions.
Using the Syslog Information
Firewalls normally stay busy silently inspecting traffic, denying some packets and forwarding others. The only way to “feel the pulse” of your firewall, to see what it has been doing, is to look back through the Syslog messages it has generated.
You can view the most recent Syslog information, whether or not you have a Syslog server set up. You can enable buffered logging with the logging buffered level configuration command and view the buffer with the show logging command. However, only the most recent messages are kept in the buffer. On a busy firewall, the buffer can be completely overwritten in only a few seconds, so you might not be able to find the information you need.
Instead, you should seriously consider setting up machines to collect Syslog messages from every firewall in your network. Syslog information gives a very useful historic record in the following ways:
• Troubleshooting information—Events in the life of the firewall itself (reloads, failovers, memory shortages, and so on) are recorded, along with the reasons some packets were denied or dropped.
• Performance and activity—Address translations and connections are recorded as they are created and torn down. The duration (both time and data volume) of each connection is also recorded so that an analysis of data throughput can be computed over time.
• Security audit trail—The results of user authentication can be recorded for a historical record or for usage information. Address translation and connection information can be recorded and used as evidence when someone from the outside attempts malicious activity.
The same can be recorded for internal users attempting similar activity toward the outside world. In the case of port address translation (PAT), the Syslog record is the only evidence that can be used to backtrack from the outside to find which internal user was using the PAT global address at a certain date and time.
Tip
When you set up a Syslog server, make sure you have a system (both hardware and the Syslog software) that can handle the appropriate Syslog message rate sent by the firewall(s). This rate varies according to the firewall’s connection load. More importantly, it varies according to the Syslog severity level configured on the firewall.
Refer to Chapter 10, “Firewall Logging,” for detailed information about Syslog planning and analysis.
After you configure a firewall to send Syslog information to a server or memory buffer, you should verify its operation. You can use the show logging command for this, paying attention to the first dozen lines of output. Look at each type of logging to see if the appropriate ones are enabled and if they are set to the correct severity level. In particular, you should see a count of the total number of messages sent to each enabled destination. In the following example, both buffer and trap (Syslog server) logging are enabled and active:
Firewall# show logging
Syslog logging: enabled
Facility: 20
Timestamp logging: disabled
Standby logging: disabled
Console logging: disabled
Monitor logging: disabled
Buffer logging: level warnings, 5526712 messages logged
Trap logging: level warnings, 6933062 messages logged
Logging to outside 192.168.2.142
History logging: disabled
Device ID: disabled
Mail logging: disabled
ASDM logging: level informational, 128765 messages logged
21.68.65/47808 to 1.0.0.0/0
500004: Invalid transport field for protocol=17, from 172.29.68.65/47808 to
1.0.0.0/0
[logging buffer output omitted]
Notice that the total numbers of buffer and trap logging messages are different. This is because each logging method is configured independently. For example, trap logging might have been enabled at an earlier date than buffer logging. Otherwise, each logging method can be configured with a different severity level threshold, causing each one to generate a different type and volume of message.
Checking System Resources
A firewall inspects traffic and performs its functions by using a combination of system resources. From a hardware standpoint, these resources are very straightforward and include the CPU and system memory. The following sections analyze these resources.
Firewall CPU Load
You get a general idea about the processing load on a Cisco firewall by using the show cpu usage command. For example, the following firewall appliance has a 5-second average of 27 percent. The command output also shows that the CPU is under a consistent load of about 24 percent:
Firewall# show cpu usage
CPU utilization for 5 seconds = 27%; 1 minute: 25%; 5 minutes: 24%
Firewall#
As a rule of thumb, the CPU utilization should stay below an average of 80 percent. The utilization might spike or temporarily peak at a greater value, as seen in the short-term 5-second utilization. This is normal behavior, because the CPU could be processing a periodic task or a short burst of traffic.
In extreme situations, you might see Syslog message ID 211003 (ASA-3-211003, for example) being generated. This message is sent when the firewall CPU has consistently been at 100 percent.
If the CPU stays above 80 percent during a time you consider to be a normal traffic load, without a significant attack occurring, you should consider upgrading the firewall or lightening its traffic load. Some of the possibilities for doing so are as follows:
• Replace the firewall with a higher-performance model.
• Implement firewall load balancing so that the traffic load is balanced across two or more firewall platforms. Refer to Chapter 9, “Firewall Load Balancing,” for detailed coverage.
• Make configuration changes to reduce the firewall’s processing load; remove any unnecessary activities it is performing.
Tip
If your firewall is configured to run multiple security contexts, remember that these “virtual firewalls” are all being emulated by one firewall platform. If the CPU usage is running high, you might have too many different contexts configured or too many contexts that are heavily used. You can get an idea of the breakdown of CPU resources across the contexts with the show cpu usage context all command, as in the following example:
Firewall# show cpu usageCPU utilization for 5 seconds = 86%; 1 minute: 84%; 5 minutes: 83%Firewall# show cpu usage context all 5 sec 1 min 5 min Context Name 2.2% 2.5% 2.4% system 1.0% 1.1% 1.0% admin 54.6% 52.2% 53.1% CustomerA 27.3% 27.2% 25.6% CustomerB 0.9% 1.0% 0.9% TestFirewall#
The utilization values from the first command are totals for the sum of the context values from the second command. In this example, the CustomerA context is using the most CPU resources and is a good candidate for being moved onto its own firewall platform. With active-active failover, you can assign contexts individually to each of the physical firewalls in a pair to distribute the active roles evenly according to their CPU loads.
To find out more about which activities are taxing the CPU, you can try to track down the most-used processes. The firewall’s CPU continuously performs a number of different tasks, such as processing inbound packets; inspecting ICMP, UDP, and TCP traffic; interacting with the console and user sessions; maintaining failover communication; operating routing protocols; and so on.
In addition, a large number of tasks involve maintaining timers. When xlate and conn entries are created, timers must be started; when the various timers expire, those entries must be deleted. You also can time and control authenticated user sessions. Each of these timer functions has its own process, requiring periodic attention from the CPU. In fact, a process runs continuously just to keep the CPU utilization values computed and updated!
To see the entire list of active firewall processes, you can use the show processes command. Unless you are a Cisco Technical Assistance Center (TAC) engineer, the only interesting information is found in the following columns:
• Process—Displays a descriptive name for the process, such as update_cpu_usage, that computes the values for the show cpu usage command.
• Runtime—Lists the actual amount of time the CPU has spent on each process, in milliseconds. The runtime values begin at 0 when the firewall is first booted and accumulate until it is powered down or reloaded.
Note
Each line of the show processes command begins with three flag characters that give more information about the process. The first character denotes the process priority; it can be one of the following: D (dead), L (low), M (medium), or C (critical).
The second character denotes the process state: r (ready to run), s (sleeping), x (dead), w (idle), or * (running).
For example, the following processes are running at medium and critical priority, respectively:
Mrd 003cb154 013ab118 00d9d580 9130720 013a9190 7660/8192 557pollCsi 0071b139 01d48580 00d9d490 0 01d46618 7340/8192 update _cpu_usage
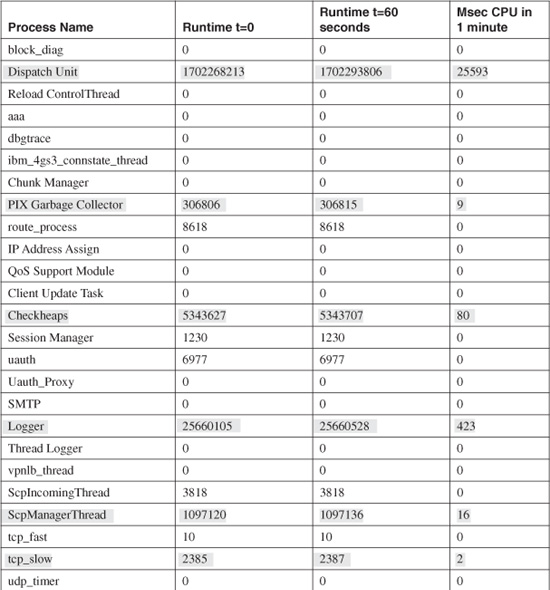
Now suppose you see that the CPU utilization is running a consistent 25 percent, and you want to know why. Although it is somewhat involved, you can discover which processes are “hogging” the CPU by following these steps:
1. Run the show processes command. Copy the output and paste it to another location, such as Windows Notepad.
2. Wait about a minute, and run the show processes command again. Copy and paste this output into another location.
3. For each process listed, subtract the most recent runtime from the first runtime shown. The result is the number of milliseconds the CPU spent on that process during the last minute.
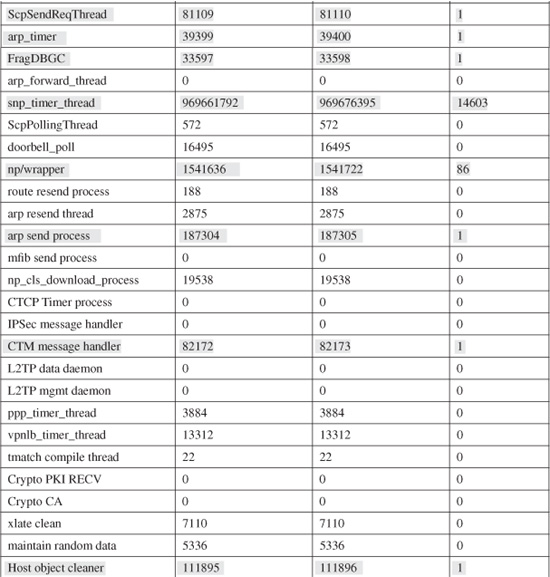
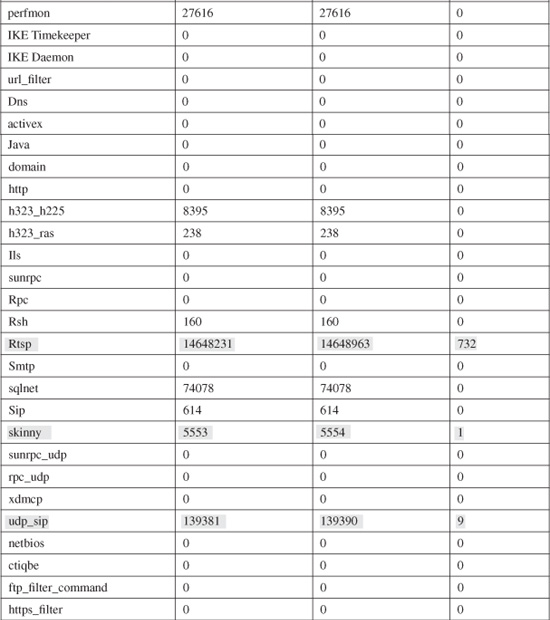
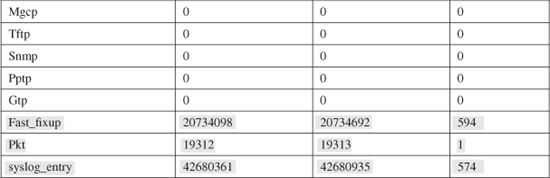
You can use a spreadsheet application such as Microsoft Excel to quickly compute the runtime difference on all the processes. Table 11-1 shows an example of most processes running on a FirewallServices Module (FWSM) platform. The actual runtime difference is shown in the rightmost column. Shaded rows denote processes that have a non-zero CPU usage within the last 60 seconds.
Table 11-1 Computing Actual Firewall Process Runtimes
Firewall Memory
Cisco firewalls base their entire operation on the use of internal random-access memory (RAM). This memory can be broken up and allocated for many processes and other uses. Some examples of memory usage are as follows:
• OS image—A firewall’s operating system image is stored in Flash (nonvolatile) memory. When the firewall is first powered up or reloaded, a small bootstrap executable copies the image from Flash into RAM. From that point on, the CPU runs the image from RAM.
• Configuration—A firewall’s configuration is stored in Flash (nonvolatile) memory with the write mem command. When the firewall boots, the configuration file is copied from Flash to RAM, where each command is executed.
• ACLs—Access lists are compiled into a turbo access control list (ACL) or a compact and deterministic form, and the results are stored in an area of RAM separate from the running configuration.
• Downloadable ACLs—If the firewall is configured to accept per-user ACLs that are downloaded from an authentication server, the contents of those dynamic ACLs are stored in memory.
• Interactive processes—Management sessions through the console, Telnet, and SSH can all require memory. For example, when a command’s output is filtered with the | include keywords, the original output is buffered in memory before being filtered to the session. Other processes include user authentication (uauth), content filtering, and VPN security associations (SA).
• Routing information—The firewall maintains its own “routing table” in memory so that it can make packet-forwarding decisions. Routes are learned through static route configuration and through dynamic routing protocols such as Routing Information Protocol (RIP) and Open Shortest Path First (OSPF). The firewall also maintains an Address Resolution Protocol (ARP) cache in memory for MAC-to-IP address resolution.
• Capture sessions—Each active capture session is immediately allocated a block of 512 KB of memory to use as a packet-capture buffer. The capture buffer can be resized through the use of the capture command.
• Xlate table entries—As address translations are created, they are added to the xlate table in memory.
• Conn table entries—As connections are established through the firewall, they are added to the conn table in memory.
• Packets awaiting stateful inspection—As packets are pulled from interface queues, they are stored in memory. The firewall CPU works through this packet buffer as it inspects the traffic with its fixup procedures.
From a monitoring standpoint, firewall memory is organized in two ways:
• Main memory—The entire contents of the firewall’s RAM memory.
• Blocks—Portions of main memory that are allocated as pools of fixed-size entries. Each size block is used for a specific purpose.
Likewise, you have two ways to query a firewall’s memory usage. To see the utilization of the firewall’s main memory, you can use the show memory command. The following example shows a firewall to have 256 MB of RAM, 85 MB of which is in use, and about 183 MB of memory that is still free. The percentage values are shown as a quick gauge.
Firewall# show memory
Free memory: 183131072 bytes (68%)
Used memory: 85304384 bytes (32%)
------------- ----------------
Total memory: 268435456 bytes (100%)
Firewall#
You can use the show memory detail command to display statistics about how the firewall memory has been fragmented during allocations. However, this information is useful mainly to Cisco TAC engineers.
You can also see how the firewall is managing its block memory with the show blocks command. Consider the following block statistics as an example:
Firewall# show blocks
SIZE MAX LOW CNT
4 100 93 99
80 100 98 100
256 1100 1025 1036
1550 2688 1912 1920
2560 40 40 40
4096 30 30 30
8192 60 60 60
16384 100 100 100
65536 10 10 10
Firewall#
Notice that statistics are shown for each different block size, ranging from 4-byte blocks up to 65,536-byte blocks. Table 11-2 lists the possible block sizes and their purposes.
Table 11-2 Firewall Memory Blocks and Their Uses
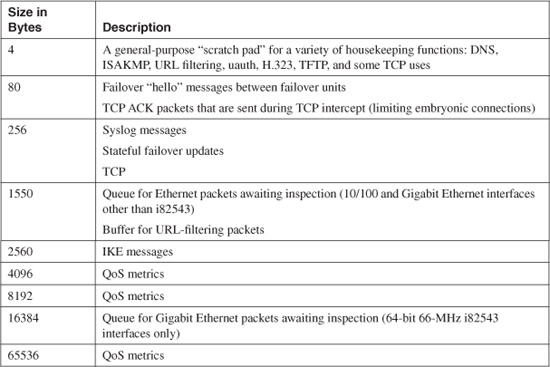
A firewall begins by allocating a default number of each block size when it boots up. The default number of blocks in each size varies with the firewall model, the number and type of interfaces, and the amount of available memory. For example, a firewall might begin by allocating 1,444 1550-byte blocks.
During operation, a firewall might use most or all of the blocks of a certain size. This might occur if Ethernet packets arrive faster than they can be inspected and processed. When the number of blocks approaches 0, the firewall attempts to allocate more blocks of that size from the available memory.
The output from the show blocks command reports the current state of each block size. The count labels, MAX, LOW, and CNT, are not very intuitive; you should think of these in relation to blocks that are available, not blocks that are used. The count labels have the following meanings:
• MAX—The maximum number of blocks that are available for use. The maximum can increase if additional blocks are allocated at some point.
• LOW—The lowest number of blocks that have been available since the firewall was booted.
• CNT—The number of blocks currently available for use.
You can use the clear blocks command to return the maximum number of available blocks to the system defaults and to set the low block counts to the currently available values. This command can be useful if you notice that an extraordinary number of blocks have been allocated and you want to bring the firewall block allocation closer to its default state without a reboot.
Normally, you should not see any of the CNT values staying at 0. If some values do tend to remain at 0, the firewall cannot allocate any more memory to the block size shown.
Tip
Notice that some firewalls set aside memory blocks for Ethernet (1550-byte) and Gigabit Ethernet (16384-byte). Why is there a difference? The 1550-byte blocks are used for traditional Ethernet, for both 10/100 and lower-performance Gigabit Ethernet interfaces. The maximum transmission unit (MTU) for Ethernet is 1500 bytes.
The 16384-byte blocks are reserved for firewalls that have higher-performance Gigabit Ethernet interfaces installed. These interfaces also use an MTU of 1500 bytes. However, the firewall can achieve better performance by moving the 1500-byte packets into and out of the interface in large numbers. In other words, the best performance is obtained when about ten packets are moved at a time.
To see what types of interface controllers your firewall has, you can use the show interface command. You can focus on the controller hardware by filtering the output with the show interface | include (line protocol | Hardware) command, as shown in this example:
Firewall# show interface | include (line protocol | Hardware)Interface Ethernet0/0 "outside", is up, line protocol is up Hardware is i82546GB rev03, BW 100 Mbps, DLY 100 usecInterface Ethernet0/1 "", is up, line protocol is up Hardware is i82546GB rev03, BW 100 Mbps, DLY 100 usecInterface Ethernet0/2 "", is up, line protocol is up Hardware is i82546GB rev03, BW 100 Mbps, DLY 100 usecInterface Ethernet0/3 "dmz", is administratively down, line protocol is up Hardware is i82546GB rev03, BW 100 Mbps, DLY 100 usecInterface Management0/0 "management", is administratively down, line protocolis down Hardware is i82557, BW 100 Mbps, DLY 100 usecInterface Redundant1 "inside", is up, line protocol is up Hardware is i82546GB rev03, BW 100 Mbps, DLY 100 usecFirewall#
Checking Stateful Inspection Resources
As a firewall inspects and passes traffic, it maintains two tables of entries: address translations (xlates) and connections (conns). You can get an idea of the inspection load by looking at the size of these tables.
Xlate Table Size
To see the translation table size, use the following command:
Firewall# show xlate count
The output from this command shows the current number of xlates in use and the maximum number that have been built since the firewall was booted. The firewall in the following example currently has built 15,273 translations. At some time in the past, a maximum of 22,368 xlates were in use:
Firewall# show xlate count
15273 in use, 22368 most used
Firewall#
The xlate count is the sum of both static xlates (from the static command) and dynamic xlates (from nat and global commands).
When you see the xlate count, it might not be obvious whether there are too many translations. When a host passes through the firewall, it can use only one translation if it falls within a static mapping. If a host triggers a dynamic translation, the firewall creates one xlate for every unique PAT connection.
In other words, it is not possible to estimate or calculate ahead of time the number of xlates that will be used. Instead, be sure to look at the xlate count periodically so that you can get an average baseline value. Then, if you see the xlate count jump to a much higher value later, you can assume that something is wrong. In that case, your firewall could be faced with building xlates during an attack of malicious activity.
Conn Table Size
A firewall creates and tears down connection entries for UDP and TCP connections between pairs of hosts. You can get connection statistics with the following command:
Firewall# show conn count
The output of this command shows the current number of connections in use and the maximum number of connections that have been built since the firewall was booted. The firewall in the following example has 4495 connections currently in its conn table, and it has had up to 577,536 simultaneous connections in the past!
Firewall# show conn count
4495 in use, 577536 most used
Firewall#
The conn count is the sum of all types of connections. The count fluctuates as connections are built and torn down. Again, you should periodically use this command to get a feel for the average number of connections your network uses. If the conn count is excessive, as in the maximum number in the preceding example, an attack is likely in progress. If you have a failover pair of firewalls, should not the xlate and conn counts be identical in each unit? The xlate and conn entries are replicated only from the active unit to the standby unit if you have configured stateful failover. Otherwise, the active unit shows positive counts for both xlates and conns, but the standby unit shows counts of 0.
Also, it is not unusual for the active and standby table counts to be quite different, even when stateful failover is being used. The entire xlate and conn tables are not replicated between the units. Rather, only new entries (either created or torn down) are replicated.
If the stateful failover link goes down, the standby unit misses new table entries. When the link comes back up, only new entries from that point on are received. If the standby unit loses power or reboots, its entire xlate and conn tables are lost. When it comes back up, it receives the continual flow of only new entries—not the entire contents of the tables. Existing conn table entries from the active unit are replicated to the standby unit only if they are actively passing data. Existing connections that are idle are not replicated.
Also, the two units might show a disproportionate number of conn table entries if HTTP replication is not enabled between the failover pair. In this case, the active unit maintains HTTP connection entries but does not replicate those to the standby unit.
A failover pair has been configured for stateful failover in the following example. Somewhere along the way, the standby unit lost power and was rebooted. Notice that the table counts are quite different; the standby unit lost its tables and has received only new table changes, and HTTP replication has not been configured on the failover pair. The active unit is shown first, followed by the standby unit.
[Active unit]
Firewall# show conn count
4263 in use, 577536 most used
Firewall# show xlate count
15166 in use, 22368 most used
Firewall#
[Standby unit]
Firewall# show conn count
686 in use, 690 most used
Firewall# show xlate count
659 in use, 665 most used
Firewall#
Checking Firewall Throughput
Many of the firewall statistics that you might display are based on incrementing counters or “snapshot” values. These give you an idea of the volume of activity over a long period of time, but not of the rate. For example, to gauge your firewall’s throughput, you might want to see the number of bytes per second being forwarded on an interface or the number of TCP connections per second that are being inspected.
A Cisco firewall keeps several running statistics that you can display. You also can use an external application to perform some analysis on firewall counters and messages. The following sections describe several ways to show the firewall throughput.
ASDM
The Adaptive Security Device Manager (ASDM) default view shows several useful throughput calculations. Figure 11-1 shows a sample ASDM display, where you can determine the following throughput measures:
• Current interface throughput, in kbps, is shown in the upper-right portion of the display. This is the aggregate or total of input and output rates. (You can select an interface to see the current input and output throughput values.)
• UDP and TCP connections per second, in the middle-right portion of the display.
• A history of the first (lowest-numbered) interface throughput, in kbps, shown in the lower right of the display. Separate graphs are shown for input and output throughput. Figure 11-1 shows a graph of the “outside” interface activity.
Figure 11-1 A Sample ASDM Display of Firewall Throughput

Syslog
Some Syslog analysis applications can parse the history of Syslog messages generated by a firewall. If the firewall is configured to report about connections being set up and torn down (logging severity level 6, informational, by default), the Syslog analyzer can calculate the number of connections per second, the interface data rate per second, and so on.
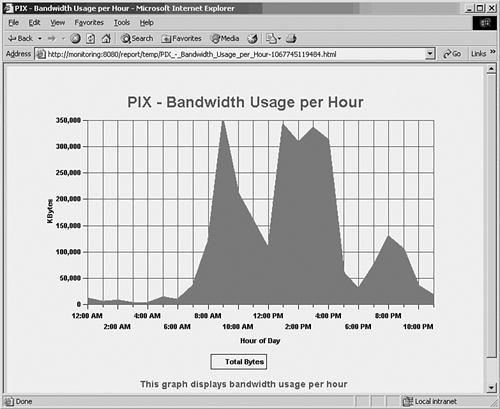
For example, a Syslog analysis tool is used to present information about the bandwidth being passed through firewall interfaces. Figure 11-2 shows a graph of utilization per unit time, as “bandwidth usage per hour.” In this case, rather than showing the throughput for an individual interface, the total aggregate bandwidth for all interfaces is shown over time.
Figure 11-2 An Example of Firewall Throughput Reporting by Syslog Analysis
Traffic Counters
Cisco firewalls can report traffic throughput on each interface through the command-line interface (CLI). This can be handy if you are connected to a firewall over a console, Telnet, or Secure Shell (SSH) session, and you want to check the throughput.
The firewall keeps running counters of input and output data on each interface while it is operational. These counters begin at bootup or at the last counter reset, and they accumulate until you issue the command to display them. The firewall also computes the average throughput in bytes per second, but this is based on the total time elapsed since the counters were last reset.
To see the traffic counters and throughput information, follow these steps:
1. (Optional) Reset the traffic counters:
Firewall# clear traffic
The data counters, rates, and elapsed time values are reset to 0 for each interface. This step is important so that you establish a time frame for taking throughput measurements.
Note
If you do not begin by resetting the counters, you might end up displaying traffic statistics that have been running for a very long time, as in this example:
Firewall# show traffic
outside: received (in 509866.850 secs): 785027658 packets 2630237219 bytes 1000 pkts/sec 5007 bytes/sec transmitted (in 509866.850 secs): 640777558 packets 494377136 bytes 1004 pkts/sec 0 bytes/secinside: received (in 509866.850 secs): 642131249 packets 1622203492 bytes 1006 pkts/sec 3004 bytes/sec transmitted (in 509866.850 secs): 770623656 packets 1358715766 bytes 1005 pkts/sec 2007 bytes/sec
The counters have been accumulating for 509,866 seconds, or about 5.9 days. Because the data throughput values fluctuate all the time, this is not an accurate estimate of the current throughput.
2. Wait, and then display the traffic statistics:
Firewall# show traffic
You should wait a few seconds or even a minute before displaying the traffic statistics. The byte and packet counters shown will have accumulated over that time. The byte and packet rates (per second) will be calculated as an average over that time.
For example, the following firewall’s statistics were shown after 70 seconds had elapsed. Its outside interface (Gigabit Ethernet) received an average of 2,826,360 bytes per second over those 70 seconds.
Firewall# show traffic
stateful:
received (in 70.750 secs):
15 packets 1560 bytes
0 pkts/sec 22 bytes/sec
transmitted (in 70.750 secs):
1096 packets 1307978 bytes
15 pkts/sec 18487 bytes/sec
outside:
received (in 70.750 secs):
258717 packets 199964989 bytes
3656 pkts/sec 2826360 bytes/sec
transmitted (in 70.750 secs):
210554 packets 48903164 bytes
2976 pkts/sec 691210 bytes/sec
inside:
received (in 70.750 secs):
210849 packets 53713701 bytes
2980 pkts/sec 759204 bytes/sec
transmitted (in 70.750 secs):
256901 packets 166768097 bytes
3631 pkts/sec 2357146 bytes/sec
Firewall#
On an ASA platform, the show traffic command also breaks down the traffic statistics based on logical interfaces and on the aggregate performance of physical interfaces. For example, a firewall might have two physical interfaces, GigabitEthernet1/0 and GigabitEthernet1/1. You can assign each of these a logical name such as outside or inside.
In addition, you can configure the physical interface to trunk multiple VLANs; each VLAN subinterface (GigabitEthernet1/0.1, for example) can become a unique logical interface (dmz, intf3, and so on) while remaining a part of the aggregate physical interface.
In the following example, logical interfaces outside, inside, and Test are mapped from physical interfaces GigabitEthernet1/0, GigabitEthernet1/1.1, and GigabitEthernet1/1.2, respectively.
Firewall# show traffic
outside:
received (in 2701.540 secs):
15754 packets 12405921 bytes
5 pkts/sec 4592 bytes/sec
transmitted (in 2701.540 secs):
1447 packets 126813 bytes
0 pkts/sec 46 bytes/sec
inside:
received (in 2701.550 secs):
1533 packets 132357 bytes
0 pkts/sec 48 bytes/sec
transmitted (in 2701.550 secs):
15936 packets 12364101 bytes
5 pkts/sec 4576 bytes/sec
Test:
received (in 2701.550 secs):
185 packets 19980 bytes
0 pkts/sec 7 bytes/sec
transmitted (in 2701.550 secs):
276 packets 29808 bytes
0 pkts/sec 11 bytes/sec
----------------------------------------
Aggregated Traffic on Physical Interface
----------------------------------------
GigabitEthernet1/0:
received (in 2705.540 secs):
15782 packets 12706533 bytes
5 pkts/sec 4696 bytes/sec
transmitted (in 2705.540 secs):
1447 packets 157397 bytes
0 pkts/sec 58 bytes/sec
GigabitEthernet1/1:
received (in 2705.540 secs):
1541 packets 171097 bytes
0 pkts/sec 63 bytes/sec
transmitted (in 2705.540 secs):
15959 packets 12695684 bytes
5 pkts/sec 4692 bytes/sec
Firewall#
Aggregate interface performance also comes into play for firewalls that are configured for multiple-context security mode. Each context has its own set of logical interfaces (inside and outside, for example) that are mapped from a physical interface or subinterface in the system execution space. From any user context, show traffic shows only the logical interfaces used by that context. However, the system execution space shows a breakdown that includes the aggregate physical interfaces.
Perfmon Counters
A Cisco firewall also keeps statistics about its stateful inspection performance. These values are called performance monitors or perfmon. From this information, you can get a good idea about the types of traffic passing through the firewall. You can also use the displayed rates to see a load distribution of the inspection or fixup processes.
To configure and view the performance statistics, follow these steps:
1. (Optional) Set the perfmon calculation interval:
Firewall(config)# perfmon interval seconds
Perfmon statistics are calculated and optionally reported at intervals of seconds (the default is 120 seconds). This means the results are computed as averages over this interval of time.
2. (Optional) Automatically display perfmon results on the firewall console:
Firewall(config)# perfmon {verbose | quiet}
By default, a firewall displays perfmon information only when a command is entered manually, as quiet mode.
The firewall can automatically display the perfmon statistics at each interval of time if you use the verbose keyword. As soon as this is enabled, the results are displayed only on the firewall console—not on any active Telnet or SSH sessions. This might be handy if you have a terminal connected to the console and you want to see the firewall performance continually updated on the screen. However, if you choose too short an interval, the console connection can become very congested with new perfmon information. As a result, you might not be able to interact with the firewall over the console connection.
3. Display the perfmon statistics:
Firewall# show perfmon
Firewall performance is reported in several groups, with the following labels:
— New xlate entry creation—“Xlates”
— New connection entry creation—“Connections” (the total of all connection types), “TCP Conns,” and “UDP Conns”
— Web content filtering—“URL Access” (new URLs being requested; reported even if Websense or N2H2 servers are not being used) and “URL Server Req” (new Websense and N2H2 server requests)
— Fixups—“TCP Fixup” (new TCP packets inspected), “TCPIntercept” (TCP intercept or embryonic connection inspections if an embryonic connection limit is set), “HTTP Fixup” (new HTTP packets inspected), and “FTP Fixup” (new FTP packets inspected)
— User authentication—“AAA Authen” (uauth authentication requests processed), “AAA Author” (uauth authorization requests), and “AAA Account” (uauth accounting requests)
In the following example, the firewall has just created 107 new TCP connections, inspected 6196 TCP packets, and inspected 2631 HTTP packets, all in the previous second:
Firewall# show perfmon
PERFMON STATS: Current Average
Xlates 53/s 0/s
Connections 146/s 0/s
TCP Conns 107/s 0/s
UDP Conns 38/s 0/s
URL Access 79/s 0/s
URL Server Req 0/s 0/s
TCP Fixup 6196/s 0/s
TCPIntercept 0/s 0/s
HTTP Fixup 2631/s 0/s
FTP Fixup 3/s 0/s
AAA Authen 0/s 0/s
AAA Author 0/s 0/s
AAA Account 0/s 0/s
Firewall#
The Current values are calculated as the number of operations over the last second before the command was issued. The Average values are calculated as an average over the perfmon reporting interval, or the last 120 seconds by default. (Because of a cosmetic bug in some platforms, all the average values might be shown as 0/s.)
Tip
If you are unsure of the perfmon settings, you can use the perfmon settings command to see them. Notice that this command does not use a show keyword, like most other EXEC firewall commands. The perfmon interval and reporting mode are shown.
Checking Inspection Engine and Service Policy Activity
In ASA and FWSM, application inspection is performed by independent inspection engines that are referenced in service policies. You can get information about the activity of the various inspection engines by displaying the active service policies.
One service policy can be applied to a firewall interface to define the actions to take on matching traffic in the inbound and outbound directions. A default service policy also is configured by default and is applied to all firewall interfaces. Any traffic not matched by an interface service policy is matched by the default global service policy.
You can use the following command to display all active service policy statistics:
Firewall# show service-policy
The modular policy configuration of each service policy is shown. This includes the target interface, the service policy name, the class map used to match traffic, and each policy action.
For each inspection engine, the number of packets inspected, dropped, and dropped with reset are shown. Packets are counted only in the service policy where they are matched and inspected. The default global service policy matches all packets that are not matched elsewhere.
In the following example, notice the packet counts for HTTP traffic and how each service policy has matched a different set of packets to inspect. The output of this command gives you a quick snapshot of all the inspections and actions that have been configured on the firewall and are actually being used.
Firewall# show service-policy
Global policy:
Service-policy: global_policy
Class-map: inspection_default
Inspect: dns maximum-length 512, packet 363, drop 0, reset-drop 0
Inspect: ftp, packet 0, drop 0, reset-drop 0
Inspect: h323 h225, packet 0, drop 0, reset-drop 0
Inspect: h323 ras, packet 0, drop 0, reset-drop 0
Inspect: rsh, packet 0, drop 0, reset-drop 0
Inspect: rtsp, packet 26601, drop 0, reset-drop 0
Inspect: esmtp, packet 1668, drop 0, reset-drop 0
Inspect: sqlnet, packet 0, drop 0, reset-drop 0
Inspect: skinny, packet 0, drop 0, reset-drop 0
Inspect: sunrpc, packet 0, drop 0, reset-drop 0
Inspect: xdmcp, packet 0, drop 0, reset-drop 0
Inspect: sip, packet 0, drop 0, reset-drop 0
Inspect: netbios, packet 0, drop 0, reset-drop 0
Inspect: tftp, packet 0, drop 0, reset-drop 0
Inspect: http, packet 36614, drop 0, reset-drop 0
Inspect: icmp, packet 3911, drop 0, reset-drop 0
Inspect: icmp error, packet 171, drop 0, reset-drop 0
Class-map: asa_class_tftp
Inspect: tftp, packet 0, drop 0, reset-drop 0
Interface outside:
Service-policy: test-policy
Class-map: test
Inspect: http, packet 369, drop 0, reset-drop 0
Priority:
Interface outside: aggregate drop 0, aggregate transmit 0
Interface inside:
Service-policy: PolicyA
Class-map: http_class
Inspect: http test_http, packet 99400, drop 41, reset-drop 0
Class-map: ftp_class
Inspect: ftp strict Filter_ftp, packet 696, drop 0, reset-drop 0
Class-map: test
Priority:
Interface inside: aggregate drop 0, aggregate transmit 0
Firewall#
Checking Failover Operation
If you have a failover pair of firewalls, you should periodically check to see that the failover mechanisms are actually working properly. Use the techniques described in the following sections to gauge the failover performance.
Verifying Failover Roles
First, you should verify that the active failover unit is indeed the one you are expecting. When a failover pair is initially configured for failover, only one of them becomes the active unit. The other assumes the standby (passive) mode. If a failover occurs, the two units swap roles.
Recall that the two failover units also have a “primary” and “secondary” designation. This has nothing to do with the actual failover operation, other than to distinguish one unit from the other. Usually, the secondary unit is purchased with a Failover license at a lower price.
Why are the failover units hard to distinguish from each other? The active unit always uses the active IP addresses on its interfaces, and the standby unit uses the standby IP addresses. As soon as a failover happens, the two units swap IP addresses. (Keep in mind that the same thing happens with MAC addresses.) This means if you open a Telnet or SSH session to the active IP address on an interface, you will not know which physical unit answers. To make matters more difficult, both failover units also have the same host name and command-line prompt!
After you open a session, you can use the show failover command to learn the identity of the physical unit (primary or secondary), as well as its current failover role (active or standby).
For example, suppose a failover pair is configured with an inside active address of 192.168.254.1 and an inside standby address of 192.168.254.2. When failover is first enabled, the primary unit takes on the active failover role.
An SSH session is opened to the active address 192.168.254.1. You would use the show failover command to see which unit is currently active:
Firewall# show failover
Failover On
Cable status: Normal
Reconnect timeout 0:00:00
Poll frequency 15 seconds
Last Failover at: 08:34:03 EST Sun Dec 28 2003
This host: Primary - Active
Active time: 7304955 (sec)
Interface stateful (192.168.199.1): Normal
Interface dmz2 (127.0.0.1): Link Down (Shutdown)
Interface outside (172.16.110.65): Normal
Interface inside (192.168.254.1): Normal
Other host: Secondary - Standby
Active time: 2770785 (sec)
Interface stateful (192.168.199.2): Normal
Interface dmz2 (0.0.0.0): Link Down (Shutdown)
Interface outside (172.16.110.66): Normal
Interface inside (192.168.254.2): Normal
[output deleted]
In the highlighted output, it is easy to see that failover is enabled (on), that the host to which you are connected is the primary unit, and that it has the active role. Notice that the pair of units is polling each other every 15 seconds (the default). This means that it takes up to two or three poll intervals (30 to 45 seconds) for one unit to detect that the other unit has failed.
You can also use this command to quickly see the status of every firewall interface—on both units at the same time. For each interface that is being used, you should see the Normal status listed. If you see Waiting, one of the units has missed one hello message from the other and suspects there might be a problem. Testing means that three hellos have been missed, so the interface is currently going through a series of tests. If the tests fail, the interface is marked as Failed.
Verifying Failover Communication
If failover is enabled, you might want to verify that the two units are communicating properly over the failover links. Cisco firewalls can exchange failover information in three ways:
• Failover cable—An asynchronous serial data cable (DB-9 connectors) can connect two PIX units. Failover information is exchanged at 115,200 kbps.
• LAN-based failover—A firewall interface (a physical Fast or Gigabit Ethernet interface only) is used to exchange data between the units. This allows the failover units to be geographically separated.
• Stateful failover—Information about new connections, xlates, and uauth entries is sent from the active unit to the standby unit. The standby unit receives these updates so that it can perform a stateful failover when assuming the active role. (Stateful failover can be used in addition to the failover cable or LAN-based failover.)
If a failover cable is being used, look for the cable status in the show failover command output:
Firewall# show failover
Failover On
Cable status: Normal
Reconnect timeout 0:00:00
Poll frequency 15 seconds
Last Failover at: 08:34:03 EST Sun Dec 28 2004
This host: Primary - Active
[output deleted]
In this example, the cable is in place and the status is Normal. This means the two units are exchanging failover information successfully. With the failover cable, each unit can also determine if the other unit is powered on. If the companion unit has lost power, the cable status shows other side is powered off.
Tip
Keep in mind that the failover cable itself determines which unit is primary and which is secondary. One end of the cable is labeled “primary” and should be plugged into the unit that has the primary firewall license. Obviously, the other end of the cable plugs into the secondary unit, usually the one with the failover license.
If you are using LAN-based failover, the status of the failover cable is irrelevant. The status of the interface dedicated to LAN-based failover communication, however, is important. The primary and secondary failover units are identified through configuration commands.
With PIX 6.3, rather than sifting through output showing the status of the LAN-based interface, you can quickly see the status with the show failover lan command. In the following example, the dmz interface is being used for failover communication. The failover peer at each end of the LAN connection is seen to be Normal.
Firewall# show failover lan
Lan Based Failover is Active
interface dmz (192.168.1.1): Normal, peer (192.168.1.2): Normal
ASA and FWSM platforms do not have this command. Instead, look at the first few lines of the show failover command output:
Firewall# show failover
Failover On
Cable status: N/A - LAN-based failover enabled
Failover unit Primary
Failover LAN Interface: Failover Ethernet2 (up)
Unit Poll frequency 3 seconds, holdtime 9 seconds
Interface Poll frequency 15 seconds
[output omitted]
Note
Unlike with the failover cable, it is not possible to detect the power status of the other unit with LAN-based failover. The cable carries a power signal from each unit so that it is easy to sense a loss of power. No power signals can be carried over a LAN-based failover connection, simply because only IP packets can be exchanged between the two units. If one unit has lost power, nothing in the IP failover packets indicates that. The other unit notices only the absence of failover packets.
In PIX 6.3, you can also use the show failover lan detail command to add a generous amount of debugging information. Most of the output messages are coded values that are not intuitive. However, you can see failover message counters and retransmission queue statistics that show how congested the LAN-based failover link has been.
If you are concerned about two firewalls failing over with little impact to a production network, you have likely configured stateful failover. This type of failover works in conjunction with a failover cable or LAN-based failover. The basic housekeeping functions are communicated over the cable or the LAN interface, and the stateful interface is reserved for sending dynamic updates about connection or translation entries.
If it works properly, stateful failover keeps the standby unit fully informed about the state of every active TCP and UDP connection in the active unit. In addition, the xlate table entries and ARP table entries are replicated. Should the standby unit need to take over, it already has the stateful information and can preserve existing connections during the failover transition.
A failover pair keeps detailed statistics about the stateful information exchange. You will find this at the end of the show failover command output. You should only be concerned about verifying effective stateful updates so that the two firewall units stay synchronized at all times.
For example, the active unit shows the following output from the show failover command:
Firewall# show failover
Failover On
Cable status: N/A - LAN-based failover enabled
Failover unit Primary
Failover LAN Interface: Failover Ethernet2 (up)
Unit Poll frequency 3 seconds, holdtime 9 seconds
Interface Poll frequency 15 seconds
Interface Policy 2
Monitored Interfaces 3 of 250 maximum
Group 1 last failover at: 10:29:18 EST Jan 30 2005
Group 2 last failover at: 10:29:27 EST Jan 30 2005
Stateful Failover Logical Update Statistics
Link : Failover Ethernet2 (up)
Stateful Obj xmit xerr rcv rerr
General 0 0 0 0
sys cmd 13531 0 13531 0
up time 0 0 0 0
RPC services 0 0 0 0
TCP conn 0 0 0 0
UDP conn 0 0 0 0
ARP tbl 29 0 0 0
Xlate_Timeout 0 0 0 0
Logical Update Queue Information
Cur Max Total
Recv Q: 0 1 13531
Xmit Q: 0 1 13573
Firewall#
Here, the number of these types of replicated stateful messages are shown:
• General—The total number of stateful messages
• sys cmd—System commands that have been replicated to the other unit
• up time—Uptime reports (the elapsed time since the unit has been booted)
• RPC services—Remote Procedure Call entry updates
• xlate—Translation or xlate table entry updates (PIX 6.3 only—not shown in the preceding output)
• TCP conn—Conn table TCP connection entry updates
• UDP conn—Conn table UDP connection entry updates
• ARP tbl—ARP table entry updates
• L2BRIDGE tbl—MAC address table entry updates (ASA transparent firewall mode only—not shown in the preceding output)
• RIP Tbl—RIP route advertisement updates (PIX 6.3 only—not shown in the preceding output)
• Xlate Timeout—Xlate entries removed after timeout (ASA and FWSM)
The xmit and rcv columns show how many of each message type have been transmitted or received by this firewall, respectively. While the unit is in active mode, you should see the transmit counters increasing much more than the receive counters. This is because the active unit is tasked with keeping the standby unit updated.
The xerr and rerr columns show the number of transmit and receive errors encountered while exchanging messages. If you find a large number of transmit errors, the sending firewall unit could not successfully send failover messages because of network congestion or a slow LAN interface. Receive errors indicate failover messages that arrived corrupted.
Determining If a Failover Has Occurred
If a failover pair of firewalls is operating correctly, and stateful failover is being used to synchronize the state information, you might never realize when a failover takes place. How can you determine if the units have failed over?
You can use the show failover command to see a record of the last failover event. The output from this command displays the date and time, along with the total amount of time that each unit has assumed the active role. In the following example, the failover occurred on December 28 at 8:34:03 a.m. Be aware that you must have already set the firewall clock (both active and standby units) or have configured the units to use Network Time Protocol (NTP). Otherwise, the failover time stamp will be incorrect, and you will have no idea when it actually occurred.
Firewall# show failover
Failover On
Cable status: N/A - LAN-based failover enabled
Failover unit Primary
Failover LAN Interface: Failover Ethernet2 (up)
Unit Poll frequency 3 seconds, holdtime 9 seconds
Interface Poll frequency 5 seconds, holdtime 25 seconds
Interface Policy 2
Monitored Interfaces 4 of 250 maximum
Version: Ours 8.0(1), Mate 8.0(1)
Last Failover at: 08:34:03 EST Thu Dec 28 2006
This host: Primary - Active
Active time: 7304955 (sec)
Interface stateful (192.168.199.1): Normal
Interface dmz2 (127.0.0.1): Link Down (Shutdown)
Interface outside (172.16.110.65): Normal
Interface inside (192.168.254.1): Normal
Other host: Secondary - Standby
Active time: 2770785 (sec)
Interface stateful (192.168.199.2): Normal
Interface dmz2 (0.0.0.0): Link Down (Shutdown)
Interface outside (172.16.110.66): Normal
Interface inside (192.168.254.2): Normal
[output deleted]
At this point, you should also take note of the failover roles. When this command was entered, the primary unit was in the active role. This means that when the failover occurred, the other unit (the secondary) was active.
The Active time values only serve to give you an idea of how much time each unit has spent in the active role. This is the total cumulative active time since the last reboot—not the amount of time the unit has been active since the last failover. In the sample output, the two units might have failed over more than once. Only the last failover event is noted, and you have no knowledge of any previous ones. Therefore, these units might have traded roles and accumulated active duty time on several occasions.
If Syslog messages have been generated and recorded, you can find a detailed record of each failover and the symptoms surrounding it, complete with time stamps.
Determining the Cause of a Failover
Now consider the importance of knowing why a failover has happened. For a failover to be triggered, one or both firewalls must have detected a problem—either the other unit was unresponsive with failover polls, or an interface had a problem. If a problem exists, you should try to identify it and get it fixed; otherwise, you might be left with only one working firewall out of the pair. In addition, the same problem could recur, causing the firewalls to failover again.
Tip
For proper failover operation, each firewall unit must be able to send failover messages to the other unit on every useable or monitored interface. This means you should make sure each interface on the primary unit can reach each corresponding interface on the secondary unit. A failure of just one interface can trigger a failover condition. (In ASA and FWSM, you can configure a failover policy that triggers a failover when the number of failed monitored interfaces increases above a threshold.)
If you have firewall interfaces that are not being used, make sure you shut down those interfaces with the interface hardware_id shutdown configuration command (PIX 6.3) or the shutdown interface configuration command (ASA, FWSM). You should also make sure that unused interfaces do not have a valid IP address configured. You can use the ip address interface 0.0.0.0 255.255.255.255 configuration command. If any unused interface is left enabled, it could inadvertently trigger a failover just from a lack of connectivity between the failover units.
You can diagnose the cause of a failover event using one of the following two methods:
• The status of interfaces reported by the show failover command
• Failover messages recorded in the Syslog history
If a firewall interface fails for some reason, it might trigger a failover. However, if the interface becomes usable again, it is shown as Normal in the show failover output. If it fails and stays failed, you can use that command to find the broken interface, even at a later date.
The most detailed way to track down the failure is to sift through the Syslog message history. A Syslog server is a must here, because the failover event might be buried within many thousands or millions of other Syslog messages. The firewall logging buffer simply is not large enough to store a long history of messages.
Usually, only the active failover unit is configured to generate “trap” (Syslog) logging to a Syslog server. The standby unit can generate its own Syslog messages, but that causes both units to send duplicate messages to the server. That doubles the amount of message storage required and is usually considered redundant.
Therefore, begin by finding the date and time of the failover event with the show failover command. This gives you a window of time to use when searching through the archived Syslog data.
Failover messages are generated with the identity of the sending firewall unit embedded in the message text: (Primary) or (Secondary). This is important, because it uniquely identifies which physical firewall unit is reporting the failover activity. If logging from the standby unit has not been enabled, you can conclude that any messages found must have come from the unit that was active at that time.
The active unit messages found on the Syslog server tell only half of the failover story; to find the standby unit’s testimony, you have to look elsewhere. For this, it is handy to enable buffered logging in addition to trap (Syslog) logging on the active unit. Unlike trap logging, when buffered logging is enabled, it is enabled on both the active and standby units.
Therefore, the standby unit (after failover) has in its logging buffer a brief record of the failover. In fact, the failover messages are the very last messages recorded in the buffer. Why? This is because that unit was active up until the failover. It would have recorded all sorts of Syslog messages in its buffer, because they were also sent to the Syslog server. Any failover messages would be recorded there, up until the unit switched to standby mode. Then the unit becomes passive and does not really generate any further Syslog messages.
Therefore, use the search terms Primary or Secondary when you search through the Syslog messages. Then go to the standby unit (after failover) and get a record of its logging buffer with the show logging command.
An Example of Finding the Cause of a Failover
A failover has occurred within a pair of Cisco Firewalls. From the show failover command, you find this time stamp:
Firewall# show failover
Failover On
Cable status: Normal
Reconnect timeout 0:00:00
Poll frequency 15 seconds
Last Failover at: 08:34:03 EST Mon Apr 23 2007
This host: Primary - Active
Active time: 7319775 (sec)
On the Syslog server, you perform a search for the terms Primary and Secondary in the message text around that time frame. You are looking for any failover messages that might have been sent by the primary or secondary firewall units. Here are the results of the search:
Apr 23 2007 8:34AM Firewall LOCAL4 ALERT %ASA-1-104001: (Primary) Switching to
ACTIVE - mate want me Active.
Apr 23 2007 8:34AM Firewall LOCAL4 ALERT %ASA-1-105003: (Primary) Monitoring on
interface 3 waiting
Apr 23 2007 8:34AM Firewall LOCAL4 ALERT %ASA-1-105003: (Primary) Monitoring on
interface 0 waiting
Apr 23 2007 8:34AM Firewall LOCAL4 ALERT %ASA-1-105004: (Primary) Monitoring on
interface 3 normal
Apr 23 2007 8:34AM Firewall LOCAL4 ALERT %ASA-1-105004: (Primary) Monitoring on
interface 0 normal
Apr 23 2007 9:09AM Firewall LOCAL4 ALERT %ASA-1-105008: (Primary) Testing
Interface 2
Apr 23 2007 9:09AM Firewall LOCAL4 ALERT %ASA-1-105009: (Primary) Testing on
interface 2 Passed
Apr 23 2007 9:09AM Firewall LOCAL4 ALERT %ASA-1-105008: (Primary) Testing
Interface 2
Apr 23 2007 9:09AM Firewall LOCAL4 ALERT %ASA-1-105009: (Primary) Testing on
interface 2 Passed
Apr 23 2007 9:10AM Firewall LOCAL4 ALERT %ASA-1-105008: (Primary) Testing
Interface 2
Apr 23 2007 9:10AM Firewall LOCAL4 ALERT %ASA-1-105009: (Primary) Testing on
interface 2 Passed
Apr 23 2007 9:10AM Firewall LOCAL4 ALERT %ASA-1-105008: (Primary) Testing
Interface 2
Apr 23 2007 9:10AM Firewall LOCAL4 ALERT %ASA-1-105009: (Primary) Testing on
interface 2 Passed
Apr 23 2007 9:10AM Firewall LOCAL4 ALERT %ASA-1-105004: (Primary) Monitoring on
interface 2 normal
From this record, it is evident that something began to happen at 8:34 a.m. on April 23. The primary unit reports that the other unit (“mate”) has decided that it should assume the active role. Obviously, before this time, the primary unit had been in the standby role.
When the primary unit becomes active, it begins to monitor on several interfaces, determining if the interfaces are working properly and if it can detect the other unit on them too. Notice that at 9:09 a.m., it begins several testing phases on interface 2. Evidently, interface 2 (missing from the earlier monitor tests) had a problem from 8:34 until 9:09.
You still do not know what triggered the failover, because you have a record only from the unit that had just become active at that time. That also means that the other unit, which had been active before the failover, was generating other Syslog messages before the failover. However, the failover caused it to enter the standby mode, so no further Syslog information was sent to the server.
As a last step, you connect to that unit (currently in standby mode) and have a look at its logging buffer:
Firewall# show logging
Syslog logging: enabled
Facility: 20
Timestamp logging: disabled
Standby logging: disabled
Console logging: disabled
Monitor logging: disabled
Buffer logging: level warnings, 553574 messages logged
Trap logging: level warnings, 553574 messages logged
Logging to inside 192.168.100.100
History logging: disabled
Device ID: disabled
305006: Dst IP is network/broadcast IP, translation creation failed for icmp src
outside:64.170.37.34 dst inside:169.163.69.0 (type 8, code 0)
305006: Dst IP is network/broadcast IP, translation creation failed for icmp src
outside:64.170.37.34 dst inside:169.163.69.0 (type 8, code 0)
500004: Invalid transport field for protocol=17, from 172.21.68.65/47808 to
1.0.0.0/0
[output deleted]
411002: Line protocol on Interface outside, changed state to down
105007: (Secondary) Link status 'Down' on interface 2
104002: (Secondary) Switching to STNDBY - interface check, mate is healthier
105003: (Secondary) Monitoring on interface 3 waiting
105003: (Secondary) Monitoring on interface 0 waiting
105004: (Secondary) Monitoring on interface 3 normal
105004: (Secondary) Monitoring on interface 0 normal
105006: (Secondary) Link status 'Up' on interface 2
105003: (Secondary) Monitoring on interface 2 waiting
105004: (Secondary) Monitoring on interface 2 normal
Firewall#
Aha! The buffered record shows that the “outside” interface went down, triggering the failover. This unit decided that because its own interface went down hard, it should immediately relinquish the active role.
Unfortunately, logging time stamps were not configured, so the firewall did not add any date and time information to the messages in its own buffer. (This is true only for ASA or FWSM; PIX and early FWSM releases do not add time stamps to buffered logging messages.) This does not really matter, because these are the final recorded messages and must have occurred right before the last time the unit entered the standby role.
Intervening in a Failover Election
Cisco firewalls do not toggle their roles as failures come and go. For example, if an active unit fails, it automatically enters the standby role. Even if its failure is cured, it does not resume its former active role.
The idea is that after a failure has taken place, a network administrator needs to diagnose the problem and fix it. After a failed firewall unit is repaired, you have to manually inform the pair that they need to reset the failed condition in their failover status. When a problem is resolved on a failed standby unit, you can use the failover reset command on the active unit. Both units recognize that the standby unit has become “unfailed” and resume normal failover communication.
Sometimes you might need to manually toggle the roles. This might be necessary if you need to perform some maintenance on one unit, but it is unfortunately already in the active role. You can approach this in two ways:
• Use the no failover active command on the active unit. It immediately relinquishes the active role to its failover peer.
• Use the failover active command on the standby unit to force it to immediately assume the active role.
Checking Firewall Interfaces
You can use the show traffic command to see throughput information about firewall interfaces, but you can monitor other interface statistics as well. You can use the show interface command to see a wealth of information about the interface operation, many types of error conditions, and packet buffering.
As with the Cisco IOS Software, the show interface command can produce such a condensed dump of interface parameters that it becomes difficult to interpret. To make this easier, think of the command output as being broken into various sections.
Figure 11-3 shows an example of the show interface command on an ASA platform. Other software releases show similar information but are organized slightly differently. Only the “outside” interface is shown, for clarity. If you just glance through the lines of output looking for any glaring error condition you are unlikely to find anything but a collection of numbers.
Figure 11-3 A Breakdown of Information Presented by the show interface Command
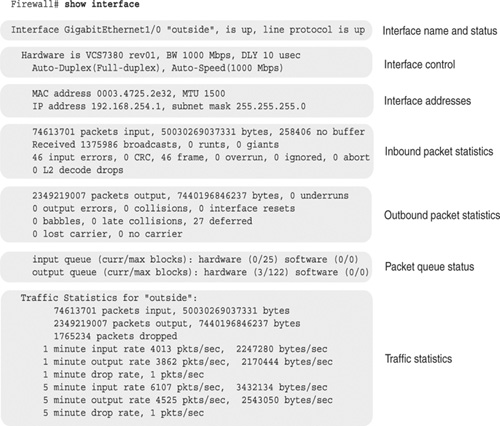
As the figure shows, the lines of output are organized into groups of related information. Each of these groups is explained in detail in the following sections to correspond with the figure. The parameters in each group appear in table format for quick reference. The sample values in Figure 11-3 are shown, along with an explanation of the parameter.
Interface Name and Status
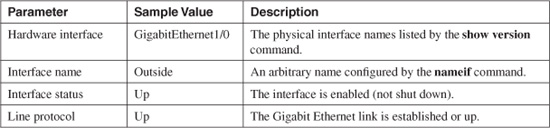
Table 11-3 describes the interface name and status information displayed by the show interface command as depicted in Figure 11-3.
Table 11-3 show interface Command Output: Interface Name and Status Information
Interface Control
Table 11-4 describes the interface control information displayed by the show interface command as depicted in Figure 11-3.
Table 11-4 show interface Command Output: Interface Control Information
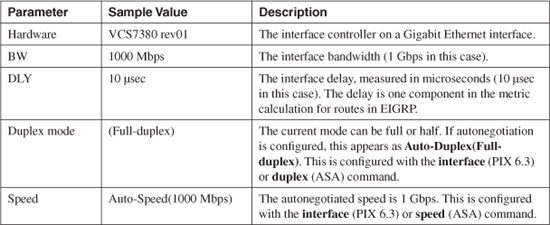
The interface bandwidth or speed shown should match that of the network device on the other end of the connection.
However, be aware of problems caused by duplex mode configuration. Duplex mode must be configured identically on the firewall and the network device to which it connects. Duplex mode can be autonegotiated only if the other end of the connection is also set to autonegotiate. Otherwise, autonegotiation is unable to “sense” what mode the other side is using, and duplex mode defaults to half-duplex.
Tip
You can use the interface information to troubleshoot duplex mismatch problems. First, look at the duplex setting that is reported. If the interface is set to Auto-duplex and the actual mode is half-duplex, most likely the far end of the connection is not configured for autonegotiation. The firewall then attempts to negotiate duplex mode and falls back to half-duplex as a default.
In addition, nonzero values for collisions, late collisions, and output errors can also indicate a duplex mismatch. If one end is using full-duplex mode and the other end half-duplex mode, there is a good chance that the two devices will attempt to transmit at the same time and cause a frame collision. The resulting data becomes scrambled and appears as an output error.
Best practice is to hard-code or configure specific interface speed and duplex settings to avoid any problems with misconfiguration or autonegotiation.
Interface Addresses
Table 11-5 describes the interface address information displayed by the show interface command as depicted in Figure 11-3.
Table 11-5 show interface Command Output: Interface Address Information
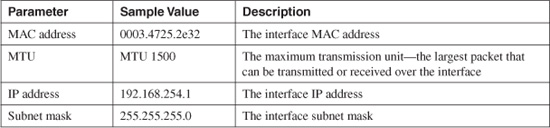
The MAC address shown is the burned-in address (BIA) that is preprogrammed on the interface. If failover is enabled, the MAC address changes according to the firewall’s failover role. The active unit always takes on the MAC address of the primary unit’s interface BIA. The standby unit always takes on the MAC address defined for the secondary unit. You can also configure both units to have specific MAC addresses with the failover mac address command.
The IP address shown is the address configured for the interface. If failover is enabled, the active unit takes on the IP address configured for the primary unit’s interface. The standby unit takes on the IP address configured for the secondary unit’s interface.
The MTU value shown defaults to 1500 bytes for Ethernet interfaces and can be configured with the mtu command. In ASA, the interface MTU is shown as MTU not set if the interface is shut down or if it has not been configured with a logical name with the nameif command.
Inbound Packet Statistics
Table 11-6 describes the packet statistics information displayed by the show interface command as depicted in Figure 11-3.
Each of these counters is accumulated from the time the firewall was booted or from the time the interface counter was last cleared with the clear interface [if_name] [stats] command.
Table 11-6 show interface Command Output: Inbound Packet Statistics
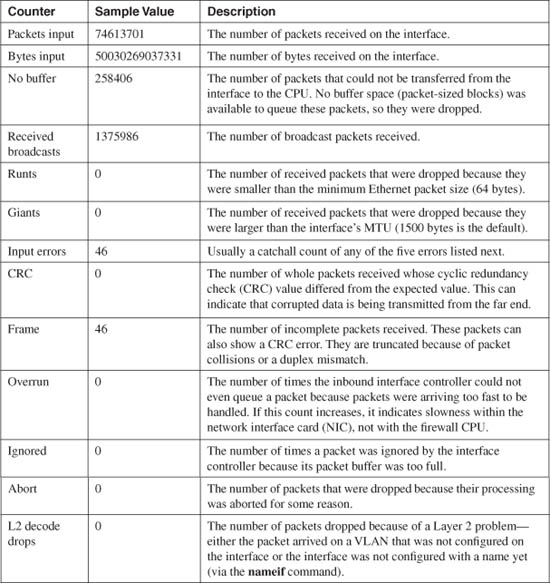
The overrun, ignored, and abort input errors are traditional values that have been carried over from Cisco IOS Software on routers. You typically do not see these error counts increase because of the firewall queuing strategy. This is described further in the “Packet Queue Status” section a bit later.
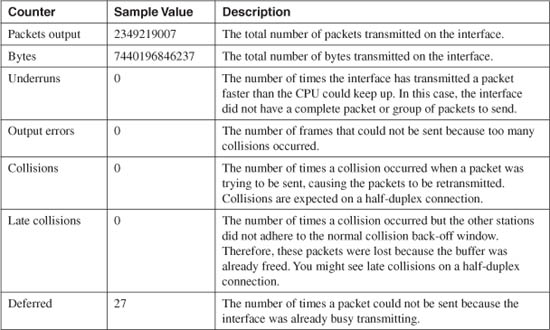
Outbound Packet Statistics
Table 11-7 describes the outbound packet statistical information displayed by the show interface command as depicted in Figure 11-3.
Each of these outbound counters is accumulated from the time the firewall was booted or from the time the interface counter was last cleared with the clear interface [if_name] [stats] command.
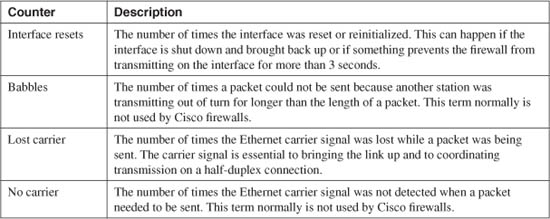
Table 11-7 show interface Command Output: Outbound Packet Statistics
You might also see the counters listed in Table 11-8 displayed, depending on the firewall platform and the type of connection.
Table 11-8 show interface Command Output: Additional Interface Statistics
In ASA or FWSM multiple-context security mode, the show interface command presents a shortened amount of information when it is used from a user context. For example, the following output was produced from the admin context:
Firewall/admin# show interface outside
Interface Ethernet0 "outside", is up, line protocol is up
MAC address 00a0.c900.0101, MTU 1500
IP address 192.168.93.138, subnet mask 255.255.255.128
Received 7299 packets, 787753 bytes
Transmitted 7398 packets, 790589 bytes
Dropped 0 packets
Firewall/admin#
Notice that user context interfaces are known only by their logical names (outside, for example). As well, only the addressing and data counter information is shown. The interface error counters are reserved for the system execution space, where the actual physical interfaces are configured.
When an interface is configured as a VLAN trunk, you might see some additional information from the show interface command. For example, the following information might be shown:
Received 214095 VLAN untagged packets, 174551017 bytes
Transmitted 103055 VLAN untagged packets, 10106195 bytes
Dropped 1456 VLAN untagged packets
Here, VLAN untagged packets represents packets that are sent or received over the native (untagged) VLAN on the 802.1Q trunk.
PIX 6.3 can produce the following output for a trunk interface, including a breakdown of traffic activity on specific VLANs:
279 aggregate VLAN packets input, 110463 bytes
87 aggregate VLAN packets output, 6412 bytes
8 vlan41 packets input, 540 bytes
0 vlan41 packets output, 0 bytes
0 invalid VLAN ID errors, 6 native VLAN errors
On ASA and FWSM platforms, if an interface is not completely configured, you might see some additional information. If the nameif command has not yet been used to assign a logical name to an interface, the following line is shown from the show interface command:
Available but not configured via nameif
Finally, in multiple-context security mode, physical interfaces must be mapped from the system execution space to the appropriate user contexts. If an interface has not been mapped with the allocate-interface context configuration command, the following line is shown:
Available for allocation to a context
Traffic Statistics
Beginning in ASA 7.2(1), the show interface command displays traffic statistics based on input and output activity, in addition to the interface counters. The bottom of Figure 11-3 demonstrated this information earlier; however, the example that follows also shows this information:
Traffic Statistics for "outside":
74613701 packets input, 50030269037331 bytes
2349219007 packets output, 7440196846237 bytes
1765234 packets dropped
1 minute input rate 4013 pkts/sec, 2247280 bytes/sec
1 minute output rate 3862 pkts/sec, 2170444 bytes/sec
1 minute drop rate, 31 pkts/sec
5 minute input rate 6107 pkts/sec, 3432134 bytes/sec
5 minute output rate 4525 pkts/sec, 2543050 bytes/sec
5 minute drop rate, 17 pkts/sec
The traffic statistics are first shown as cumulative totals, in bytes and packets. The input, output, and drop rates are shown in bytes per second or packets per second.
Packet Queue Status
A Cisco firewall uses several different buffers or queues as it handles packets in a network. To monitor a firewall’s performance, it is a good idea to become familiar with the buffering process and statistics.
Figure 11-4 illustrates how packets arriving on an interface are queued for inspection and how other inspected packets are queued for transmission on the interface.
Figure 11-4 Firewall Interface Packet Queues
Each firewall interface has its own inbound and outbound queues, arranged as a hardware queue and a software queue in each direction. In ASA platforms, the outbound software queue is known as the best-effort queue (BEQ). Each interface also has an outbound priority queue, the low-latency queue (LLQ), that can be used to forward high-priority traffic. The LLQ is always serviced before the BEQ.
Basically, incoming packets arrive from the physical interface and go into a hardware interface queue (if one is present) on the firewall platform. If that queue overflows before packets can be emptied for inspection, new packets are pushed into the input software queue.
In the outbound direction, the process is similar but reversed. As packets are inspected and approved for forwarding, they are moved into an output queue. In PIX 6.3 and earlier, packets were copied right into the output hardware queue if there was room. If not, they went into the output software queue. All packet delivery was done on a best-effort basis, with no quality of service possible.
On ASA platforms, outbound packets can be moved into an output BEQ or an output LLQ, depending on the results of a service policy. If priority queuing is enabled, packets are always pulled from the LLQ before the BEQ is serviced. If priority queuing is not enabled, all outbound packets go into the BEQ.
Hardware and software queue statistics are reported through the show interface command, as in the following example from the “Packet Queue Status” section of Figure 11-3:
input queue (curr/max blocks): hardware (0/25) software (0/0)
output queue (curr/max blocks): hardware (3/122) software (0/0)
Each firewall interface has both input and output queues; the current state of the queues is displayed as a ratio of current/maximum blocks used. Table 11-9 lists the values reported in the preceding command output and describes each value.
Table 11-9 show interface Command Output: Packet Queue Status Information
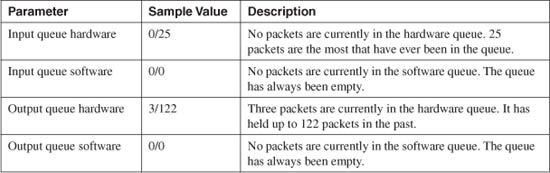
It is common to see the hardware queue (either input or output) reported to have activity. You should see a nonzero number for the maximum queue level when the hardware queue has been used. However, you should see nonzero values for the software queue only when the hardware queue has been full sometime in the past. This is not necessarily a bad thing.
If you see large values reported for a software queue, and the current number consistently stays close to the maximum number, your firewall CPU is having trouble keeping up with the interface load.
Tip
Fast Ethernet firewall interfaces (10/100) always report an inbound hardware queue statistic of 128/128. As well, you always see some inbound software queue activity. This indicates that this type of interface does not use a hardware queue. Instead, all inbound packets are copied into the software queue directly.
This is not true for the Fast Ethernet outbound queues, which use both hardware and software queues.
Outbound priority queues are available only beginning with ASA software release 7.0(1). The show interface command does not report on the outbound priority queue. Instead, you can use the following command to view output queue statistics:
Firewall# show priority-queue statistics [if_name]
This command displays the current statistics about both the priority queue (LLQ) and the best-effort queue (BEQ) of a firewall interface. These are shown as the queue type in the command output. If no interface name is given, all interfaces are shown.
For example, the following statistics resulted from a firewall’s outside interface:
Firewall# show priority-queue statistics outside
Priority-Queue Statistics interface outside
Queue Type = BE
Packets Dropped = 0
Packets Transmit = 132213
Packets Enqueued = 0
Current Q Length = 0
Max Q Length = 0
Queue Type = LLQ
Packets Dropped = 0
Packets Transmit = 1826
Packets Enqueued = 5
Current Q Length = 0
Max Q Length = 32
Firewall#
Table 11-10 lists the fields displayed in the command output. The descriptions pertain to the priority queue.
Table 11-10 show priority-queue statistics Command Output: Packet Queue Status Information
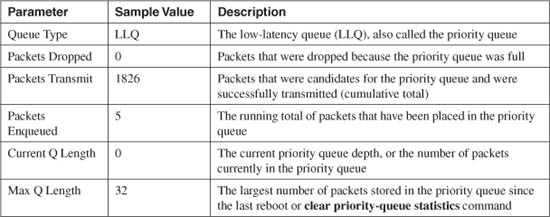
Sometimes you might see a larger number in the Packets Transmit counter than the Packets Enqueued counter. That might seem odd, because outbound priority packets should be put into the LLQ before being transmitted. The difference is that some firewall platforms can write priority packets into the output hardware queue directly, so they do not actually pass through the LLQ first.
11-2 Watching Data Pass Through a Firewall
Sometimes you might want to know what sort of traffic has passed through a firewall to reach a certain host. At other times, you might need to troubleshoot why traffic is not being forwarded through the firewall. In this case, you would want to verify that packets arrived on one firewall interface but did not go out another interface.
You can use two methods to watch or verify that packets have passed through a firewall:
• Capture session—Packets passing through an interface and matching given conditions are captured in a buffer and can be displayed later.
• Debug packet—Packets matching conditions defined in a debug command are reported as they pass through the firewall.
Note
Beginning with ASA 7.0(1), the debug packet method is no longer supported.
These methods require different configuration steps, and each affects the firewall resources in different ways. Table 11-11 compares the capture and debug packet methods.
Table 11-11 Verifying That Packets Have Passed Through a Firewall: Capture Session Versus Debug Packet
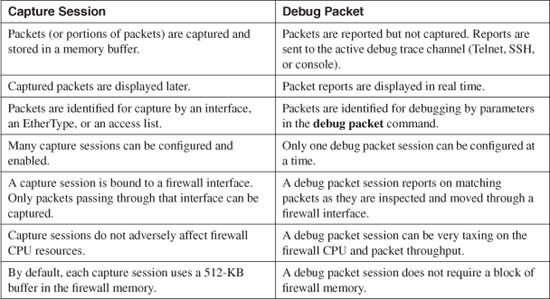
Using Capture
You can define one or more capture sessions on a firewall, each operating independently. Captured packets are stored in a memory buffer and can be viewed much like a protocol analyzer or sniffer trace.
Defining a Capture Session
Two basic steps are involved in defining a capture session:
1. Configure an access list to identify the interesting traffic for capture.
2. Define the actual capture session.
An access list is used to pick out specific traffic passing through a firewall interface. You can set up a capture session that does not use an access list at all, but it then captures all traffic passing through.
You can configure the access list by entering one or more access control entry (ACE) statements with the following configuration command:
Firewall(config)# access-list acl_id [line line-num] [extended] permit protocol
{source_addr source_mask [operator sport] [destination_addr destination_mask
[operator dport]]
The access list is used to flag packets for capture—not to permit or deny them from passing through the interface. Therefore, only the permit keyword is useful here. An implicit deny statement is at the end of the access list, which causes all other traffic to pass without being captured.
The matched protocol can be ip (any IP protocol), tcp (6), udp (17), ah (51), eigrp (88), esp or ipsec (50), gre or pptp (47), igmp (2), igrp (9), ipinip (4), nos (94), ospf (89), pcp (108), pim (103), snp (109), icmp (1), icmp6 (58), or a number from 1 to 255.
Source and destination addresses can be explicit IP addresses or subnets, and the masks are regular subnet masks. If you need to specify addresses, be sure the addresses are relevant with respect to NAT. A capture session can monitor inbound traffic on an interface before NAT is performed, and it can monitor outbound traffic after NAT is performed.
If you need to match against a source or destination port number, you can add an optional operator: lt (less than), gt (greater than), eq (equal to), neq (not equal to), or range (lies between two port limits). The operator compares the port number to the value given by port (a single decimal number; for a range, give two numbers for lower and upper limits).
Tip
You might find it handy to include something like cap in the access list name, as in acl_cap_testprobe. This way, you can guess that the ACL has a special purpose just by looking at its name.
To define and start a capture session on a firewall interface, you can use the following privileged EXEC command:
Firewall# capture capture_name [access-list acl_name] [ethernet-type type]
[interface if-name] [buffer bytes] [circular-buffer] [packet-length bytes]
The capture session is named capture_name (an arbitrary text string). The access list named acl_name is used to identify packets to be captured. If an access list is not used or defined, all IP packets are matched. However, you should use an access list to specifically match traffic with respect to NAT.
You can define the protocol to capture in the access list. You can also specify an Ethernet type code in the capture command instead if you need to capture a protocol that the ACL does not support. By default, all Ethernet types are flagged for capture. You can specify one as type using one of these values: arp (ARP requests and replies), ip (TCP/IP), pppoe (PPP over Ethernet), pppoed (PPP over Ethernet Discovery), ip6 (IP version 6), ipx (Novell IPX), or rarp (Reverse ARP).
You should specify which interface the capture session will monitor with the interface keyword and the interface if-name (defined with the nameif command).
Tip
On a FWSM platform, the capture feature is somewhat broken until release 3.2. You can define a capture session and apply it to a VLAN interface, but the FWSM captures only packets coming into the interface—outbound packets are not captured at all.
You can also use an external protocol analyzer or “sniffer” to capture all traffic going to and from a FWSM interface. A VLAN ACL (VACL) capture is used on the Catalyst 6500 to intercept packets as they pass between the switch backplane to the FWSM. See the section “Capturing FWSM Packets Inside the Switch” in this chapter for more information.
You can also make adjustments to the capture buffer. By default, the capture session buffer is 512 KB in the main firewall memory. With the buffer keyword, the buffer can be resized to bytes. By default, the capture session stops when the buffer is full. However, you can use the circular-buffer keyword to allow the capture to work continuously; when the buffer fills, the capture stores the next packet at the beginning of the buffer.
By default, up to 68 bytes of each captured packet are stored in the buffer. You can change this limit with the packet-length keyword to bytes (up to the MTU or maximum packet size). The default value gives enough information to include the IP and upper-layer protocol headers. Be aware that if you increase the packet length, you can view the contents of captured packets, including any cleartext user IDs, passwords, or other confidential information.
Beginning with ASA 7.0(1), you can add the type keyword to specify a type of data to capture. The following command syntax is used:
Firewall# capture capture_name type {raw-data | isakmp | asp-drop drop-reason}
[buffer bytes] [circular-buffer] [packet-length bytes]
The raw-data type is used in capture sessions by default, even when the type keyword is unavailable. In other words, raw IP packets can be captured. You can also capture certain VPN traffic by specifying type isakmp.
Another novel feature involves capturing packets that are dropped rather than forwarded through the firewall. This allows you to analyze the contents of dropped packets so that you can see exactly why the packet was dropped. No other capture filtering by access list or interface is necessary, because packets can be dropped for a wide variety of reasons.
You can use the type asp-drop keywords along with one of the drop-reason keywords listed in Table 11-12.
Table 11-12 drop-reason Keywords for the capture type asp-drop Command

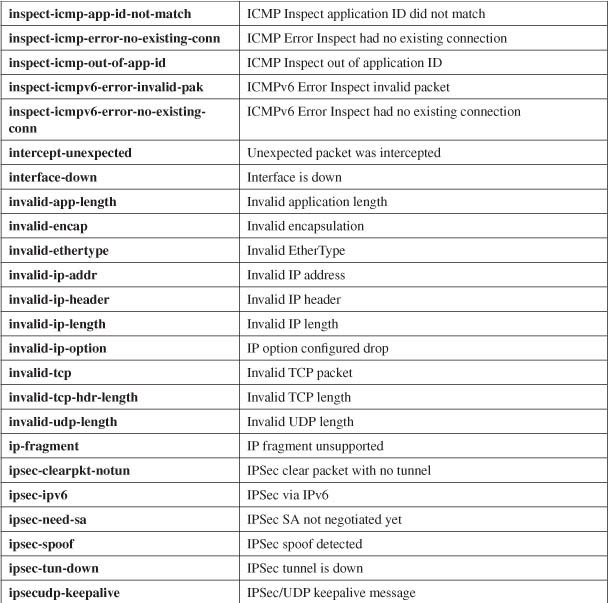
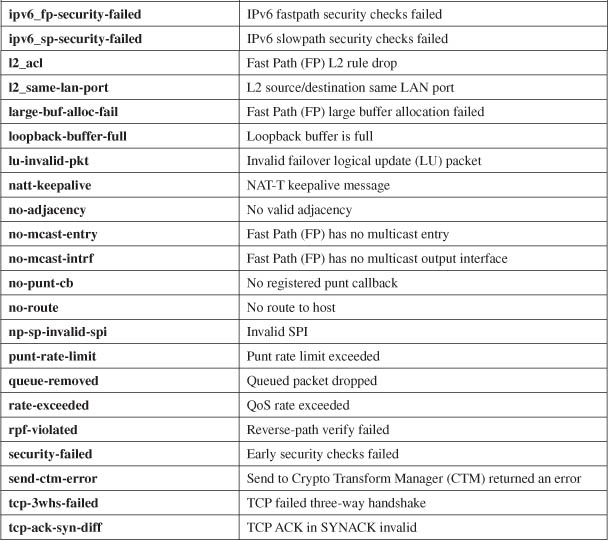

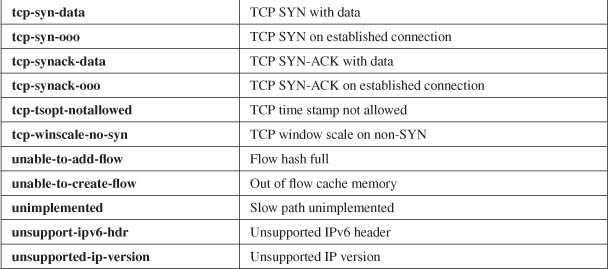
As a simple example, the following capture session is created to capture all packets that have been dropped by an interface access list:
Firewall# capture ACLdroptest type asp-drop acl-drop
An inbound SMTP session is attempted from an outside host, which is blocked by an access list applied to the outside interface. First, the following Syslog messages were collected for the failed session:
Feb 08 2007 00:25:41 single_vf : %PIX-4-106023: Deny tcp src
outside:172.21.4.48/3407 dst inside:172.16.1.5/25 by access-group "acl_outside"
Feb 08 2007 00:25:44 single_vf : %PIX-4-106023: Deny tcp src
outside:172.21.4.48/3407 dst inside: 172.16.1.5/25 by access-group "acl_outside"
Feb 08 2007 00:25:50 single_vf : %PIX-4-106023: Deny tcp src
outside:172.21.4.48/3407 dst inside: 172.16.1.5/25 by access-group "acl_outside"
The denied packets can be correlated to the following packets in the capture session:
Firewall# show capture test
3 packets captured
1: 00:25:41.114312 172.21.4.48.3407 > 172.16.1.5.25: S 3520305660:3520305660(0)
win 65520 <mss 1260,nop,nop,sackOK>
2: 00:25:44.026197 172.21.4.48.3407 > 172.16.1.5.25: S 3520305660:3520305660(0)
win 65520 <mss 1260,nop,nop,sackOK>
3: 00:25:50.122659 172.21.4.48.3407 > 172.16.1.5.25: S 3520305660:3520305660(0)
win 65520 <mss 1260,nop,nop,sackOK>
3 packets shown
Firewall#
Tip
You can repeat these steps to define several capture sessions. You can assign multiple capture sessions to the same interface. You also can reuse an ACL in multiple capture sessions if needed. Each capture session is independent and captures its own data in a separate capture buffer.
You can use multiple capture sessions to troubleshoot difficult problems in which the firewall is not forwarding traffic for some reason. Configure one capture session on one interface and a similar capture session on another interface. Use the same access list in both capture sessions. Then you can see traffic arriving on one interface but not appearing on the other.
Aside from the normal traffic inspection engines, access lists, and service policies that might be dropping the packets, consider other information contained in the capture buffer. Be sure to look for packet-related parameters such as the do not fragment (DF) bit or the TCP maximum segment size (MSS) that could be causing packets to be silently dropped.
Getting Results from a Capture Session
After you have defined a capture session, you need to monitor it for activity and retrieve the captured data. If you have defined several capture sessions, you might have trouble remembering which one is performing a certain function. You can list the current capture sessions with the following command:
Firewall# show capture
For example, the firewall used in the following show capture output has three capture sessions defined:
Firewall# show capture
capture Aserver-out access-list interface outside
capture Aserver-in access-list interface inside
capture A-trunk interface outside
Notice that one session is bound to the inside interface, and two other separate sessions are active on the outside interface.
You can display the contents of a capture session buffer at any time, even if the capture is still active. To view the buffer contents from a console, Telnet, or SSH session, you can use the following command:
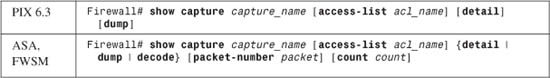
A summary of each packet saved in the capture buffer named capture_name is displayed, even though the capture session is still active. You can also configure another access list named acl_name ahead of time and use that ACL as a display filter. Only packets that are permitted by the display filter access list are displayed.
With ASA and FWSM platforms, you can use the decode keyword to display captured packets in an abbreviated form. This is the default display format. You can also display a subset of captured packets. You can use the packet-number keyword to specify packet number packet as the first to display. You can also use the count keyword to set the number of packets to display as count.
For example, you could use the following command to display packets 100 through 157 in the capture buffer:
Firewall# show capture test packet-number 100 count 57
The top portion of Figure 11-5 shows an example of a TCP packet displayed from the capture session named “test.” Only the basic IP and TCP information is shown. This format is useful if you are looking at a list of packets as a record of traffic flow.
To see more detail about the captured packets, you can add the detail keyword to the show capture command. The same sample packet is shown in the middle of Figure 11-5. Here, the source and destination MAC addresses are shown along with the IP addresses. Many IP and TCP fields contained in the packet are also shown.
Until this point, only the packet header information has been displayed. You can also see the contents of the packet payload (up to packet-length bytes, as given in the capture command) by using the dump keyword. The bottom portion of Figure 11-5 shows the sample packet in the dump format. The captured IP packet contents are shown as a hexadecimal decode, along with the ASCII equivalent of each byte.
Figure 11-5 Examples of Different show capture Output Formats

Using a Capture Session to Display Trunk Contents
You can also use a capture session to capture and decode packets traveling over a trunking interface. In the following example, interface ethernet0 is configured as an 802.1Q trunk, passing VLANs 41 (interface dmz3) and 998 (interface outside). A capture session named “trunk-test” is enabled on the outside interface, with no access list as a filter:
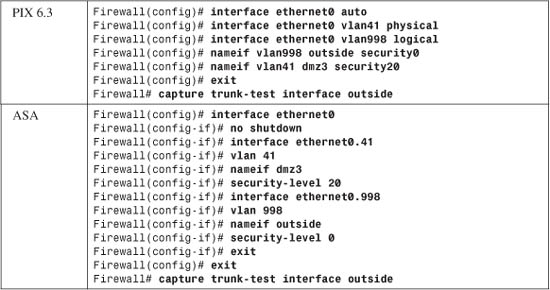
When the capture buffer is displayed, notice how each packet is shown along with its 802.1Q VLAN number tag:
Firewall# show capture trunk-test
4434 packets captured
00:52:55.034116 802.1Q vlan#998 P0 arp reply 172.16.89.191 is-at 0:d:28:a7:83:80
(0:d:28:a7:83:80)
00:52:55.034589 802.1Q vlan#998 P0 arp reply 172.16.89.191 is-at 0:c:30:10:26:0
(0:c:30:10:26:0)
00:52:55.860902 802.1Q vlan#998 P0 arp who-has 172.16.89.253 tell 128.163.89.11
00:52:55.860978 802.1Q vlan#998 P0 arp who-has 172.16.89.254 tell 128.163.89.11
00:53:01.841844 802.1Q vlan#998 P0 172.21.4.6.3862 > 172.16.89.161.23: S
2411823264:2411823264(0) win 65520 <mss 1260,nop,nop,sackOK>
[output deleted]
Some firewall documentation explains that you should configure the capture session to collect only VLAN or 802.1Q EtherTypes by adding the vlan or 802.1q keywords, respectively. As of PIX 6.3(3), this is not necessary. The firewall interprets the 802.1Q encapsulation correctly with a normal capture session definition.
Copying Capture Buffer Contents
Sometimes you might find that viewing the contents of a capture buffer from a command-line interface (CLI) becomes too cumbersome or confusing. This can happen when the capture buffer becomes very large—too large to navigate with CLI commands or display filters.
At other times, the capture buffer might contain useful information that deserves further review. For example, you might have a PC-based tool that can import captured data for viewing and analysis. You also might want to archive the capture buffer for future use. You can extract a capture buffer from a firewall in several ways, as discussed in the following sections.
Copying to an External TFTP Server
You can copy a capture session to a Trivial File Transfer Protocol (TFTP) server with the following command:
Firewall# copy capture:capture-name tftp://server/path [pcap]
The entire buffer from the capture session named capture-name is copied to the TFTP server at IP address server into the file and directory defined by path, which is relative to the TFTP server’s root directory.
In the following, the capture session named bigtest is copied to the TFTP server at 192.168.254.10 as file bigtest in the TFTP root directory:
Firewall# copy capture:bigtest tftp://192.168.254.10/bigtest
The resulting capture file contains the same text that is seen with the show capture command. You can also save the capture buffer in the PCAP format, which can be imported into many network analysis tools. To do this, add the pcap keyword.
Tip
The PCAP capture file format is used by the tcpdump analysis utility. It can be imported directly into the Wireshark (formerly Ethereal) network analysis application. It can also be converted and imported into other commercial network analysis tools. You can go to http://www.tcpdump.org for more information about tcpdump and PCAP. See http://www.wireshark.org (formerly http://www.ethereal.com) for more about the Wireshark application.
Copying the Capture Buffer to a Web Browser
From a web browser, you can display a capture buffer as if you had used the show capture command. You also can download the capture buffer in PCAP format and save it as a file—all without leaving your web browser and without needing a TFTP server running on your PC. Follow these steps to accomplish this:
1. Enable the HTTP server on the firewall:
Firewall(config)# http ip-address subnet-mask interface
Firewall(config)# http enable
The firewall’s HTTP server allows connections from the ip-address and subnet-mask locations, originating on the firewall interface named interface. Usually, it is best to enable HTTP access only on a secure or trusted interface.
2. Open a web browser to this URL:
https://firewall_address/capture/capture_name[/pcap]
The capture web page is found at the firewall interface given by IP address firewall-address. The capture session named capture_name is downloaded to the browser window, as if you had used the show capture firewall command. As soon as the text is displayed, you can save it in a file through your browser application.
Figure 11-6 shows the capture session named Aserver-in from the firewall at 192.168.254.1 displayed in a browser window.
Figure 11-6 Displaying a Capture Buffer in a Web Browser
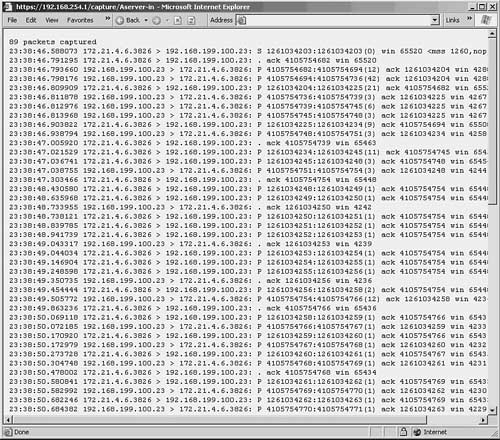
You can also use the web browser to download the capture buffer as a file in PCAP format. To do this, add the /pcap keyword to the end of the URL. This time, the browser automatically fetches the capture file rather than displaying the capture text. Figure 11-7 shows an example of saving the capture session named icmp from the firewall at 192.168.254.1 to the local machine. Notice that the browser saves the capture data to a file called pcap by default. You can change the filename and location through the web browser’s file download dialog box.
As soon as you have the capture file downloaded in PCAP format, you can use a network analysis tool to examine and interpret the contents. For example, Wireshark is a free network protocol analyzer (http://www.wireshark.org) that can import PCAP files directly. Figure 11-8 shows how Wireshark (Ethereal) has been used to open the sample Aserver-in capture file.
Likewise, you can use other commercial protocol analyzers as long as they can convert or import the PCAP file format. Figures 11-9 and 11-10 show how the OmniPeek protocol analyzer (http://www.wildpackets.com) can be used to convert and import the capture file. Notice that the ProConvert tool is used first to convert the PCAP (tcpdump) file into OmniPeek or EtherPeek format.
Figure 11-7 Downloading a Capture Buffer Through a Web Browser
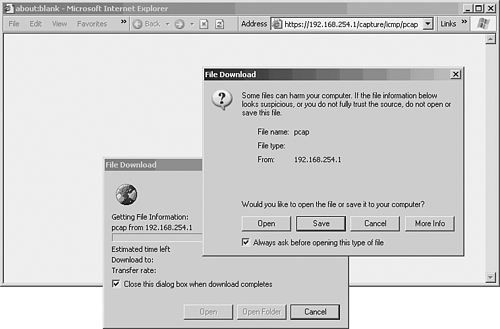
Figure 11-8 A Sample Capture Buffer Opened in Wireshark
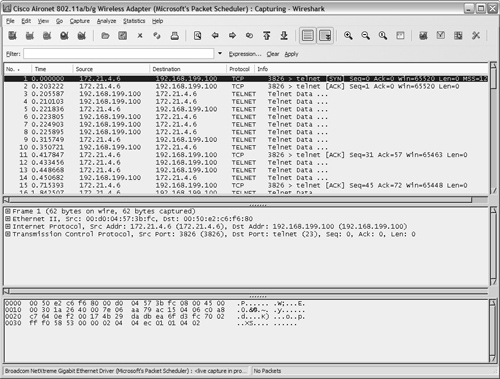
Figure 11-9 Using the WildPackets ProConvert Capture Conversion Utility
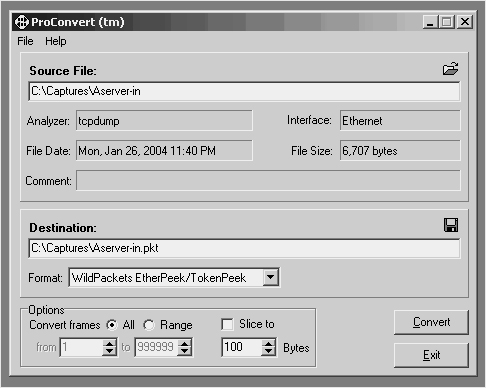
Figure 11-10 A Sample Capture Buffer Opened in OmniPeek
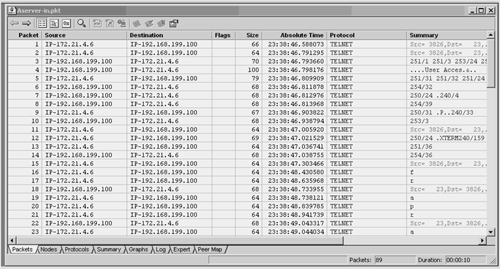
Controlling a Capture Session
After a capture session is defined and activated, you might need to stop it as soon as some interesting data is captured. You might also want to clear the buffer so that new data can be captured in an empty buffer. When you are finished with a capture session, you need to delete it.
You can use the following commands (Table 11-13) to control an existing capture session:
Table 11-13 Commands to Control a Data Capture Session
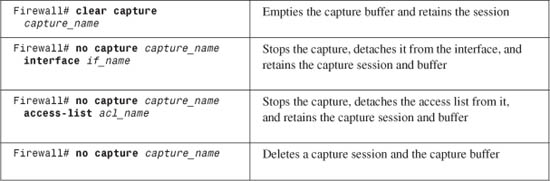
A Capture Example
A firewall separates a web server on the inside from a user on the outside. The web server has worked correctly in the past, but users are calling to complain that they cannot get the server to respond with valid browser content. Naturally, the user believes the firewall is to blame!
You find that you can ping both the user and the web server from the firewall. As well, the outside user can ping the web server through the firewall. After inspecting the firewall configuration, you also find that the address translation and access list definitions look correct. You also spend some time searching the Syslog archives for any messages that might indicate that the firewall is somehow blocking the HTTP connections. Unfortunately, you do not see anything interesting.
The capture feature can provide some low-level data about this problem. Because you can configure multiple capture sessions, it is wise to capture this traffic flow on both the outside and inside interfaces. If you can see what packets have arrived on both sides of the firewall, you are more likely to see the traffic from the firewall’s perspective.
First, you configure two access lists—one for each firewall interface, configured to permit traffic between the user’s PC and the web server. These access lists will trigger the capture for packets that match the permit statements.
Figure 11-11 shows a simple network diagram of this scenario. The web server is at 172.19.32.9 (the local address) on the inside, and it has a static translation to 10.4.4.10 (the global address) on the outside. The user PC is at 10.4.4.33 on the outside.
You define the following access lists:
Firewall(config)# access-list cap_outside permit ip any host 10.4.4.10
Firewall(config)# access-list cap_outside permit ip host 10.4.4.10 any
Firewall(config)# access-list cap_inside permit ip any host 172.19.32.9
Firewall(config)# access-list cap_inside permit ip host 172.19.32.9 any
Figure 11-11 A Network Diagram for the Capture Example
Next, you define and enable the two capture sessions:
Firewall# capture web_inside access-list cap_inside interface inside
Firewall# capture web_outside access-list cap_outside interface outside
Now you instruct the user to try opening a web browser to the web server’s URL. As soon as that happens, you can display the contents of both capture buffers as follows:
Firewall# show capture web_outside
2 packets captured
19:24:27.241885 10.4.4.33.1193 > 10.4.4.10.80: S 3375443541:3375443541(0) win 4096
<mss 1460>
19:24:27.242403 10.4.4.10.80 > 10.4.4.33.1193: R 917139784:917139784(0) ack
3375443542 win 0
Here, only two packets are seen at the firewall’s outside interface:
• A packet from the user’s PC to the web server (TCP port 80) with the TCP SYN flag set (S).
• A reply from the web server address to the user’s PC.
Why are there only two packets when there should be at least a three-way TCP handshake? A clue is present, because the return packet has the TCP RST flag set (R). Something has caused the connection to be reset before it has been established.
A look at the capture on the inside interface might provide some evidence about who is resetting the HTTP connections:
Firewall# show capture web_inside
2 packets captured
19:23:56.171469 10.4.4.33.1192 > 172.19.32.9.80: S 2178639828:2178639828(0) win
4096 <mss 1380>
19:23:56.171759 172.19.32.9.80 > 10.4.4.33.1192: R 0:0(0) ack 2178639829 win 0
Again, only two packets are seen at the inside interface. The reply packet that has reset the connection did indeed come from the web server’s IP address on the inside. In fact, the RST flag (R) was already set when the packet arrived at the firewall’s inside interface. Therefore, you can conclude that something is misconfigured on the web server that causes it to deny or reset every HTTP connection. The problem is not within the firewall.
Using the ASDM Packet Capture Wizard
You can also set up packet captures in ASDM using the Packet Capture Wizard. The ASA must be running release 8.0(1) or later, as well as ASDM release 6.0(1) or later. The wizard configures capture sessions that are identical to the capture command in the CLI, except that a GUI front end is used instead.
The Packet Capture Wizard sets up two separate capture sessions—one on the ingress side of the firewall and one on the egress side. Each session captures traffic in both directions, giving you data as it enters and exits the firewall.
To use the Packet Capture Wizard, click on the Wizards menu in ASDM and then select Packet Capture Wizard. Use the following steps to configure a capture session:
1. A new window describing the six steps of the wizard appears. Click the Next button.
2. Enter the ingress traffic information, as shown in Figure 11-12. This includes the ingress interface (outside in the example), source and destination addresses and subnet masks, and the protocol. In the example, traffic from any address to the host at 172.21.67.101 will be captured. Click the Next> button.
Figure 11-12 Entering Ingress Traffic Information in the Packet Capture Wizard
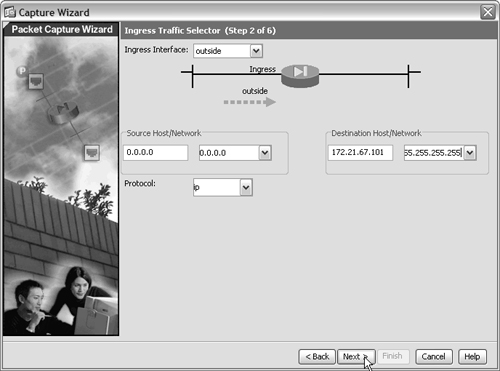
3. Enter the egress traffic information, as shown in Figure 11-13. This includes the egress interface (inside in the example) and the source and destination addresses and subnet masks. In the example, traffic from any address to the host at 192.168.100.101 will be captured. The firewall has already been configured with a static address translation of 172.21.67.101 on the outside to 192.168.100.101 on the inside.
Figure 11-13 Entering Egress Traffic Information in the Packet Capture Wizard
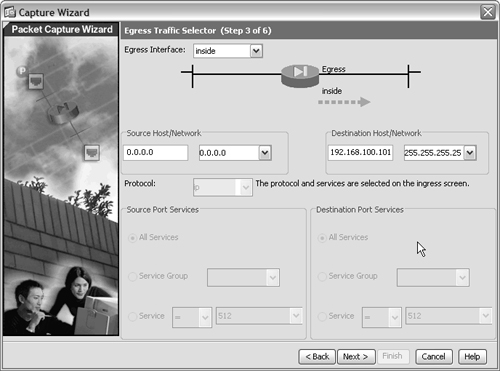
4. Enter the capture buffer parameters, as shown in Figure 11-14. The maximum packet size (1522 in the example) and capture buffer size (524,288 bytes in the example) are given here. Check the Use circular buffer box if you want the capture to use a circular buffer. By default, the capture stops when the buffer is full. Click Next>.
Figure 11-14 Tuning the Capture Buffer in the Packet Capture Wizard
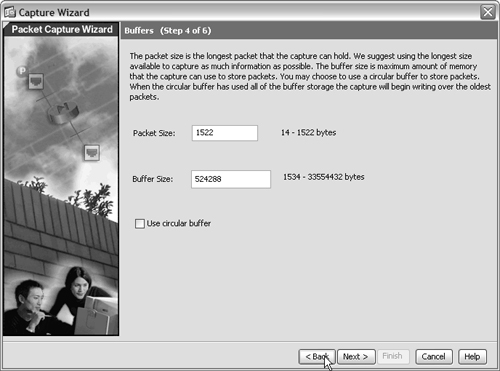
5. Click Next> in the Summary window, which shows all of the CLI commands that will be added to the firewall configuration to build the packet capture.
6. Start the capture by clicking the Start button. The Run Captures window remains mostly empty while the capture is running. To see the results in the capture buffers, click on the Get Capture Buffer button, as shown in Figure 11-15.
Figure 11-15 Displaying the Capture Buffers
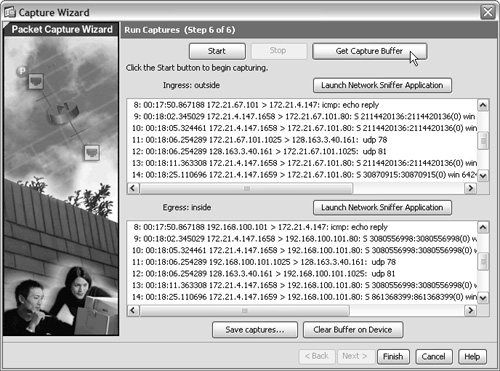
The capture buffer for the ingress capture session is shown in the topmost box, whereas the egress session is shown in the bottom box.
7. Save the capture buffers by clicking on the Save captures button. From the screen shown in Figure 11-16, select ASCII to save the capture in plaintext or PCAP to save it in a standard format that Ethereal or Wireshark can decode.
Click on Save ingress capture or Save egress capture to begin saving the capture buffer to a file on your local machine.
8. Load the capture into a network analyzer application by clicking on the Launch Network Sniffer Application button (shown previously in Figure 11-15). By default, ASDM expects to find Ethereal or Wireshark installed on your local PC at the following pathname:
C:Program FilesEtherealethereal.exe
Tip
If you do not have Ethereal or Wireshark installed, you can configure the wizard to use a different PCAP-compliant network analyzer application. Go to Tools > Preferences, and choose the location of the application’s startup file in the Network Sniffer Application box.
Figure 11-16 Saving the Capture Buffers
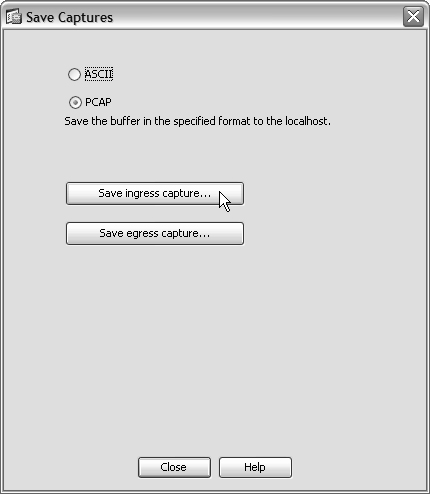
Capturing FWSM Packets Inside the Switch
Sometimes you might need to use an external network analyzer or application. With an ASA or PIX, you have physical interfaces to work with, which can be mirrored on a switch port where they terminate.
With a FWSM, however, the firewall is embedded in a Catalyst 6500 chassis, and you have no physical interfaces to mirror. The FWSM is based around virtual LAN (VLAN) interfaces within the chassis, which can be more difficult to access.
To intercept traffic within a VLAN inside a switch chassis you have two options:
• SPAN sessions—Switched Port Analyzer (SPAN) mirrors frames passing through a source interface onto a destination interface, where a sniffer is connected.
• VACL captures—A VLAN access list is used to identify interesting traffic on a source VLAN and copy it to a destination capture interface, where a sniffer is connected.
In Figure 11-17, a sniffer is connected to interface GigabitEthernet 2/1. From that location, you can capture frames from any VLAN within the switch—particularly the VLANs that interface with the FWSM.
Figure 11-17 An Example Scenario for Capturing FWSM Packets
First, consider an example SPAN session configuration. You can monitor traffic on a whole VLAN (and all active switch interfaces assigned to that VLAN), or you can monitor individual physical switch interfaces. For the FWSM outside interface in Figure 11-17, you could use interface GigabitEthernet1/1 as the source because VLAN 10 is accessible there.
For a VLAN that is entirely contained within the switch, such as the FWSM inside interface on VLAN 100, you would have to use VLAN 100 as the source. VLAN 100 is not accessible on any physical switch interface.
Suppose you want to capture packets from the FWSM inside interface on VLAN 100. The SPAN session could be configured with the following commands:
Switch(config)# monitor session 1 source vlan 100 both
Switch(config)# monitor session 1 destination interface gigabitethernet2/1
Now, all traffic entering or leaving the switch on interface GigabitEthernet 1/1 is mirrored to GigabitEthernet2/2 (the both keyword mirrors traffic in both directions from the source interface).
To capture packets on the FWSM outside interface, you could use either VLAN 10 or GigabitEthernet1/1 as the source.
As soon as your packet capture is complete, do not forget to tear down the VACL capture with the following command:
Switch(config)# no monitor session 1
With a SPAN session, all packets from the source are mirrored to the destination. The sniffer or network analyzer is responsible for filtering the mirrored packets, if you need to pinpoint specific types of traffic. With a VACL capture, you can configure an access list on the switch to identify only interesting traffic that is sent on to a capture interface. In a high-traffic volume VLAN, this can greatly reduce the amount of captured data you have to examine.
You can configure a VACL capture with the following steps:
1. Configure an access list to identify captured traffic:
Switch(config)# ip access-list extended acl_name
Switch(config-ext-nacl)# permit protocol source [source_port] destination [dest_port]
[arguments]
Switch(config-ext-nacl)# exit
The access list identifies only interesting traffic; it does not actually permit or deny the traffic from passing through the switch. The permit keyword is used to flag matching packets for capture. You can repeat the permit command to identify more interesting traffic to be captured.
You can use the deny keyword to exempt matching traffic from capture, if needed. A hidden deny ip any any statement is always implicit at the end of the access list.
2. Configure an access list to match all traffic.
A second ACL must be configured to match all traffic on the VLAN. This will be used in Step 3 to make sure that non-captured traffic is still forwarded normally by the switch.
Switch(config)# ip access-list extended match_any
Switch(config-ext-nacl)# permit ip any any
Switch(config-ext-nacl)# exit
3. Define a VLAN access map to handle the VLAN traffic:
Switch(config)# vlan access-map vacl_name 10
Switch(config-access-map)# match ip address acl_name
Switch(config-access-map)# action forward capture
Switch(config-access-map)# vlan access-map vacl_name 20
Switch(config-access-map)# match ip address match_any
Switch(config-access-map)# action forward
Switch(config-access-map)# exit
Here, the access list named acl_name, defined in Step 1, is used to match interesting traffic. The action forward capture command causes the interesting traffic to be forwarded through the switch normally (forward), as well as copied to the destination capture interface (capture).
The second vlan access-map command identifies any traffic and causes it to be forwarded normally (action forward) without being captured.
4. Apply the VACL to a specific VLAN:
Switch(config)# vlan filter vacl_name vlan-list vlan_number
The VACL is applied to VLAN number vlan_number immediately after this command is entered. From this point on, the VACL copies the interesting traffic from the VLAN to the destination interface that is identified in the following step.
5. Identify the destination capture interface:
Switch(config)# interface type mod/num
Switch(config-if)# switchport
Switch(config-if)# no ip address
Switch(config-if)# switchport access vlan vlan_number
Switch(config-if)# switchport mode access
Switch(config-if)# switchport capture
Switch(config-if)# exit
The switch interface should be assigned to the monitored VLAN number with the switchport access vlan command. The switchport capture command begins the VACL capture operation, allowing captured packets to be sent out the interface.
As a complete example for Figure 11-17, only traffic going to and from the host at 192.168.2.24 as seen on VLAN 100 should be identified for capture. All other traffic on VLAN 100 should be forwarded normally. You could use the following configuration commands to set up the VACL capture on the switch:
Switch(config)# ip access-list extended match_cap
Switch(config-ext-nacl)# permit ip any host 192.168.2.24
Switch(config-ext-nacl)# permit ip host 192.168.2.24 any
Switch(config-ext-nacl)# exit
Switch(config)# ip access-list extended match_any
Switch(config-ext-nacl)# permit ip any any
Switch(config-ext-nacl)# exit
Switch(config)# vlan access-map vacl_cap 10
Switch(config-access-map)# match ip address match_cap action forward capture
Switch(config-access-map)# exit
Switch(config)# vlan access-map vacl_cap 20
Switch(config-access-map)# match ip address cap_any action forward
Switch(config-access-map)# exit
Switch(config)# vlan filter vacl_cap vlan-list 100
Switch(config)# interface GigabitEthernet2/1
Switch(config-if)# switchport
Switch(config-if)# no ip address
Switch(config-if)# switchport access vlan 100
Switch(config-if)# switchport mode access
Switch(config-if)# switchport capture
Switch(config-if)# exit
Using Debug Packet
In FWSM 2.3 and PIX 6.3, you can enable a single debug packet session so that the firewall reports how it has handled packets from specific traffic flows. This feature is not available beginning with ASA 7.0(1) and FWSM 3.1(1).
Only the debug messages are displayed to the trace channel, or the first active Telnet session open to the firewall. No packets are captured or stored during the debug packet session. However, the packet header and upper-layer protocol headers are shown in the debug messages. As well, up to 50 bytes of the packet payload contents are displayed in hex and ASCII.
Tip
A debug session can impact the performance of a busy firewall. The firewall must match packets as it inspects them and generate the appropriate debug information. Obviously, adding this process can also add significant delays to the firewall’s throughput. Because debug output is also sent to a management session interactively, as matching packets are forwarded, a terminal session can become so congested with output that it becomes unusable.
As soon as the debug output begins, be ready to stop it by entering the no debug packet interface-name command.
If your terminal session is unresponsive and you cannot enter the command, start a new terminal session (preferably through Telnet or SSH) and enter the command from there.
Be aware that the no debug all and undebug all commands have no effect on the debug packet session. Debug packet is a special type of debug session and must be disabled explicitly.
You can define and activate a packet debug session with the following command:
Firewall# debug packet if_name [src source_ip [netmask mask]] [dst dest_ip
[netmask mask]] [[proto icmp] | [proto {tcp | udp} [sport src_port] [dport
dest_port]] [rx | tx | both]
The debug process displays only packets matching a set of parameters. The packets also must pass through the firewall interface named if_name (outside, for example) in the receive direction (rx, or inbound), the transmit direction (tx, or outbound), or either direction (both, inbound or outbound).
You can (and should) be as specific as possible in identifying the debugged traffic. You can use the src and dst keywords to specify the source address and destination address, respectively. If you also provide a netmask, it follows the normal subnet mask format (a 1 bit matches, and a 0 bit is a wildcard). You can match a protocol as ICMP (proto icmp), UDP (proto udp), or TCP (proto tcp), and the source and destination port numbers (sport and dport) if needed.
You can select the traffic direction, relative to the interface if_name, as receive only (rx), transmit only (tx), or in both directions (both).
As a simple example, the following debug packet command is used to verify how a firewall handles an ICMP echo request from a host on the outside (172.21.4.6) to a host on the inside (global address 10.63.89.161, local address 192.168.199.100):
Firewall# debug packet outside dst 10.63.89.161 both
--------- PACKET ---------
-- IP --
172.21.4.6==>10.63.89.161
ver = 0x4 hlen = 0x5 tos = 0x0 tlen = 0x3c
id = 0xf3a8 flags = 0x0 frag off=0x0
ttl = 0x7e proto=0x1 chksum = 0xbeb8
-- ICMP --
type = 0x8 code = 0x0 checksum=0x485c
identifier = 0x400 seq = 0x100
-- DATA --
00000010: 61 62 63 64 | abcd
00000020: 65 66 67 68 69 6a 6b 6c 6d 6e 6f 70 71 72 73 74 | efghijklmnopqrst
00000030: 75 76 77 61 62 63 64 65 66 67 68 69 a1 | uvwabcdefghi.
--------- END OF PACKET ---------
--------- PACKET ---------
-- IP --
172.21.4.6==>192.168.199.100
ver = 0x4 hlen = 0x5 tos = 0x0 tlen = 0x3c
id = 0xf3a8 flags = 0x0 frag off=0x0
ttl = 0x7e proto=0x1 chksum = 0x10f0
-- ICMP --
type = 0x8 code = 0x0 checksum=0x485c
identifier = 0x400 seq = 0x100
-- DATA --
00000010: 61 62 63 64 | abcd
00000020: 65 66 67 68 69 6a 6b 6c 6d 6e 6f 70 71 72 73 74 | efghijklmnopqrst
00000030: 75 76 77 61 62 63 64 65 66 67 68 69 a1 | uvwabcdefghi.
--------- END OF PACKET ---------
--------- PACKET ---------
-- IP --
192.168.199.100==>172.21.4.6
ver = 0x4 hlen = 0x5 tos = 0x0 tlen = 0x3c
id = 0xf3a8 flags = 0x0 frag off=0x0
ttl = 0xff proto=0x1 chksum = 0x8fef
-- ICMP --
type = 0x0 code = 0x0 checksum=0x505c
identifier = 0x400 seq = 0x100
-- DATA --
00000010: 61 62 63 64 | abcd
00000020: 65 66 67 68 69 6a 6b 6c 6d 6e 6f 70 71 72 73 74 | efghijklmnopqrst
00000030: 75 76 77 61 62 63 64 65 66 67 68 69 a1 | uvwabcdefghi.
--------- END OF PACKET ---------
Firewall# no debug packet outside
Notice that the first inbound packet is destined for the global address of the internal host. The firewall displays the second packet when it performs the address translation, with a new destination of the local address. The third packet is the echo reply from the internal host.
11-3 Verifying Firewall Connectivity
When you install a firewall or make configuration changes to one, you might need to verify that it can communicate on all its interfaces. Users might also report problems they experience when trying to pass through the firewall. You need a logical approach to verifying the firewall’s operation and troubleshooting its connectivity.
You can follow these basic steps to verify that a firewall can communicate with its neighboring networks:
Step 1. Test with ping packets.
Step 2. Check the ARP cache.
Step 3. Check the routing table.
Step 4. Use traceroute to verify the forwarding path.
Step 5. Check the access lists.
Step 6. Verify address translation operation and connection tables.
Step 7. Look for active shuns.
Step 8. Check user authentication.
Step 9. See what has changed.
Each of these steps is discussed fully in the sections to follow.
Tip
In case you need to open a case with the Cisco TAC, you can gather all the necessary information from your firewall with one command. Configure your terminal emulator to log the session to a file, and issue the show tech-support command. The saved file can be uploaded or sent to the TAC engineer.
You can also use the Packet Tracer feature to verify many of the same firewall mechanisms. This is available on ASA platforms beginning with release 7.2(1). Through ASDM, you can start the Packet Tracer tool, which moves virtual trace packets through each of the following firewall operations:
• Flow Lookup—Checks for existing xlate and conn entries
• UN-NAT—Checks for address translation entries
• Access List Lookup—Checks for any applicable ACL entries
• IP Options Lookup—Checks handling of IP options in the ingress packet
• NAT—Checks the Reverse Path Forwarding (RPF) information
• NAT—Checks for host connection limits
• IP Options Lookup—Checks handling of IP options in egress packet
• Flow Creation—Creates new xlate and conn entries, if needed
• Route Lookup—Checks for a route to the destination address
Tip
Notice that the Packet Tracer tool does not include tests from any of the firewall’s inspection engines. This is because only a single packet is used for the test.
To start Packet Tracer, click on the Tools menu in ASDM and select Packet Tracer. A new Packet Tracer window appears, as shown in Figure 11-18, containing a string of symbols representing each firewall function to be tested. To begin a Packet Trace, use the following steps:
Figure 11-18 Entering Information into the Packet Tracer Tool
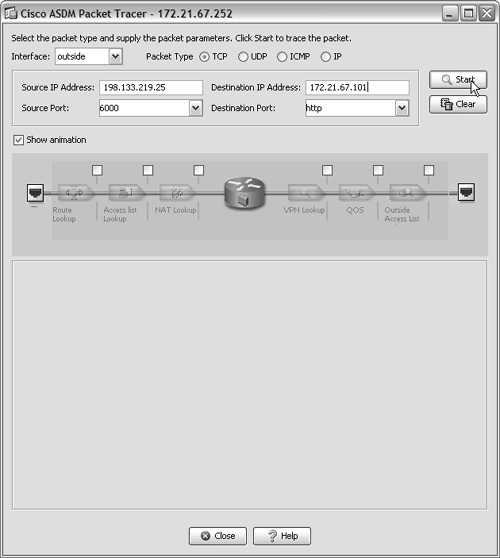
1. Choose the ingress interface, where the packet enters the firewall. At the upper-left corner of the window, select an interface name from the drop-down menu.
2. Select the Packet Type—TCP, UDP, ICMP, or IP—from the list across the top of the window.
3. Enter the Source IP Address and Source Port.
4. Enter the Destination IP Address and Destination Port.
5. Click the Start button. Packet Tracer animates a packet as it moves from function to function. When the trace is complete, the results are shown in the bottom half of the window.
If the trace is successful, the packet is able to enter and exit the firewall. You see green check marks in the Action column next to each successful phase. As well, the Results section shows the ingress and egress interfaces. The outcome of each phase is shown in a collapsed list, as shown in Figure 11-19. You can click on the plus sign next to any Phase to see more detailed information about the test.
Figure 11-19 A Successful Packet Tracer Test
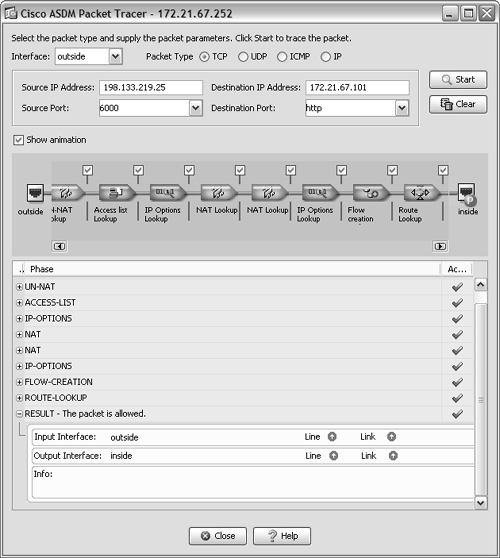
If the trace is not successful, you see red X symbols next to the phase that failed or denied the packet. In Figure 11-20, a packet trace has been configured to use a destination port of sqlnet, arriving on the outside interface. The firewall has an access list that permits inbound HTTP (TCP port 80) traffic, but denies inbound SQLNet (TCP port 1433).
Tip
The Packet Tracer tool creates a virtual packet based on the protocol, address, and port information you provide. The virtual packet is passed through each of the firewall functions, as if a real packet were being handled. This means that you see syslog information being generated as the trace progresses. The firewall removes the virtual packet as soon as it is queued in the egress interface buffer for transmission.
You can also use the Packet Tracer tool from the CLI with the following syntax:
Firewall# packet-tracer input if_name {tcp | udp | icmp | ip} source_addrsource_port dest_addr dest_port [detailed] [xml]
The output shows each of the firewall test phases, along with the results. The xml keyword produces an XML output version of the results; this is meant for ASDM, which translates XML into the graphical results.
Figure 11-20 An Example of a Failed Packet Trace
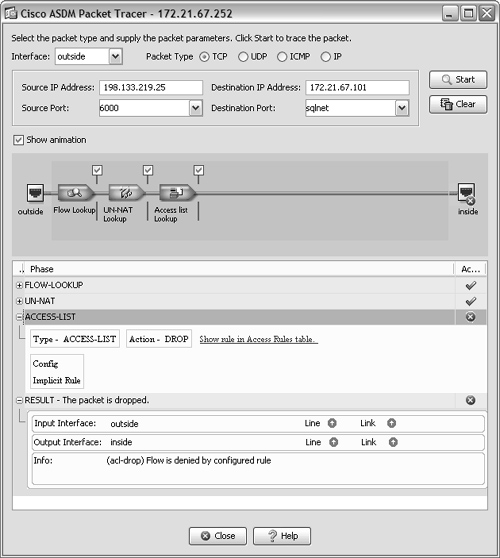
Step 1: Test with Ping Packets
If you know that some hosts on one interface are having trouble reaching hosts on another interface, you can begin troubleshooting with the most basic tool, the ping or ICMP echo.
You should begin by testing with ping packets from the firewall itself to hosts on each side. From a management session, you can use this command:
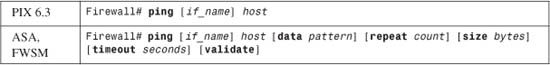
The destination address is host, an IP address or a hostname. If a hostname is given, the firewall must also be configured to use an external DNS to resolve the IP address.
If the firewall can find a routing table entry for the destination, it can figure out which interface to use as the source and source address. You can override that choice by specifying the interface name as if_name (inside, for example). By default, the firewall sends five ICMP echo packets toward the destination, as shown in the following example:
Firewall# ping www.mycompany.com
Type escape sequence to abort.
Sending 5, 100-byte ICMP Echos to 10.7.2.27, timeout is 2 seconds:
!!!!!
Success rate is 100 percent (5/5), round-trip min/avg/max = 1/1/1 ms
Firewall#
Tip
Be aware that although the firewall transmits the ping packet (ICMP echo request), it does not necessarily allow the reply (ICMP echo reply) to return and terminate on its interface. If the ping command returns question marks, as in the following example, the firewall is not receiving or permitting the ICMP echo-reply packets.
Firewall# ping 10.10.10.10Type escape sequence to abort.Sending 5, 100-byte ICMP Echos to 10.10.10.10, timeout is 2 seconds:?????Success rate is 0 percent (0/5)Firewall#
By default, PIX and ASA platforms permit inbound ICMP packets to terminate on their interfaces, but FWSM does not. In any event, make sure that the firewall is configured to permit at least the specific ICMP packet types that are useful for troubleshooting. You can use the following icmp commands to accomplish this:
Firewall(config)# icmp permit any echo if_nameFirewall(config)# icmp permit any echo-reply if_nameFirewall(config)# icmp permit any time-exceeded if_nameFirewall(config)# icmp deny any if_name
On an ASA or a FWSM, the ping command has been expanded to allow more options. This is similar to the same command in Cisco IOS Software. Further, you can enter the ping command without any arguments to perform an extended ping. The firewall prompts for each parameter that it needs. Extended pings are useful when you need to send a specific size ICMP packet,
In the following example, 50 ICMP echo packets are sent to destination 10.10.10.10. Each packet is 1000 bytes in size.
Firewall# ping
Interface: outside
Target IP address: 10.10.10.10
Repeat count: [5] 50
Datagram size: [100] 1000
Timeout in seconds: [2]
Extended commands [n]: y
Verbose? [no]:
Validate reply data? [no]:
Data pattern [0xabcd]:
Sweep range of sizes [n]:
Type escape sequence to abort.
Sending 50, 1000-byte ICMP Echos to 10.10.10.10, timeout is 2 seconds:
!!!!!!!!!!!!!!!!!!!!!!!!!!!!!!!!!!!!!!!!!!!!!!!!!!
Success rate is 100 percent (50/50), round-trip min/avg/max = 1/2/10 ms
Firewall#
Tip
After you begin an extended ping, you have to wait until all of the ping packets are sent and replies are received. If the destination does not answer with an echo-reply, the firewall waits for a timeout period (default 2 seconds) before moving on to the next ping.
If you select a very large repeat count (number of ping packets) and the destination does not reply, you could be waiting a very long time for the ping command to finish. You can break out of the ping process at any time by entering the Ctrl-C keystroke sequence.
Try sending pings from the firewall to a known host in each direction. If the pings are successful, the firewall can communicate with nearby hosts on the most basic level.
Now go to a host on each side of the firewall, and try to send ping packets toward the firewall. First, you can try to ping the firewall interfaces directly.
If that is successful, you might want to try sending pings from a host on one side of the firewall to a host on the other. This tests the full round-trip path out and back through the firewall. Make sure you have configured any access lists to allow inbound ICMP echo, echo-reply, and time-exceeded packet types on the firewall interfaces. This might need to be configured on each of the firewall interfaces along the path, depending on the firewall platform and whether an access list has been applied to the interfaces. In addition, ASA and FWSM offer an ICMP inspection engine that should be enabled so that ICMP traffic can be inspected and permitted.
Tip
You can also enable ICMP debugging on the firewall to get detailed information about how ICMP packets are being handled. Be careful, though, because any type of packet debugging can adversely load an already-busy firewall. Also, when you enable ICMP debugging, the firewall reports on any ICMP packet that arrives, is inspected, and is forwarded. This might result in much more information than you are expecting, especially when you are trying to test by pinging a single host.
Use the following command to start ICMP debugging:
Firewall# debug icmp trace
Be sure to stop the debugging session as soon as you are finished with it. You can use the no debug icmp trace command, as well as no debug all or undebug all.
For example, suppose host 192.168.199.100 on the inside of a firewall is trying to ping host 172.16.89.5 on the outside. The ICMP debug output is as follows:
Firewall# debug icmp traceICMP trace onWarning: this may cause problems on busy networksFirewall# 1: ICMP echo-request from inside:192.168.199.100 to 172.16.89.5 ID=0 seq=1435 length=80
2: ICMP echo-request: translating inside:192.168.199.100 to outside:172.16.89.1613: ICMP echo-reply from outside:172.16.89.5 to 172.16.89.161 ID=0 seq=1435 length=804: ICMP echo-reply: untranslating outside:172.16.89.161 to inside:192.168.199.100Firewall# no debug icmp traceICMP trace off
Step 2: Check the ARP Cache
Like any host on a network, a firewall must have the basic mechanism to relate IP addresses (Layer 3) to MAC addresses (Layer 2). This is done by building and maintaining an ARP cache. Normally, when a host knows a destination’s IP address, it sends an ARP request in the hope that the destination will send an ARP reply with its MAC address. The firewall can build its ARP cache by sending its own ARP requests or by listening to other ARP replies on its interfaces.
Connectivity through the firewall can be affected if the firewall has a stale or incorrect ARP entry. For example, the next-hop router on an interface might have just changed its IP address. A host on the local network of a firewall interface could also change its IP address. If the firewall has a previous ARP entry and does not hear an ARP reply with the new information, it continues to use the stale entry.
For example, consider a host that starts out with IP address 192.168.199.100. Later, it changes to 192.168.199.101. Here is the firewall ARP cache before and after the address change:
Firewall# show arp
inside 192.168.199.100 0050.e2c6.f680
Firewall# show arp
inside 192.168.199.101 0050.e2c6.f680
inside 192.168.199.100 0050.e2c6.f680
Firewall# show arp timeout
arp timeout 14400 seconds
With the default ARP timeout value, the old ARP entry remains in the cache for up to 4 hours! (In ASA, the show arp timeout command is actually show running-config arp timeout.)
Now imagine the opposite case, in which a change in MAC addresses occurs. Suppose the hosts on a network have been using an existing router as their default gateway. The router has always been 192.168.199.1 (00d0.0457.3bfc). Now a firewall is being installed in the network, and it will become the default gateway for the internal hosts. Therefore, the firewall uses 192.168.199.1, and the change in gateway platforms is transparent to the end users.
For security reasons, Cisco firewalls try to stay silent and do not announce any information about themselves. As a result, they do not send gratuitous ARP requests on their interfaces. One side effect of this appears when a firewall replaces an existing router on the network. All the internal hosts still have an ARP cache entry for 192.168.199.1 as 00d0.0457.3bfc, which belonged to the router. The firewall comes up as 192.168.199.1, but with its own MAC address of 0090.276c.3d0a. Because it does not announce itself with a gratuitous ARP, the hosts never notice the change in MAC addresses, and they continue to use the old router MAC address until their ARP entries expire. In other words, none of the hosts can send packets to their default gateway (the firewall) until the old ARP entries are flushed.
You should also be aware of how a firewall maintains its own ARP cache. If an ARP cache entry exists for an IP-to-MAC address mapping, a new ARP reply has the following effect:
• If the MAC address is the same, but the IP address is different, a new ARP entry is added to the cache.
• If the IP address is the same, but the MAC address is different, the existing ARP entry is overwritten with the new information.
You can follow these steps to verify ARP cache information:
1. Display the ARP cache:
Firewall# show arp
Each ARP entry contains the station’s MAC address, the corresponding IP address, and the firewall interface where the ARP reply was heard. A sample ARP cache is as follows:
Firewall # show arp
stateful 192.168.199.2 0030.8587.5432
outside 172.16.11.71 0003.4725.2e23
outside 172.16.11.67 00d0.01e6.6ffc
inside 192.168.25.9 0003.4725.2e94
inside 192.168.25.10 0003.a088.5769
inside 192.168.254.2 0000.0c07.ac01
2. (Optional) Verify the ARP cache timeout value:
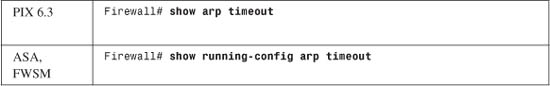
Each ARP entry has an aging or persistence timer associated with it. By default, the firewall keeps an entry for 14,400 seconds (4 hours) before discarding it. If subsequent ARP replies are received for that entry before the timer expires, the timer is reset.
Tip
To adjust the ARP persistence timeout value, you can use the arp timeout seconds configuration command.
3. (Optional) Flush the ARP cache:
Firewall# clear arp
If an entry exists and the host changes its IP address, an ARP reply might not be received. The stale entry, with its now-outdated IP-MAC address mapping, continues to be used for up to 4 hours.
In this case, you should flush the stale ARP entry so that a new one can be created. It is not possible to flush just one entry; the entire ARP cache must be flushed at one time.
4. (Optional) Define a static ARP entry:
Firewall(config)# arp interface_name ip_address mac_address [alias]
Sometimes you might need to define a static ARP cache entry that will never expire. This can be handy if there is a host that only listens on its network interface and never sends an ARP reply. The static ARP entry is associated with the firewall interface named interface_name and binds ip_address to mac_address (dotted-triplet format as in xxxx.yyyy.zzzz).
You can add the alias keyword to create a static ARP cache entry that the firewall uses to generate proxy ARP replies. When other hosts send an ARP request for that address, the firewall uses the alias entry to send back an ARP reply.
Step 3: Check the Routing Table
A firewall maintains a routing table, much as a router does. The routing table is consulted when a packet has been inspected and is ready to be forwarded out a firewall interface. The firewall must have a route for the destination network in its routing table before a packet can be sent on its way.
You can verify the routing table contents with the show route command, as in this example:
Firewall# show route
O IA 192.168.167.1 255.255.255.255 [110/11] via 192.168.198.4, 0:00:01, inside
C 192.168.77.0 255.255.255.0 is directly connected, dmz
C 192.168.198.0 255.255.255.0 is directly connected, inside
C 10.1.0.0 255.255.0.0 is directly connected, outside
S* 0.0.0.0 0.0.0.0 [1/0] via 10.1.1.1, outside
Firewall#
Here, routes marked with C are directly connected to the firewall. In other words, they are subnets that are configured on the firewall interfaces. Routes marked with O have been learned through OSPF. The default route shown is labeled S because it has been statically configured on the firewall.
Verify that a destination network you are trying to reach through the firewall actually appears in the firewall’s routing table. Obviously, if a specific subnet does not appear, the default route is used.
Step 4: Use Traceroute to Verify the Forwarding Path
Traceroute is a common tool you can use to discover the path from one host to another through the network. The originating host sends special packets toward the destination. Each router that is encountered along the way returns a message to the source, indicating that it was present on the path.
The host generating a traceroute sends packets toward the destination with the IP time-to-live (TTL) field incrementing from 1. The TTL field is a simple hop counter, specifying the maximum number of router hops that the packet is allowed to traverse.
The first traceroute packet has a TTL of 1; the first router to receive the packet must decrement the TTL (as all routers are required to do). The TTL is now 0, so the router drops the packet and returns an ICMP time-exceeded message to the source. The next traceroute packet has a TTL of 2, so the second-hop router returns an ICMP message, and so on.
As the ICMP time-exceeded messages are received at the traceroute source, the router IP address is displayed, along with the round-trip time. As soon as the destination host returns its ICMP message, a record of each router hop along the path is available.
Figure 11-21 illustrates this process. Host PC-A performs a traceroute to host PC-B. Each successive traceroute packet has a higher TTL and is returned by routers progressively further along the path. Notice that the firewall participates in the traceroute process only if ICMP packets are used as traceroute probes. Otherwise, the firewall only inspects and forwards the traceroute packets without modification and does not appear as a hop.
Figure 11-21 Traceroute as a Progression of Probe Packets
Using Traceroute on a Host
You can use traceroute on a host to troubleshoot or verify connectivity through a firewall. Be aware that the firewall itself might be missing from the traceroute hop information. If it is missing, UDP traceroute packets have been used; if it appears, ICMP traceroute packets have been used.
If the traceroute begins to time out before the destination host is reached, something along the way is preventing connectivity. This could be the firewall if it has not been configured to allow the traceroute packets in both directions.
When PCs perform a traceroute (the tracert command), they send ICMP echo-request packets with increasing TTL values. When Cisco routers and switches perform a traceroute (the trace IOS or traceroute CatOS command), they send UDP packets to port 33434 with increasing TTL values. (Some platforms use a port slightly greater than 33434, and others begin with 33434 and increase the port number with each packet sent.)
You should configure the firewall to permit the following types of packets through each of its interfaces along the traceroute path:
• ICMP echo-request—Traceroute packets sent from the source.
• ICMP echo-reply—When the target host is finally reached, it returns an echo-reply message.
• ICMP unreachable—Messages returned by distant hosts for path MTU discovery.
• ICMP time-exceeded—Messages returned by routers indicating a traceroute hop.
• UDP—Traceroute packets sent from Cisco devices.
• DNS—Used to look up domain names of each traceroute hop (if requested).
You can permit these packet types on the firewall by using the following template to configure an access list that will be applied to a firewall interface:
Firewall(config)# access-list acl_name permit icmp any any eq echo
Firewall(config)# access-list acl_name permit icmp any any eq echo-reply
Firewall(config)# access-list acl_name permit icmp any any eq unreachable
Firewall(config)# access-list acl_name permit icmp any any eq time-exceeded
Firewall(config)# access-list acl_name permit udp any range 32768 65535 any range
33434 33523
Firewall(config)# access-list acl_name permit udp any dns_address eq domain
The fifth line, permitting UDP traffic, is optional and should be used only if you require UDP traceroute response from the firewall. You should use caution if you decide to include that command, because it gives open access from any host to any host over a wide range of UDP ports. The UDP port range must be kept wide because the traceroute UDP port tends to vary across router and switch platforms.
Finally, if you use ICMP traceroute probes and you want the firewall to return an ICMP message to declare its presence, you need one final configuration change. (The firewall does not accept any UDP traceroute probes, so it does not return any ICMP error messages about them. As a result, the firewall does not appear as a hop when UDP probes are used.)
By default, an FWSM firewall drops any ICMP packet destined for a firewall interface address, whereas PIX and ASA platforms permit them. To get the firewall to interpret the traceroute probe and send back an ICMP time-exceeded message, you should enable specific ICMP processing on the inbound firewall interface:
Firewall(config)# icmp permit source-address source-mask echo if_name
Firewall(config)# icmp permit source-address source-mask echo-reply if_name
Firewall(config)# icmp permit source-address source-mask time-exceeded if_name
Firewall(config)# icmp permit source-address source-mask echo if_name
Tip
On ASA and FWSM platforms, you should enable the ICMP inspection engine to examine any ICMP traffic passing through the firewall. You can do this with the inspect icmp command while configuring a policy map.
On any Cisco firewall platform, you should enable the fixup or inspection for ICMP error messages with the inspect icmp error command (ASA and FWSM) or fixup icmp error command (PIX 6.3). No stateful inspection is performed; instead, the firewall examines the ICMP error packets and translates the appropriate addresses in the original header portion of the error payload.
Using Traceroute on the Firewall
Beginning with ASA 7.2(1), you can perform a traceroute on the ASA itself. In a nutshell, the ASA sends packets out toward a destination address, where each successive packet has its TTL value incremented by one. You can start a traceroute with the following command:
Firewall# traceroute destination [source source] [timeout timeout] [probe probe_num] [ttl
min_ttl max_ttl] [port port_value] [use-icmp] [numeric]
The destination can be an IP address or a hostname. If a hostname is used, the ASA must also be configured to use a DNS to resolve the destination address.
If you enter the traceroute command with no other keywords, the ASA prompts for each value. The following traceroute parameters can be used:
• source source—The source address used in the traceroute packets can be identified by an IP address or interface name. If an IP address is given, it must be one that is already configured on an interface.
• timeout timeout—By default, the firewall waits 3 seconds to receive an ICMP time-exceeded message for each probe sent.
• probe probe_num—By default, three probes are sent for each successive TTL value or router hop. This lets you see the results of any path load balancing along the way.
• ttl min_ttl max_ttl—By default, the traceroute begins with a minimum TTL of 1 and ends when the destination is reached, up to a maximum TTL of 30. You can adjust the TTL range to skip nearby router hops or to probe more distant router hops.
• port port_value—By default, traceroute sends probe packets using UDP port 33434. This is consistent with Cisco IOS devices. You can select a UDP port value between 1 and 65535, if needed.
• use-icmp—Traceroute uses ICMP probe packets, rather than UDP probes.
• numeric—By default, traceroute attempts to resolve the hostname for each router hop that it detects. You can use the numeric keyword to prevent reverse DNS lookups, so that only the IP addresses of router hops are shown. This can be useful if you do not have DNS servers configured on your firewall, or if you do not want the firewall spending extra time resolving the names.
Tip
Be aware that traceroute depends on ICMP timeout-exceeded messages being returned from each router hop toward the destination. By default, the firewall denies any inbound ICMP messages arriving on any of its interfaces. You should enter the following configuration command to permit the ICMP time-exceeded messages on the interface where the destination is found:
Firewall(config)# icmp permit any time-exceeded if_name
As an example, a traceroute is started to verify the path from the ASA’s outside interface to www.cisco.com (198.133.219.25). Notice that three response times are given for each router hop, as the results of the three probes sent to each TTL value.
Firewall(config)# icmp permit any time-exceeded outside
Firewall(config)# exit
Firewall#
Firewall#
Firewall# traceroute www.cisco.com
Type escape sequence to abort.
Tracing the route to 198.133.219.25
1 128.163.66.2 0 msec 0 msec 0 msec
2 192.168.253.49 0 msec 0 msec 0 msec
3 128.163.110.67 0 msec 0 msec 0 msec
4 128.163.55.130 0 msec 0 msec 0 msec
5 pks2-04-pop2.net.uky.edu (128.163.221.52) 0 msec 0 msec 0 msec
6 pks2-04-pop2.net.uky.edu (128.163.221.2) 0 msec 0 msec 0 msec
7 atl-edge-19.inet.qwest.net (208.46.0.121) 20 msec 20 msec 20 msec
8 atl-core-01.inet.qwest.net (205.171.21.125) 10 msec 20 msec 20 msec
9 atl-brdr-03.inet.qwest.net (205.171.21.106) 20 msec 20 msec 10 msec
10 ggr2-p322.attga.ip.att.net (192.205.33.89) 50 msec 40 msec 40 msec
11 tbr2011101.attga.ip.att.net (12.123.20.206) 90 msec 90 msec 100 msec
12 tbr1-cl13.dlstx.ip.att.net (12.122.2.89) 90 msec 90 msec 80 msec
13 tbr1-cl20.la2ca.ip.att.net (12.122.10.50) 80 msec 80 msec 90 msec
14 gar1-p370.sj2ca.ip.att.net (12.122.2.249) 90 msec 100 msec 90 msec
15 12.118.124.10 90 msec 80 msec 80 msec
16 sjce-dmzbb-gw1.cisco.com (128.107.239.53) 80 msec 90 msec 90 msec
17 sjck-dmzdc-gw1-gig1-1.cisco.com (128.107.224.69) 80 msec 70 msec 70 msec
18 * * *
Firewall#
As the traceroute progresses, you can see any of the following characters displayed, each indicating a different condition:
• nn msec—The number of milliseconds elapsed from when a probe was sent until an ICMP time-exceeded reply was received
• *—No response was received before the timeout period expired
• !N—ICMP network unreachable was received
• !H—ICMP host unreachable was received
• !P—ICMP port unreachable was received
• !A—ICMP administratively prohibited was received
• ?—Unknown ICMP error was received
Tip
After you begin a traceroute, you have to wait until all of the TTL values are tried (up to 30 by default). If the firewall does not receive ICMP time-exceeded messages in reply, it waits for a timeout period (default 3 seconds) before moving on to the next probe.
In other words, you could be waiting a very long time for the traceroute command to finish. You can break out of the traceroute process at any time by entering the Ctrl-C keystroke sequence.
Step 5: Check the Access Lists
If you find specific hosts or types of traffic that cannot pass through the firewall, you should verify the access lists that are applied to the firewall interfaces.
In some cases, corporate security policies might dictate that the firewall should deny a certain type of traffic. In other cases, an access list might be misconfigured or might have an outdated configuration that denies traffic by mistake.
You can follow these steps to help pinpoint an ACL configuration that could be blocking traffic:
1. Identify which ACL is applied to an interface:
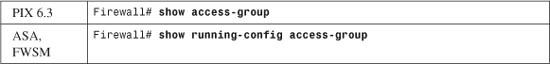
If your firewall has many access lists configured, you might not remember which one has been applied or bound to a particular interface or in which direction it was bound. You also might not remember the name of a certain access list. The output of this command shows which ACL is bound to which interface, as in this example:
Firewall# show running-config access-group
access-group acl_out_v19 in interface outside
access-group acl_inside in interface inside
access-group acl_temp_dmz in interface dmz
access-group mylist_3 in interface dmz2
Firewall#
2. (Optional) Check the ACL commands in the configuration:
Firewall# show run | {include | grep} matching_text
If large ACLs are defined, you can use the include or grep keywords to search for specific addresses or words in the ACL. This is a much more efficient way to find matching statements than just paging through the firewall configuration with show running-config or write term. You can quickly see any references to matching_text in the ACL configuration.
However, if object groups are defined and they are applied in the ACL, this method might not display intuitive results. In other words, the object groups and ACLs are configured separately, so this search displays matching text from either section of the configuration.
3. Check ACL activity:
Firewall# show access-list acl_name [| {include | grep} matching_text]
Each condition in the access list is shown, along with a count of the number of “hits” or times any packet has matched that condition on the interface. You can add an optional filter to search the ACL for specific matching_text. If your ACL is very large, you might want to use the | include filter to look for subnet or host addresses or specific protocol or port numbers within the ACL.
If you know the specific ACL rule that you are expecting to be active in permitting or denying traffic, you can check its hit count (hitcnt). If the hit count is 0, no packets have matched that condition; if the count is positive or rising, it is matching traffic.
In the following example, the first line shown permits public access to the 192.168.106.0/24 subnet using SQL, but no matching traffic has been seen. The second line allows public access to a web server, and almost 6 million matching packets have been seen.
access-list acl_outside line 720 permit udp any 192.168.106.0 255.255.255.0
eq 1433 (hitcnt=0)
access-list acl_outside line 761 permit tcp any host 192.168.106.13 eq www
(hitcnt=5997791)
Tip
If you have configured many object groups in your firewall, you might find it difficult to sort through both object group and access list definitions to find specific conditions. The show access-list command also expands any object group references in the ACL so that the object group contents are shown with their respective hit counts.
In this way, the firewall rules can be shown as they are interpreted. In the following example, an object group called web-servers has been configured and referenced in an ACL:
Firewall# show access-list acl_outside | begin web-serversaccess-list acl_outside line 740 permit tcp any object-group web-servers eqwwwaccess-list acl_outside line 740 permit tcp any host 172.17.69.20 eq www (hitcnt=8743)access-list acl_outside line 740 permit tcp any host 172.17.69.30 eq www (hitcnt=16432)access-list acl_outside line 740 permit tcp any host 172.17.69.40 eq www (hitcnt=1711)access-list acl_outside line 740 permit tcp any host 172.17.69.50 eq www (hitcnt=4913495)[output deleted]
Notice that each line has the same ACL line number (740), indicating that the object group is referenced in that line of the ACL acl_outside. The object group has been expanded so that the ACL looks like it was written with separate rules for each web server. This makes it much easier to search for things without trudging through complex nested object groups and ACL statements.
Beginning with ASA 8.0(1) and ASDM 6.0(1), you can display live ACL hit counts from an ASDM session. This can be useful if you want to see a list of the most used ACE entries.
The firewall identifies each ACL line with a unique hex value, which can be seen at the end of each line in the ACL configuration. ASDM uses the hex values to correlate ACE entries with their respective hit counts. As an example, consider the following ACL configuration:
Firewall# show access-list acl_outside
access-list acl_outside; 9 elements
access-list acl_outside line 1 extended permit tcp any host 172.21.67.101 eq www
(hitcnt=1) 0x82c8336b
access-list acl_outside line 2 extended permit tcp any host 172.21.67.101 eq https
(hitcnt=5) 0x8e5901d0
access-list acl_outside line 3 extended permit tcp any host 172.21.67.101 eq smtp
(hitcnt=2) 0xe467c098
access-list acl_outside line 4 extended permit icmp any host 172.21.67.101 (hitcnt=0)
0x57e1887
access-list acl_outside line 5 extended permit icmp any host 172.21.67.101 echo (hitcnt=0)
0xf9492c4a
access-list acl_outside line 6 extended permit icmp any host 172.21.67.101 echo-reply
(hitcnt=0) 0xf068af69
access-list acl_outside line 7 extended permit icmp any host 172.21.67.101 time-exceeded
(hitcnt=0) 0x2317d4
access-list acl_outside line 8 extended permit udp any host 172.21.67.101 eq domain
(hitcnt=0) 0xaf08b276
Firewall#
ASDM uses the show access-list acl_name brief command to get a list of ACEs that have a nonzero hit count. The output consists of only the hex identifiers and a 16-digit hex value for the hit counts, as in the following example:
Firewall# show access-list acl_outside brief
access-list acl_outside; 10 elements
82c8336b 00000000 00000001
8e5901d0 00000000 00000005
e467c098 00000000 00000002
057e1887 00000000 00000001
Firewall#
Notice how ACE identifier 8e5901d0 has a hit count of 5, and that it corresponds to line 2 of the acl_outside ACL. Using the same example ACL, Figure 11-22 shows how ASDM can be used to display the most used ACE entries that are applied to the firewall interfaces. After ASDM is started, make sure the Home button is selected, and go to the Firewall Dashboard tab. The ACL activity can be seen in the upper-right portion of the ASDM window.
Figure 11-22 Using ASDM to View Live ACL Hit Counts
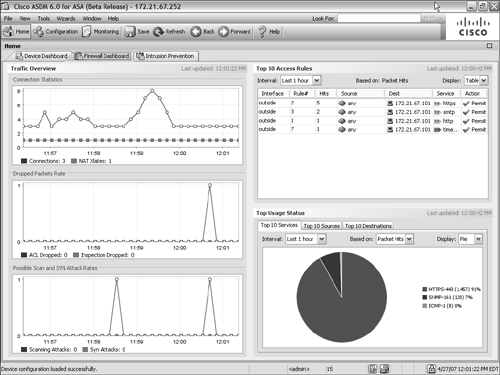
Step 6: Verify the Address Translation and Connection Tables
Before a host can send traffic through a firewall, the firewall must have the following items configured properly:
• Address translation, using static or nat/global commands (unless the no-nat-control command is configured)
• An access list that permits the traffic; this allows connections to be established
You can monitor the xlate and conn entries for specific hosts in several ways, as described in the following sections.
Monitoring Translations
You can see what (if any) address translations have been created for a host by using a form of the show xlate command:
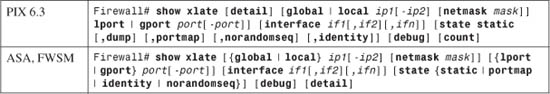
Remember with xlate entries, global represents the translated address on the lower-security interface, and local is the address on the higher-security interface. Use any of the following commands according to the IP address information you already know.
You can select a global or local address or a range of addresses. You can add a local port (lport) or global port (gport) or a range of ports. In addition, you can specify one or more firewall interfaces that are involved with the translation. You can specify the translation type as static, portmap (PAT), identity (identity NAT), or noramdomseq (no randomization of the TCP initial sequence number).
The command output is shown in a brief format (local and global addresses only) by default. The output can also be requested as detail (the default format plus the firewall interfaces and translation type) or as debug (the detail format plus the idle time).
To get a feel for the current number of xlate table entries, you can use the following command:
Firewall# show xlate count
Tip
The show xlate commands covered in the following sections give basic information about the translated addresses, along with any port translation. Here is an example:
Firewall# show xlate local 172.27.112.2618356 in use, 22368 most usedPAT Global 10.1.1.1(11104) Local 172.27.112.26(4685)PAT Global 10.1.1.1(24560) Local 172.27.112.26(4695)
You can also display translation flags and timeout values by adding the debug keyword to each command:
Firewall# show xlate local 172.27.112.26 debug18729 in use, 22368 most usedFlags: D - DNS, d - dump, I - identity, i - inside, n - no random, o - outside, r - portmap, s - staticTCP PAT from inside:172.27.112.26/4697 to outside:10.1.1.1/23228 flags r idle 0:03:19 timeout 0:00:30TCP PAT from inside:172.27.112.26/4695 to outside:10.1.1.1/24560 flags r idle 48:06:38 timeout 0:00:30
Finding Xlate Entries Based on a Global Address
To find xlate entries based on a global address, use the following command:
Firewall# show xlate global global-ip [netmask mask] [gport global-port]
For example, the following output shows some of the PAT entries that have been created using global address 12.163.11.72:
Firewall# show xlate global 12.163.11.72
15624 in use, 26615 most used
PAT Global 12.163.11.72(10454) Local 172.21.40.111(1033)
PAT Global 12.163.11.72(10406) Local 172.21.96.91(1052)
PAT Global 12.163.11.72(10416) Local 172.21.100.59(2749)
[output omitted]
Finding Xlate Entries Based on a Local Address
To find xlate entries based on a local address, use the following command:
Firewall# show xlate local local-ip [netmask mask] [lport local-port]
For example, the following command is used to display the xlate entries for all local addresses using local port 123 (UDP 123 is used for NTP):
Firewall# show xlate lport 123
15630 in use, 26615 most used
PAT Global 128.1.10.72(190) Local 172.21.60.179(123)
PAT Global 128.1.10.72(108) Local 172.21.56.125(123)
PAT Global 128.1.10.72(122) Local 172.21.156.122(123)
PAT Global 128.1.10.72(116) Local 172.21.198.207(123)
[output omitted]
Finding All Static Xlate Entries
To find all static xlate entries, use the following command:
Firewall# show xlate state static
The following command displays some of the xlate entries that have been configured with the static command:
Firewall# show xlate state static
Global 10.16.98.118 Local 172.16.100.99
Global 10.16.98.101 Local 172.21.192.116
Global 10.16.98.105 Local 172.17.197.66
Global 10.16.98.111 Local 172.17.232.74
Global 10.16.98.107 Local 172.20.196.434.
Finding All PAT Entries (Dynamic Xlates)
To find all PAT entries (dynamic xlates), use the following command:
Firewall# show xlate state portmap
For example, the following command displays all the dynamic PAT entries that are currently in the xlate table:
Firewall# show xlate state portmap
15723 in use, 26615 most used
PAT Global 68.163.1.2(10452) Local 172.16.104.89(4499)
PAT Global 68.163.1.2(10454) Local 172.16.40.111(1033)
PAT Global 68.163.1.2(10406) Local 172.16.96.91(1052)
Finding All Identity Entries
To find all identity entries (global and local addresses are identical), use the following command:
Firewall# show xlate state identity
For example, the following command displays all identity xlate entries that are currently in use:
Firewall# show xlate state identity
1 in use, 12 most used
Global 192.168.198.17 Local 192.168.198.17
Monitoring Connections
You can see what (if any) UDP and TCP connections have been established for a host by using a form of the show conn command. The command has the following syntax:
Firewall# show conn [state state_type] [{foreign | local} ip1[-ip2] netmask mask]
[long] [{lport | fport} port1[-port2]] [protocol {tcp | udp}]
With no additional keywords, show conn displays the entire conn table. On ASA and FWSM platforms, you can add the all keyword to show all connections in the table, including connections that terminate on the firewall itself.
For TCP connections, you can specify the connection state as state state_type, where the state type is one of the keywords listed in Table 11-14.
Table 11-14 TCP Connection State Types
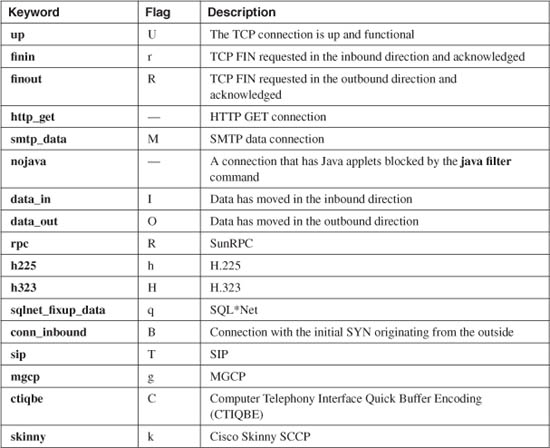
You can also specify the foreign or local IP address (or range of addresses) used in the connections, as well as the local port (lport) or foreign port (fport) or a range of ports. The IP protocol can also be given as tcp or udp.
With connections, “foreign” represents the host on the lower-security interface, and “local” is the address of the host on the higher-security interface. Table 11-15 lists the possible display formats.
Table 11-15 Display Formats Available with the show conn Command
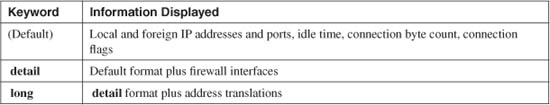
You can also display the current number of conn table entries with the following command:
Firewall# show conn count
The output from this command shows the total number of conn table entries, regardless of protocol. It is not possible to show a breakdown of entries by protocol (UDP and TCP, for example).
The show conn commands listed in the following sections display the protocol, foreign and local addresses and ports, connection idle time, connection data volume, and connection flags. Here is a brief example:
Firewall# show conn foreign 10.10.39.14
10449 in use, 577536 most used
TCP out 10.10.39.14:1033 in 192.168.29.37:524 idle 0:08:06 Bytes 11076 flags UIOB
You can also display similar information along with a listing of the connection flags by adding the detail keyword:
Firewall# show conn foreign 10.10.39.14 detail
10385 in use, 577536 most used
Flags: A - awaiting inside ACK to SYN, a - awaiting outside ACK to SYN,
B - initial SYN from outside, C - CTIQBE media, D - DNS, d - dump,
E - outside back connection, F - outside FIN, f - inside FIN,
G - group, g - MGCP, H - H.323, h - H.225.0, I - inbound data, i -
incomplete,
k - Skinny media, M - SMTP data, m - SIP media, O - outbound data,
P - inside back connection, q - SQL*Net data, R - outside acknowledged FIN,
R - UDP RPC, r - inside acknowledged FIN, S - awaiting inside SYN,
s - awaiting outside SYN, T - SIP, t - SIP transient, U - up
TCP outside:10.10.39.14/1033 inside:192.168.29.37/524 flags UIOB
Notice that the foreign and local host addresses are shown with the firewall interface names where they reside. If you are interested in which host (foreign or local) initiated the connection, you have to interpret the connection flags.
In the preceding example, you can determine the following facts from flags UIOB:
• U—The connection is up (fully established).
• I—Inbound data has been received from the foreign host.
• O—Outbound data has been sent from the local host.
• B—The initial TCP SYN flag came from the outside (foreign host). Therefore, the connection was initiated by the foreign host.
Because UDP is not connection-oriented, it is not possible to see which host initiated a UDP session.
Finding Conn Entries Based on a Foreign Address
To find conn entries based on a foreign address, use the following command:
Firewall# show conn foreign foreign_ip [netmask mask]
The foreign address foreign_ip is used to find all the relevant connections in the conn table. For example, you can use the following command to find all active conn table entries involving the foreign address 198.133.219.25 (http://www.cisco.com):
Firewall# show conn foreign 198.133.219.25
7046 in use, 57005 most used
TCP out 198.133.219.25:80 in 172.21.4.5:3050 idle 0:03:32 Bytes 10762 flags UIO
Firewall#
Finding Conn Entries Based on a Local Address
To find conn entries based on a local address, use the following command:
Firewall# show conn local local_ip [netmask mask]
For example, local address 172.16.193.187 is found to have the following open conn table entries:
Firewall# show conn local 172.16.193.187
17267 in use, 57005 most used
TCP out 147.208.14.61:80 in 172.16.193.187:4536 idle 0:00:03 flags UIO
TCP out 64.215.168.97:80 in 172.16.193.187:4538 idle 0:00:03 flags UIO
UDP outside:65.98.25.54:53 inside:172.16.193.187:51455 flags d
[output omitted]
Finding Conn Entries Based on Protocol Information
To find conn entries based on protocol information, use the following command:
Firewall# show conn protocol {tcp | udp} [fport foreign_port | lport local_port]
The following TCP connections using foreign port 1433 are currently in this firewall’s conn table:
Firewall# show conn protocol tcp fport 1433
TCP out 64.191.149.170:443 in 172.16.1.10:1988 idle 0:00:55 Bytes 0 flags saA
TCP out 160.109.67.70:443 in 172.16.1.11:1173 idle 0:03:56 Bytes 157428 flags UIO
TCP out 64.73.28.116:443 in 172.16.1.12:1294 idle 0:01:06 Bytes 921 flags UIO
[output omitted]
Monitoring Specific Hosts
If you are looking for stateful inspection information for a particular host, you can spend time sifting through the xlate and conn tables. However, there is a much more direct way to get this information in a single command:
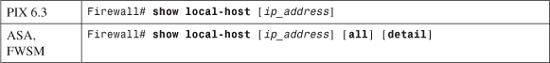
You can get information about any “local” host as long as it resides on a firewall interface with a security level greater than 0 and you know its IP address. In ASA and FWSM, a local host can reside on any firewall address, regardless of the security level. The firewall does all the table lookups for you and returns any information it finds. The output also includes any connection limits that might apply to the host.
If you do not specify an IP address, only a count of connections on each interface is displayed.
In the following example, information about the host at 172.18.10.10 is sought. This subnet has been defined as a static identity translation so that addresses 172.18.10.x on the inside also appear on the outside.
Firewall# show local-host 172.18.10.10
Interface inside: 15721 active, 15829 maximum active, 0 denied
local host: <172.18.10.10>,
TCP connection count/limit = 1/unlimited
TCP embryonic count = 0
TCP intercept watermark = unlimited
UDP connection count/limit = 0/unlimited
AAA:
Xlate(s):
Global 172.18.10.10 Local 172.18.10.10
Conn(s):
TCP out 172.16.3.14:53957 in 128. 172.18.10.10:23 idle 0:00:03 Bytes 545
flags UIOB
Firewall#
You can see the static identity xlate entry by the IP address appearing as both global and local under the Xlate(s) section. The local host had only one active connection—a Telnet session (indicated by “:23” for TCP port 23) from the foreign host 172.16.3.14.
The show local-host command is especially useful for local hosts that have dynamic xlate or PAT entries for outbound connections. In the following example, you are interested in the activities of the local host at 172.21.96.22. All inside local hosts are translated using the firewall’s outside interface address and dynamic port information.
Firewall# show local-host 172.21.96.22
Interface inside: 15725 active, 15829 maximum active, 0 denied
local host: <172.21.96.22>,
TCP connection count/limit = 176/unlimited
TCP embryonic count = 11
TCP intercept watermark = unlimited
UDP connection count/limit = 0/unlimited
AAA:
Xlate(s):
PAT Global 207.246.96.46 (44112) Local 172.21.96.22(1168)
PAT Global 207.246.96.46 (44120) Local 172.21.96.22(1176)
PAT Global 207.246.96.46 (58859) Local 172.21.96.22(1293)
PAT Global 207.246.96.46 (29899) Local 172.21.96.22(1339)
PAT Global 207.246.96.46 (33585) Local 172.21.96.22(1469)
[output deleted]
Conn(s):
TCP out 217.123.215.64:6883 in 172.21.96.22:1168 idle 0:00:21 Bytes 15918696
flags UIO
TCP out 66.127.201.130:6881 in 172.21.96.22:1176 idle 0:00:22 Bytes 24003969
flags UIO
TCP out 219.111.75.71:6881 in 172.21.96.22:1293 idle 0:00:58 Bytes 730251
flags UIO
TCP out 156.34.72.34:6881 in 172.21.96.22:1339 idle 0:00:58 Bytes 4969
flags UIO
TCP out 200.104.11.50:6883 in 172.21.96.22:1469 idle 0:00:19 Bytes 4744
flags UIO
[output omitted]
Here, you find that local host 172.21.96.22 has 176 active (and established) TCP connections to foreign hosts. As well, the firewall has tracked 11 TCP connections that are embryonic or half-opened. This can be a cause of concern if many embryonic connections are opened to the local host. The firewall is using its default settings and allowing an unlimited number of embryonic connections to be attempted.
The show local-host command has also conveniently summarized all xlate entries involving host 172.21.96.22 so that you can see all the local and foreign port number pairs being used. Below that, all its active connections are summarized, as if you had used the show conn command.
By default, the show local-host command does not display any connections that are active to or from the firewall itself. You can add the all keyword to display all the local host’s active connections—including those that terminate or originate at the firewall. The firewall interfaces can be considered as local hosts too.
In the following example, a client (172.21.4.60) on the firewall’s outside interface (172.16.1.1) has opened an SSH connection to the firewall. Notice that the firewall interface name NP Identity Ifc is displayed as the interface where the SSH connection terminates.
Firewall# show local-host 172.16.1.1 all
Interface dmz: 0 active, 0 maximum active, 0 denied
Interface inside: 0 active, 1 maximum active, 0 denied
Interface outside: 1 active, 14 maximum active, 0 denied
Interface NP Identity Ifc: 1 active, 2 maximum active, 0 denied
local host: <172.16.1.1>,
TCP flow count/limit = 0/unlimited
TCP embryonic count to (from) host = 0 (0)
TCP intercept watermark = unlimited
UDP flow count/limit = 0/unlimited
Conn:
TCP out 172.21.4.60:3244 in 172.16.1.1:22 idle 0:00:00 bytes 621703 flags UIOB
Firewall#
Clearing Xlate Table Entries
On several occasions, the xlate table might contain stale or incorrect entries. This can happen if you make configuration changes to the static, global, or nat commands on a firewall or to an interface access list. As soon as that happens, it is likely that the xlate table has existing entries that use previous or outdated translations.
For example, if several hosts are using Telnet connections, and a new policy is added to an access list to deny the Telnet protocol, new Telnet connections are blocked. The existing connections remain open until the application closes them or until the firewall idles them out. Therefore, the xlate entries and the corresponding conn table entries for the active Telnet sessions remain active too. Those entries must be cleared manually if the policy needs to be enforced immediately.
You can clear xlate entries manually, either one at a time or the whole table at once. Use one of the following commands:
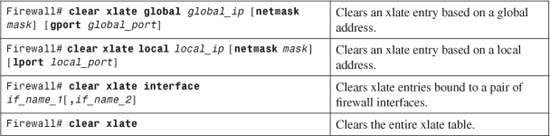
Although this is a quick way to flush the entire xlate table, you should be careful. Any active connections using the address translations are dropped immediately. This means that users could see applications or sessions terminate in the middle of important work.
If you must clear the xlate table, do so at a time of low usage or during a downtime window.
Adjusting Table Timeout Values
You can also adjust various idle timers that affect address translations and connections maintained by the firewall. Use the following commands if you feel a timeout adjustment is needed:
• Xlate entry timer:
Firewall(config)# timeout xlate hh[:mm[:ss]]
By default, xlate entries involving TCP connections are be deleted after they have been idle (no data passed) for 3 hours. The minimum idle time is 1 minute, but the xlate idle timer cannot be set to a value that is less than the uauth timer (the default is 5 minutes).
Xlate portmap (PAT) entries created for UDP always idle out after 30 seconds. This idle timer cannot be configured.
• TCP conn entry timer:
Firewall(config)# timeout conn hh[:mm[:ss]]
Conn table entries for TCP connections idle out after 1 hour by default. The minimum idle period is 5 minutes. You can use a time value of 0:0:0 or 0 to indicate that TCP conn entries should never time out. In that case, TCP connections must close themselves when both hosts exchange FIN flags.
• TCP half-closed conn entry timer:
Firewall(config)# half-closed hh[:mm[:ss]]
A TCP connection is half-closed if only one of the pair of hosts signals a connection termination with its FIN flag. If the other host does not respond with its FIN handshake, the firewall goes ahead and closes the connection after an idle period.
By default, half-closed connections are deleted after 10 minutes. The minimum idle time is 5 minutes.
Note
Half-open TCP connections (also called embryonic connections) result if only one of the pair sends the TCP SYN flag. The firewall automatically closes half-open connections if a fixed period of 2 minutes elapses before the three-way TCP handshake completes.
• UDP conn entry timer:
Firewall(config)# udp hh[:mm[:ss]]
UDP sessions, because they are connectionless, must simply time out. No mechanism exists for one host to close or terminate a UDP session. By default, a firewall deletes a UDP conn entry after it has been idle (no data passing) for 2 minutes. The minimum idle time is 1 minute.
Step 7: Look for Active Shuns
A Cisco firewall can shun (block) traffic coming from specific source addresses on an interface. This feature is useful when a host is generating malicious traffic and needs to be stopped. If you have manually added shuns to your firewall, or if another system has added them automatically, you might forget that they are in place.
In fact, when shuns are defined, they are dynamic in nature and are not added to the firewall configuration. If you are troubleshooting why a host is not receiving or sending any traffic, you might not find the reason by looking through the firewall configuration.
You can display a list of active shuns with the following EXEC command:
Firewall# show shun [src_ip]
If you provide a specific source address src_ip, only shuns involving that address are shown.
You can also look at shun activity and duration with the following command:
Firewall# show shun statistics
To delete a shun, you can use the following EXEC command:
Firewall# no shun src_ip [dst_ip sport dport [protocol]]
You must provide the source address (src_ip). The destination address (dst_ip), source and destination ports, and protocol are all optional. If they are omitted, 0s are assumed in those fields.
For example, suppose a user has called to report that her host at 172.21.196.38 cannot reach the public network. You have trouble locating the cause of the problem until you look at a list of the active shuns on the firewall:
Firewall# show shun
Shun 172.16.44.59 0.0.0.0 0 0
Shun 172.20.36.62 0.0.0.0 0 0
Shun 172.31.69.84 0.0.0.0 0 0
Shun 172.21.196.38 0.0.0.0 0 0
Shun 172.18.77.186 0.0.0.0 0 0
Shun 172.16.103.161 0.0.0.0 0 0
Shun 172.16.100.166 0.0.0.0 0 0
Shun 172.21.196.230 0.0.0.0 0 0
Shun 172.16.73.135 0.0.0.0 0 0
Firewall#
Firewall# show shun statistics
stateful=OFF, cnt=0
dmz2=OFF, cnt=0
outside=OFF, cnt=210499
inside=ON, cnt=2605814591
Shun 172.16.44.59 cnt=269, time=(392:44:35)
Shun 172.20.36.62 cnt=125493, time=(392:44:35)
Shun 172.31.69.84 cnt=49384, time=(392:44:35)
Shun 172.21.196.38 cnt=80694744, time=(392:44:35)
Shun 172.18.77.186 cnt=36524, time=(392:44:35)
Shun 172.16.103.161 cnt=1021, time=(392:44:35)
Shun 172.16.100.166 cnt=9835, time=(392:44:35)
Shun 172.21.196.230 cnt=52, time=(392:44:35)
Shun 172.16.73.135 cnt=321282, time=(392:44:35)Firewall#
The shun in question (shaded in the output) has been quite active, blocking 80,694,744 packets since it was defined more than 392 hours ago. When you have determined that it is safe to delete that shun, you can use the following command:
Firewall# no shun 172.21.196.38
Tip
Keep in mind that shun definitions are dynamic in nature. You should keep an offline list of all the shuns you add manually. If the firewall loses power or reloads, or a failover condition occurs, all the active shuns are lost. In other words, you have to reconfigure them as soon as you realize they are no longer active.
As a long-term plan, you should consider converting the shuns into access list entries so that they become part of the firewall configuration. This makes them more permanent and leverages the firewall’s capability to generate Syslog information about their activity.
Step 8: Check User Authentication
You can configure user authentication in several forms on a Cisco firewall. Refer to the information in the following sections to verify that authentication is working properly.
Authentication Proxy (Uauth)
If your firewall is configured as an authentication proxy, a loss of connectivity might be related to authentication problems. You can view the active authenticated users with the show uauth command. Any users who have successfully authenticated are shown, along with their IP addresses and uauth timeout values:
Firewall# show uauth
Current Most Seen
Authenticated Users 1 1
Authen In Progress 0 1
user 'hucaby' at 192.168.199.33, authenticated
absolute timeout: 0:05:00
inactivity timeout: 0:00:00
Firewall#
If a user is listed as authenticated but is unable to connect through the firewall, there might be a problem with authorization. For example, a AAA server could be downloading an authorization filter or ACL name associated with the user, but that ACL is not defined on the firewall. If this is the case, the Syslog server should show a message similar to this:
Feb 26 2004 21:55:42 Firewall : %ASA-3-109016: Can't find authorization ACL
'engineering' on 'ASA' for user 'hucaby'
If you do find a problem with a user’s authentication session, you can clear that person from the uauth table with the clear uauth username command.
If no users are being successfully authenticated through the firewall, you should look on a more fundamental level. Make sure the firewall can communicate with the proper RADIUS or TACACS+ server. You can use the debug aaa authentication command to watch debug messages on the firewall console or Telnet session as a user tries to authenticate.
For example, suppose a firewall is configured to query a RADIUS server (192.168.11.49) for user authentication. A user named hucaby is getting an authentication prompt from the firewall but is being rejected. The debug aaa authentication command produces the following output:
Firewall# debug aaa authentication
Firewall# 34: Received response: , session id 201242794
35: Making authentication request for host 192.168.11.49, user , session id:
201242794
36: Processing challenge for user , session id: 201242794, challenge: Please
register for access
Username:
37: sending challenge to user: , challenge: Please register for access
Username: , session id: 201242794
38: Received response: hucaby, session id 201242794
39: Making authentication request for host 192.168.11.49, user hucaby, session id:
201242794
40: Processing challenge for user hucaby, session id: 201242794, challenge:
Password:
41: sending challenge to user: hucaby, challenge: Password: , session id:
201242794
42: Received response: , session id 201242794
43: Making authentication request for host 192.168.11.49, user hucaby, session id:
201242794
44: Authentication failed for user :hucaby, pass :firewallzrc00l, session id:
201242794
45: retrying Authentication for user :hucaby, pass : firewallzrc00l, session id:
201242794
46: Received response: , session id 201242794
47: Making authentication request for host 192.168.11.49, user , session id:
201242794
48: Processing challenge for user , session id: 201242794, challenge: Please
register for access
Username:
49: sending challenge to user: , challenge: Please register for access
Username: , session id: 201242794
The user is being prompted for login credentials, and you can see how the firewall is communicating the userID and then the password to the RADIUS server. The highlighted message indicates that the RADIUS server has rejected the user’s information because the password is incorrect. In fact, the password entered by the user is displayed in the debug output.
Content Filtering
Another area to look at is content filtering through Websense or N2H2. If one of these services denies a user’s access to a URL, you should check the server’s configuration for that user or user group.
At the most basic level, you should see evidence that the firewall is talking to the content-filtering server. You can use the show url-server stats command. If the counters shown are nonzero and are increasing with user traffic, the content-filtering communication is working properly, as shown in this example:
Firewall# show url-server stats
URL Server Statistics:
----------------------
Vendor websense
URLs total/allowed/denied 420691/363332/57359
HTTPSs total/allowed/denied 0/0/0
FTPs total/allowed/denied 0/0/0
URL Server Status:
------------------
192.168.204.17 UP
URL Packets Sent and Received Stats:
-----------------------------------
Message Sent Recieved
STATUS_REQUEST 310338 309198
LOOKUP_REQUEST 416011 414554
LOG_REQUEST 0 NA
-----------------------------------
Firewall#
If the firewall is having trouble reaching the content-filtering server, you might see one of the following Syslog messages:
%ASA-2-304007: URL Server IP_address not responding, ENTERING ALLOW mode.
%ASA-3-304003: URL Server IP_address timed out URL url
%ASA-3-304006: URL Server IP_address not responding
%ASA-6-304004: URL Server IP_address request failed URL url
As soon as the content-filtering server again can be reached, you should see this Syslog message:
%ASA-2-304008: LEAVING ALLOW mode, URL Server is up.
Step 9: See What Has Changed
If you have installed, configured, and tested a firewall, trusted users should be able to pass through it according to the security policies. At the same time, the firewall should deny or drop all untrusted users and traffic. Suppose things have been working like this for some time, but one day users begin to call and complain.
One possible cause of a problem is that someone somewhere has changed something on your network. One good troubleshooting approach is to ask, “What changed during the time when problems began to occur?”
In the case of a firewall, it is entirely possible that someone has made a change to the configuration, especially if you work with a staff of other firewall administrators. How can you determine if a change was made and who made it?
1. Implement an orderly change-management process. If an administrator needs to alter a firewall configuration, the change should be announced in advance, approved by peer review, and performed at an expected time. Records of the change-management activity should be kept as an audit trail.
2. Keep copies of the firewall configuration archived. As each change is made, archive the new configuration. Not only will you have an additional audit trail, but you also will make a downgrade situation easier if you need to back out of a large configuration change.
3. Use AAA authentication for firewall management access. This forces each firewall administrator to have a unique user ID and password, which makes management access more secure.
In addition, the firewall generates an audit trail each time a configuration change is made or a command is executed. AAA authentication should always be used in conjunction with Syslog collection for the sole purpose of maintaining a thorough audit trail.
When AAA authentication is not used, firewall administrators and users take on the generic identity enable_1 (privilege level 1) when they first log in. After using the enable command, users take on the generic identity enable_15 (privilege level 15). Naturally, when AAA authentication is used, users appear as their own user IDs.
If you were trying to sift through the Syslog records to see who made changes to a firewall configuration, which of these messages would be more useful?
Feb 26 2007 08:06:30 Firewall-A : %ASA-5-111008: User 'enable_15' executed
the 'clear xlate' command.
Feb 26 2007 08:09:13 Firewall-A : %ASA-5-111008: User 'enable_15' executed
the 'no access-list acl_outside' command.
or
Feb 26 2007 08:06:30 Firewall-A : %ASA-5-111008: User 'hucaby' executed the
'clear xlate' command.
Feb 26 2007 08:09:13 Firewall-A : %ASA-5-111008: User 'hucaby' executed the
'no access-list acl_outside' command.
Clearly, you would like to track down user hucaby to see why he cleared the xlate table and deleted the ACL applied to the outside interface at the start of the business day.