Chapter 10. Firewall Logging
Refer to the following sections for information about these topics:
• 10-1: Managing the Firewall Clock—Discusses ways to set and maintain the firewall’s internal clock so that events and messages can have accurate time stamps.
• 10-2: Generating Logging Messages—Explains how firewalls generate logging messages and how you can configure them to do that.
• 10-3: Fine-Tuning Logging Message Generation—Covers the configuration steps that can be used to enable or disable specific logging messages or change their severity levels. This section also discusses how to configure access list activity logging.
• 10-4: Analyzing Firewall Logs—Provides an overview of how you can approach collecting and analyzing the logging messages that firewalls produce.
Cisco firewalls and security appliances can be configured to generate an audit trail of messages describing their activities. Firewall logs can be collected and analyzed to determine what types of traffic have been permitted or denied, what users have accessed various resources, and so on.
This chapter presents the tasks that are necessary to begin generating and collecting logging messages.
10-1 Managing the Firewall Clock
A Cisco firewall keeps an internal clock that can be used for Syslog time stamps, certificate time stamps, and so on. The clock is powered by a battery in the absence of regular power.
The internal clock is always based on Coordinated Universal Time (UTC). UTC was previously known as Greenwich Mean Time (GMT).
You can set the system time using two different approaches:
• Manually—You set the time and date on the firewall along with the time zone and specify whether to observe daylight savings time. With manual configuration, the firewall clock is only as accurate as the internal clock hardware.
• Using Network Time Protocol (NTP)—This is a protocol defined by RFC 1305 that provides a mechanism for the devices in the network to get their time from an NTP server. With NTP, all the devices are synchronized to a common, trusted source and keep very accurate time.
NTP uses the concept of stratum to determine how close an NTP server is to an authoritative time source (an atomic or radio clock). Stratum 1 means that an NTP server is directly connected to an authoritative time source. NTP also compares the times reported from all configured NTP peers and does not listen to a peer that has a significantly different time.
NTP associations with other NTP peers can be protected through an encrypted authentication.
Tip
NTP version 3 is based on RFC 1305 and uses UDP port 123. Information about public NTP servers and other NTP subjects can be found at http://www.ntp.org.
You can also use a commercial product as your own stratum 1 time source. For example, Symmetricom (http://www.ntp-systems.com/products.asp) offers several NTP time servers that are based on Global Positioning Satellite (GPS) signals.
Setting the Clock Manually
1. (Optional) Identify the time zone:
Firewall(config)# clock timezone zone-name hours [minutes]
zone-name is the time zone (an arbitrary text string such as EST) and is hours (0 to 12 or 0 to 12) and optionally minutes offset from UTC. For example, Eastern Standard Time in the U.S. is 5 hours behind UTC and would be configured as follows:
Firewall(config)# clock timezone EST -5
2. (Optional) Set daylight savings time (DST or summer time) parameters.
a. Use the following command if daylight savings time recurs at regular intervals:
Firewall(config)# clock summer-time zone recurring [week weekday month
hh:mm week weekday month hh:mm] [offset]
If daylight savings time begins and ends on a certain day and week of a month, you can use this command. The name of the daylight savings time zone is given as zone (an arbitrary name or abbreviation, such as EDT). The week number week (1 to 4 or the words “first” and “last”), the name of the weekday, the name of the month (only the first three letters matter), and the time hh:mm in 24-hour format can all be given to start and stop daylight savings time. The offset value gives the number of minutes to add during daylight savings time (the default is 60 minutes).
For example, until 2007, daylight savings time in the United States began at 2 a.m. on the first Sunday in April and ended at 2 a.m. on the last Sunday in October. That recurring DST schedule could be defined with this command:
Firewall(config)# clock summer-time EDT recurring first Sunday april
2:00 last Sunday oct 2:00
Beginning in 2007, the United States began using a modified schedule where DST starts at 2 a.m. on the second Sunday in March and ends at 2 a.m. on the first Sunday in November. The modified DST schedule could be defined with the following command:
Firewall(config)# clock summer-time EDT recurring second sunday march
2:00 first sunday nov 2:00
Tip
You can use the recurring keyword with no other arguments for any of the U.S. and Canadian time zones. The correct begin and end dates are used automatically. For the preceding example, you could define daylight savings time as follows:
Firewall(config)# clock summer-time EDT recurring
Be aware that this default recurring schedule is based on the U.S. DST standard that was in effect when the firewall code was released. For example, ASA release 7.2(1) uses the default DST based on the older April/October schedule, while releases 7.2(1)27 and later use the newer March/November schedule.
To make sure your firewall is using the current or correct DST schedule, do not use the default schedule; rather, you should enter the clock summer-time command with specific dates and times.
b. If daylight savings time occurs at specific times, you can use the following command to specify the exact date and time that daylight savings time begins and ends in a given year:
Firewall(config)# clock summer-time zone date {day month | month day}
year hh:mm {day month | month day} year hh:mm [offset]
This command is useful if the begin and end times change from year to year. Specify the year number as year (four digits, 1993 to 2035).
3. Set the firewall clock:
Firewall(config)# clock set hh:mm:ss {day month | month day} year
The clock is set when this command is executed. The time is given in 24-hour format, day is the day number (1 to 31), month is the name of the month (only the first three letters are needed), and year is the full four-digit year. The day and month parameters can be reversed, according to what is customary.
4. Verify the clock:
Firewall# show clock [detail]
The current time and date are shown. If you use the detail keyword, the source of the time (“hardware calendar” is the internal battery-operated clock) and any daylight savings time definitions are shown, as in this example:
Firewall# show clock detail
00:04:48.218 EDT Mon Mar 19 2007
Time source is hardware calendar
Summer time starts 02:00:00 EST Sun Mar 11 2007
Summer time ends 02:00:00 EDT Sun Nov 4 2007
Firewall#
Setting the Clock with NTP
Tip
In ASA multiple-context mode, NTP must be configured on the system execution space only. All the other contexts (both admin and user) obtain their clock information from the system execution space, because all the contexts exist in the same physical firewall. You can use the changeto system command to move your session into the system execution space before using the following configuration steps.
The Firewall Services Module (FWSM) does not have a standalone clock, and it does not support NTP. Because it is a module inside a Catalyst 6500 chassis, it relies on the switch clock instead. Therefore, you should make sure the switch Supervisor has been configured for NTP as an accurate clock source.
1. (Optional) Use NTP authentication.
a. Define an authentication key:
Firewall(config)# ntp authentication-key key-number md5 value
An MD5 authentication key numbered key-number (1 to 4294967295) is created. The key is given a text-string value of up to eight cleartext characters. After the configuration is written to Flash memory, the key value is displayed in its encrypted form.
You can repeat this command to define additional keys if needed.
b. (Optional) Identify a key to expect from all defined NTP servers:
Firewall(config)# ntp trusted-key key-number
Remote NTP peers must authenticate themselves with the firewall using the authentication key numbered key-number (1 to 4294967295), as defined in Step 1a. If this command is used, any NTP server must supply this key to the firewall before its time update information is accepted. You can repeat this command to identify additional keys to expect. (Trusted keys can also be defined on a per-server basis in Step 2.)
c. Enable NTP authentication:
Firewall(config)# ntp authenticate
2. Specify an NTP server:
Firewall(config)# ntp server ip-address [key number] [source if-name]
[prefer]
The NTP peer (server) is identified at ip-address. If you are using NTP authentication, you can use the key keyword to identify which authentication key to expect from this server. (See Step 1a.) By default, the firewall sends NTP packets on the interface derived from its routing table. You can specify an interface to use with the source keyword and the interface named if-name (outside or inside, for example).
You can repeat this command to define more than one NTP server. If one server is down or unavailable, a second or third server could be used to synchronize time. You can use the prefer keyword to indicate one NTP server that is preferred if multiple NTP servers are configured.
Tip
Actually, a firewall using NTP can use its associations with several servers to derive a more accurate idea of the time. If possible, you should configure a minimum of three different NTP servers so that your firewall can determine if any one of them is inaccurate.
3. Verify NTP operation.
![]()
This command displays the commands but not any information about NTP operation, as in this example:
Firewall# show running-config ntp
ntp authentication-key 1 md5 *
ntp authentication-key 2 md5 *
ntp authenticate
ntp server 192.168.254.4 key 1 source inside prefer
ntp server 192.168.254.3 key 2 source inside
Firewall#
Notice that the MD5 hash keys are automatically hidden from being displayed in the configuration. Instead, only an asterisk is shown.
a. Verify the current NTP status:
Firewall# show ntp status
NTP should be in the synchronized state if the firewall has successfully authenticated and exchanged information with at least one NTP server. This command shows this in the first line of output, as shown in the following example. Notice that the firewall has become a stratum 4 time source itself, deriving its time information from a higher (lower-stratum) authority:
Firewall# show ntp status
Clock is synchronized, stratum 4, reference is 192.168.254.4
nominal freq is 99.9984 Hz, actual freq is 99.9984 Hz, precision is 2**6
reference time is c34d3659.655d8a23 (14:28:25.395 EST Fri Oct 31 2003)
clock offset is 10.8642 msec, root delay is 87.74 msec
root dispersion is 15927.54 msec, peer dispersion is 15875.02 msec
Firewall#
If the clock is unsynchronized, the firewall has not yet authenticated or synchronized its time clock with an NTP server. Keep checking the status every minute or so to see if the clock becomes synchronized. If it does not, confirm your NTP configuration and authentication keys.
b. View all NTP server associations:
Firewall# show ntp associations [detail]
The firewall clock becomes synchronized with only one NTP server. However, it keeps an association with each NTP server that is configured. NTP continuously compares clock information from all known servers so that it can maintain the most accurate time. In the following example, the firewall has associations with two NTP servers:
Firewall# show ntp associations
address ref clock st when poll reach delay offset
disp
*~192.168.254.4 198.82.162.213 3 21 64 3 14.8 10.86
7889.6
+~192.168.254.3 198.82.162.213 3 10 64 3 2.5 0.31
7881.1
* master (synced), # master (unsynced), + selected, - candidate,
~ configured
Firewall#
Notice that the two NTP servers are shown (each is stratum 3 in the st column), along with the reference clock that each uses. Here, 192.168.254.4 has become the preferred, or “master,” source of synchronization, designated by the * flag. The 192.168.254.3 server is marked with +, indicating that it is selected for possible synchronization.
If you find that some of the server addresses are not selected or synchronized, you can get more information about the failed associations by adding the detail keyword.
Tip
If you are having trouble getting a firewall to synchronize its clock, you can use the debug ntp authentication EXEC command (if the NTP server requires authentication) or the debug ntp {events | select | sync} command to watch the exchange of NTP information. The debug output is shown only in the “debug trace” channel, which is usually the first Telnet or SSH session active on the firewall. If there are no Telnet or SSH sessions, the output is sent to the console.
10-2 Generating Logging Messages
The firewall uses logging to send system messages to one or more logging destinations, where they can be collected, archived, and reviewed.
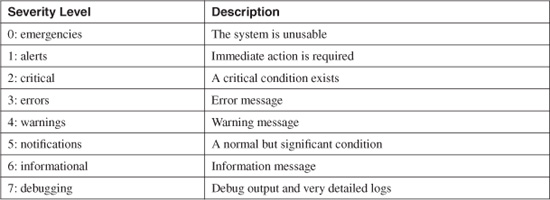
Messages are generated according to a severity level, specified by a number (0 through 7) or a keyword, as shown in Table 10-1.
Table 10-1 System Message Severity Levels
Logging messages can be sent to any of the following destinations:
• The firewall console
• Telnet or SSH sessions to the firewall
• A temporary buffer internal to the firewall
• SNMP management stations
• Syslog servers
• Firewall management applications such as Cisco Adaptive Security Device Manager (ASDM) and Cisco PIX Device Manager (PDM)
• E-mail addresses (ASA 7.0 and above, FWSM 3.1[1] and above)
• An FTP server (ASA 7.0 and above, FWSM 3.1[1] and above)
• Firewall flash (ASA 7.0 and above, FWSM 3.1[1] and above)
The logging level can be set to determine which messages should be sent to each of the destinations. When you set a severity level for a destination, all messages with a lower severity level are also sent.
Alternatively, you can adjust the severity level for the logging destination so that a lower value is used. This reduces the number and type of messages produced but also reduces the amount of useful information that can be collected and analyzed.
You should always add time stamps to Syslog messages to help in real-time debugging and management. The firewall can add time stamps as messages are generated, or a Syslog server can add time stamps as messages are received.
Tip
You should have all your network devices use a common time reference point so that all the time stamps on all logging messages are synchronized. You can do this by configuring firewalls, routers, and switches to use one or more authoritative NTP servers as a time source.
If you have some NTP servers inside your network, each network device can synchronize time with them. However, if you intend to use NTP servers on the public Internet, you should use a hierarchical approach. Select two routers within your network to synchronize time with the Internet servers. Optimally, each router should peer with three unique time sources so that none of them are duplicated.
Then point all your inside devices to synchronize time with the routers. The idea is to contain the bulk of NTP synchronizations within your network rather than have a multitude of hosts peering with the Internet servers.
You can configure a unique “device ID” so that logging messages from a firewall can be readily identified. This becomes important when one Syslog server collects messages from many different firewalls, routers, and switches.
Figure 10-1 shows each of the logging severity levels, along with a general list of the types of messages generated. Each level also includes every level below it. The higher the severity level, the more types of messages that are included.
System messages are logged in either the default or EMBLEM format. Figure 10-2 shows the default message format. Each message has the following fields:
• Time stamp—The date and time from the firewall clock. The default is no time stamp.
• Device ID—Added to uniquely identify the firewall generating the message. Can be the firewall’s host name, an interface IP address, or an arbitrary text string. The default is no device-id.
• Message ID—Always begins with %PIX-, %ASA-, or %FWSM-, followed by the severity level and the six-digit message number.
• Message text—A description of the event or condition that triggered the message.
The EMBLEM format is used primarily for the CiscoWorks Resource Manager Essentials (RME) Syslog analyzer. This format matches the Cisco IOS Software Syslog format produced by routers and switches. It is available only to UDP Syslog servers.
Figure 10-1 Syslog Severity Levels and Their Messages
Note
By default, logging to a Syslog server uses UDP port 514. You can also select TCP along with a specific port number for reliable logging. Sending logging messages via SNMP traps uses UDP port 162. UDP is usually used as an efficient, “best-effort” method. TCP can be used when Syslog collection is a vital part of enterprise security, because its delivery is reliable.
The six-digit message numbers are arbitrarily defined by Cisco and uniquely identify each logging message. You can look up message numbers and their meanings in Appendix B, “Security Appliance Logging Messages.”
Syslog Server Suggestions
To make full use of the logging messages generated by a firewall, you need a Syslog server application running somewhere in your network. Some recommendations for Syslog servers are as follows:
• Kiwi Syslog Daemon—A commercial Syslog server for Windows-based platforms, available at http://www.kiwisyslog.com
Figure 10-2 Firewall Logging Message Format
• UNIX syslogd—A Syslog daemon built into most versions of the UNIX operating system
• Cisco PIX Firewall Syslog Server (PFSS)—A Syslog server available in the Cisco.com Software Center under PIX Firewall Software
• CiscoWorks 2000—A Syslog server built into the RME module of the base CiscoWorks 2000 package
• CiscoWorks VPN/Security Management Solution (VMS)—A Syslog server available as a part of the Monitoring Center for Security component of VMS
• Syslog server—Available as a part of the Network Security Analyzer and FirewallAnalyzer products from eIQnetworks at http://www.eiqnetworks.com
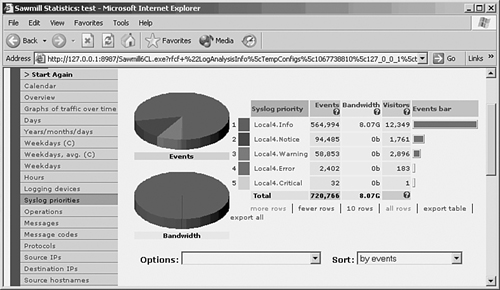
• Sawmill—A Syslog server and analysis application that runs on a wide variety of platforms, available from FlowerFire at http://www.sawmill.net
If you have a large network with firewalls that generate a large amount of Syslog information, an average Syslog server software application might become overwhelmed with the load. The end result is that logging messages are lost or that the Syslog server runs out of storage space.
In this case, you should consider moving the Syslog resources to a hardware platform. Some examples of hardware appliances are as follows:
• Cisco CS-MARS—Appliances that offer Syslog collection and analysis, along with many other security analysis and mitigation features, at a high volume. Available from Cisco Systems at http://www.cisco.com/en/US/products/ps6241/index.html.
• LogLogic—Appliances that offer real-time Syslog collection and analysis in a high volume environment. Available from LogLogic at http://www.loglogic.com.
• Network Intelligence Engine—Appliances that collect, analyze, and manage Syslog messages at a high volume. Available from Network Intelligence Corporation at http://www.network-intelligence.com.
Logging Configuration
A firewall can be configured to send logging information to one or more destinations. In PIX 6.3 and FWSM 2.2, each destination can have only one severity level associated with it, so only messages at or below that severity level are actually sent.
This tends to limit any customization if you need to filter or collect only specific types of information at a destination. For example, if you set a Syslog server destination to collect messages at or below the “notifications” level, you cannot collect any useful information from messages that have a default severity of “informational.”
To get around this, you can adjust the default severity level of individual logging message IDs. Suppose your destination is configured to collect at level “notifications.” There might be some useful messages that have a default level of “informational” or “debugging” that would not be sent to that destination because their default severity levels are greater than that of the destination. You can change those message IDs to have a new severity level of “notifications” so that they are sent too.
Firewall releases beginning with ASA 7.0 and FWSM 3.1(1) include more flexible logging functionality. As before, each logging destination can have one overall severity threshold. If any message is generated, it is sent only if its severity level is at or below this threshold.
However, logging destinations can have a severity threshold that is dependent on several conditions. Think of this as defining a logging policy for a destination, where you can pick and choose messages to be collected based on certain criteria. For each destination, you can assign one of the following:
• An overall severity level threshold
• A logging policy, defined as a “logging list”
The logging list is made up of one or more policy statements. When a logging message is generated, it is sent if any policy statement is matched. A logging list can be made up of any of the following:
• A severity level threshold for specific classes of messages
• An overall severity level threshold
• Specific logging message IDs to match against
In addition, you can configure messages from a predefined class of messages to appear at one or more destinations at configurable severity levels. Any message within the logging class is sent to a destination if it is at or below the severity level threshold configured for that destination.
You can use the following predefined classes of logging messages:
• auth—User authentication messages
• bridge—Transparent firewall messages
• ca—PKI certificate authority messages
• citrix—Citrix client messages
• config—Firewall configuration and EXEC commands via the command-line interface (CLI)
• csd—Cisco Secure Desktop messages
• dap—Dynamic Access Policy messages
• eap—EAP for Network Admission Control messages
• eapoudp—EAP over UDP for Network Admission Control messages
• eigrp—EIGRP routing protocol messages
• email—E-mail proxy messages
• ha—Failover messages
• ids—Intrusion Detection System messages
• ip—TCP/IP inspection messages
• nac—Network Admission Control messages
• nacpolicy—NAC policy messages
• nacsettings—NAC policy settings messages
• np—Network processor messages
• ospf—OSPF routing messages
• rip—RIP routing messages
• rm—Firewall Resource Manager messages
• session—Firewall user session messages
• snmp—SNMP messages
• ssl—SSL stack messages
• svc—SSL VPN client messages
• sys—System messages
• vm—VLAN mapping messages
• vpdn—PPTP and L2TP session messages
• vpn—IKE and IPSec messages
• vpnc—VPN client messages
• vpnfo—VPN failover messages
• vpnlb—VPN load-balancing messages
• webfo—WebVPN failover messages
• webvpn—WebVPN client messages
Logging policies and logging class definitions are configured in Steps 2 and 3, respectively.
Configuring Basic Logging Parameters
Before you configure a firewall to send logging messages to specific destinations, you should configure some basic logging parameters. Use the following configuration steps to prepare the firewall:
1. Enable message logging:
![]()
By default, logging is globally disabled, even if it is configured for one or more destinations. To begin logging, you must use this command.
2. (Optional) Limit the rate at which logging messages are generated:
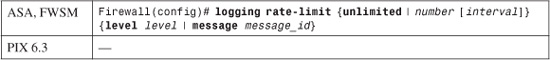
You can rate-limit messages being generated at a specific severity level by using the level keyword, where level is emergencies (0), alerts (1), critical (2), errors (3), warnings (4), notifications (5), informational (6), or debugging (7). Note that this affects messages only at the severity level specified. Messages at lower or higher levels are not rate-limited.
You can also rate-limit specific messages being generated with the message keyword, where message_id is a six-digit number (as defined in Appendix B).
Logging messages meeting these criteria are sent at a maximum of number (0 to 2147483647, where 0 is unlimited) messages per interval (0 to 2147483647) seconds. The interval defaults to 1 second if not specified. By default, rate limiting is unlimited on all platforms.
For example, the following commands limit all debugging (severity level 7) messages so that up to 50 message per second are generated. In addition, message ID 106015 (deny TCP/no connection) is limited to 10 messages per second.
Firewall(config)# logging rate-limit 50 1 level debugging
Firewall(config)# logging rate-limit 10 1 message 106015
Note
Rate limiting is applied to a severity level or message ID. It is not applied to a destination. Therefore, rate limiting affects the volume of messages being sent to all configured destinations.
3. Define a logging policy with an event list.
The event list is defined by its name and can consist of one or more logging list commands. Logging messages are matched against the event list as they are generated. If a match is found, the message is allowed to be sent.
Logging lists can be configured with the commands shown in this step. A logging list policy is actually applied when the severity level is configured for a specific logging destination in Steps 4 through 9 in this list.
Tip
If a logging list has been configured and applied to a destination, it cannot be modified until it is removed or unbound from the destination. You can unbind a logging list by reissuing the logging destination level command, omitting the logging list name.
a. (Optional) Match against a severity level:
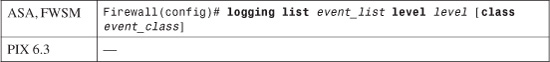
The event list named event_list matches any Syslog message at or below one of the following severity level keywords or numbers: emergencies (0), alerts (1), critical (2), errors (3), warnings (4), notifications (5), informational (6), or debugging (7).
You can also narrow the matching criteria by using a predefined “class” of Syslog message types. Use the class keyword with one of the following event_class names: auth, bridge, ca, config, ha, ids, ip, np, ospf, rip, rm, session, snmp, sys, vpdn, vpn, vpnc, vpnfo, vpnlb, or webvpn.
For example, the following commands can be used to match all logging messages at the notifications level and all IP-related messages (xlate and conn build/teardown and ACL activity) at the debugging level. Now the destination can collect various types of messages from multiple severity levels.
Firewall(config)# logging list MyList level notifications
Firewall(config)# logging list MyList level debugging class ip
b. (Optional) Match specific Syslog message IDs:

The event list named event_list matches any of the Syslog messages defined by the ID range start to end (100000 to 999999). If no end value is given, start defines a single message ID.
For example, suppose the logging list xlate-log is used to log messages related to address translation. Message 202001 (out of translation slots) and messages 305009 through 305011 (translations built and torn down) can be used to collect an audit trail of dynamic xlate entries (using the following commands) so that inside users can be associated with PAT addresses at any given time:
Firewall(config)# logging list xlate-log message 202001
Firewall(config)# logging list xlate-log message 305009-305011
4. (ASA and FWSM) Define destinations for a logging class of messages:
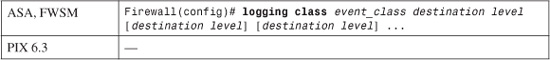
You can configure a predefined class of logging messages to be sent to one or more logging destinations, each having a unique severity threshold. The class is identified by one of the following event_class names: auth, bridge, ca, citrix, config, csd, dap, eap, eapoudp, eigrp, email, ha, ids, ip, nac, nacpolicy, nacsettings, np, ospf, rip, rm, session, snmp, ssl, svc, sys, vm, vpdn, vpn, vpnc, vpnfo, vpnlb, webfo, or webvpn.
You can define one or more destinations and severity threshold pairs for the class using a single command line. Each destination must be one of the following keywords: console (firewall console), monitor (Telnet or SSH session), buffered (memory buffer), trap (Syslog servers), history (SNMP traps), mail (SMTP), pdm (PDM application for PIX 6.3), or asdm (ASDM application for ASA or FWSM). The destination will be configured in subsequent sections in this chapter.
Each severity level must be one of the following keywords or numbers: emergencies (0), alerts (1), critical (2), errors (3), warnings (4), notifications (5), informational (6), or debugging (7).
For example, in the following command, high-availability messages of severity 1 (alerts) are sent to the trap destination, and severity 7 (debugging) messages are sent to the logging buffer:
Firewall(config)# logging class ha trap alerts buffered debugging
Log to an Interactive Firewall Session
To view logging messages when you open console, SSH, and Telnet sessions to the firewall itself, use the following configuration steps.
1. (Optional) Log to the firewall console:
![]()
If you have a terminal emulator connected to the firewall console, you might want to see logging messages as they are generated. Messages are displayed if they are at or below the specified severity level: emergencies (0), alerts (1), critical (2), errors (3), warnings (4), notifications (5), informational (6), or debugging (7).
On an ASA or FWSM, you can also use a policy to select which messages are displayed. Messages that are matched by the event list named event-list (defined in Step 2) are forwarded to the logging destination. Keep in mind that multiple-context mode still has only one physical console port. Therefore, it does not make sense to enable console logging for a user context, because those contexts do not have a usable console.
Caution
You should send logging messages to the serial console only if the firewall is lightly loaded or in a test environment. Messages are displayed at a relatively low speed (9600 baud); if many messages are generated, the backlog of messages can cause the firewall to have slow response. As well, you lose interactive control at the console while the messages are being displayed.
For these reasons, console logging is disabled by default.
2. (Optional) Log to Telnet or SSH sessions on the firewall:
![]()
If you have a remote firewall Telnet or SSH session open, you might want to see logging messages as they are generated. Messages are displayed if they are at or below the specified severity level:emergencies (0), alerts (1), critical (2), errors (3), warnings (4), notifications (5), informational (6), or debugging (7).
To see the logging messages in the current session as they are generated, use the terminal monitor EXEC command. (In PIX 6.3, you must be in configuration mode to use this command. In addition, the most recently initiated Telnet session receives the session logging output by default, because terminal monitor mode is active until it is disabled.) To stop seeing the messages, use the EXEC command terminal no monitor.
With an ASA or FWSM, you can also use a policy to select which messages are displayed. Messages that are matched by the event list named event-list (defined in Step 2 of the “Configuring Basic Logging Parameters” section) are forwarded to the logging destination.
Caution
You should avoid sending logging messages to Telnet and SSH sessions on a highly utilized production firewall. Although logging messages can be sent to interactive sessions more efficiently than the firewall console, the firewall can still become backlogged with messages to send. Therefore, monitor (session) logging is disabled by default.
Log to the Firewall’s Internal Buffer
Internal buffered logging uses a 4096-byte circular memory buffer to store the most recent messages. The actual number of logging messages stored depends on the length of each message. For example, one full buffer might contain only 32 messages if those lines of message text are very long.
The logging buffer can be handy if you do not have access to a Syslog server or if the Syslog server is unavailable. The logging buffer is the most efficient way to collect some messages for troubleshooting or to inspect specific activity without having to sift through massive Syslog server logs. You might want to see only certain types of messages that are being generated, even though a wide variety of logging messages are being sent to a Syslog server.
In addition, the logging buffer is much more efficient than sending logging output to the firewall console or a Telnet or SSH session. Think of the logging buffer as a small collector for occasional use.
1. Set the buffer logging level:
![]()
The firewall keeps a circular buffer in memory that can hold the most recent logging messages. Messages are sent to the buffer if they are at or below the specified severity level: emergencies (0), alerts (1), critical (2), errors (3), warnings (4), notifications (5), informational (6), or debugging (7).
Beginning in ASA 7.0 and FWSM 3.1(1), you can also use a policy to select which messages are displayed. Messages that are matched by the event list named event_list (defined in Step 3 of the “Configuring Basic Logging Parameters” section) are forwarded to the logging destination.
By default, the buffer is 4096 bytes long and can hold about 100 messages. You can adjust the size of the buffer if needed. You can use the logging buffer-size bytes command to size the buffer to 4096 to 1048576 bytes.
To see the buffered messages, use the EXEC command show logging. Remember that the buffer is circular, so it never overflows and never needs clearing. However, you can clear the buffer with the clear logging buffer command if you need to see only the most recent messages collected after a certain point.
2. (Optional) Copy the buffer via FTP if it fills and wraps:
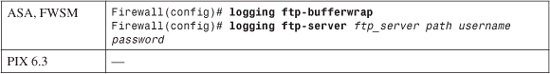
When the circular logging buffer is full (is getting ready to wrap around itself), the firewall can copy a snapshot of it to an FTP server at IP address ftp_server. The firewall connects to the server using username and password.
The buffer contents are uploaded as a file stored at the path name path. The path name is relative to the username’s directory on the server. For example, to save the log file into user hucaby’s home directory, you can use the “.” current directory path name. The firewall automatically names the log file in the form LOG-YYYY-MM-DD-HHMMSS.TXT (where YYYY-MM-DD represents the date and HHMMSS represents the time). The log file is always the total size of the logging buffer (4096 bytes by default).
For example, you could use the following commands to force the logging buffer contents to be uploaded to an FTP server into the home directory of user pixadmin:
Firewall(config)# logging ftp-bufferwrap
Firewall(config)# logging ftp-server 192.168.199.10 pixadmin bigsecretpw
Tip
If you experience problems getting the firewall to successfully upload log files to the FTP server, you might see the following error messages:
Firewall/admin# ERROR: ftp write to server 192.168.3.14 failed:%ASA-3-414001: Failed to save logging buffer to FTP server 192.168.3.14 using filename LOG-2007-05-06-010113.TXT on interface inside:
You can use the debug ftp client command to see debugging output as the firewall attempts to upload its log files. Make sure you have a logging destination configured for the debugging severity, as well as for the debug-trace output.
From this information, you should be able to see where the process fails. Consider the following example, in which the firewall successfully logs into the FTP server but the server rejects the log file path name because it is not relative to the user’s directory:
Firewall# debug ftp client[time passes until buffer wraps]%ASA-7-711001: Writing /pix-log-snapshot/LOG-2007-05-06-010703.TXT%ASA-7-711001: FTP: 220 pi FTP server ready.%ASA-7-711001: FTP: ---> USER pixadmin%ASA-7-711001: FTP: 331 Password required for pixadmin.%ASA-7-711001: FTP: ---> PASS *%ASA-7-711001: FTP: 230 User pixadmin logged in.%ASA-7-711001: FTP: ---> TYPE I%ASA-7-711001: FTP: 200 Type set to I.%ASA-7-711001: FTP: ---> PORT 192,168,93,135,4,100%ASA-7-711001: FTP: 200 PORT command successful.%ASA-7-711001: FTP: ---> STOR /pix-log-snapshot/LOG-2007-05-06-010703.TXT%ASA-7-711001: FTP: 553 /pix-log-snapshot/LOG-2007-05-06-010703.TXT: No such file or directory.%ASA-7-711001: FTP: ---> QUIT%ASA-3-414001: Failed to save logging buffer to FTP server 192.168.3.14 using filename LOG-2007-05-06-010703.TXT on interface inside:%ASA-7-711001: FTP: 221 Goodbye.
3. (Optional) Copy the buffer to Flash if it fills and wraps:
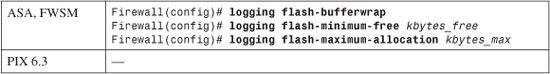
When the circular logging buffer gets ready to wrap, the firewall can copy a snapshot of it into a file on the Flash file system. The firewall automatically names the log file in the Syslog Flash directory using a filename of the form LOG-YYYY-MM-DD-HHMMSS.TXT (where YYYY-MM-DD represents the date and HHMMSS represents the time). The log file is always the total size of the logging buffer (4096 bytes by default).
As more log files are saved, more space in the Flash file system is used up. With the flash-maximum-allocation keyword, you can limit the total space reserved for log files to kbytes_max (4 to 15750 KB). The flash-minimum-free keyword specifies how much Flash memory must be free before log files can be saved, as kbytes_free (0 to 15750 KB).
Tip
Flash-related logging buffer commands are available only in ASA and FWSM platforms running in single-context mode. If multiple contexts are being used, only the system execution space has access to the Flash file system. However, its logging capability is very limited because most of the firewall activity occurs in other contexts.
In single-context mode, you can manually save the current buffer contents into Flash by using the following command in privileged EXEC mode:
Firewall# logging savelog [savefile]
The log file is saved in the Syslog directory of the Flash file system. You can specify a filename savefile for it. Otherwise, the default filename template LOG-YYYY-MM-DD-HHMMSS.TXT is used (where YYYY-MM-DD represents the current date and HHMMSS represents the current time).
Log to an SNMP Management Station
You can use the following configuration steps to send firewall logging messages to an SNMP network management station. Messages are sent as SNMP traps.
1. Configure a destination for SNMP traps:
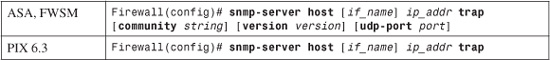
The SNMP management station is located on the firewall interface named if_name (inside, for example) at IP address ip_addr.
2. Enable traps to be sent by SNMP:
![]()
By default, all trap types are sent. ASA and FWSM allow specific types of traps to be sent, as described in Chapter 4, “Firewall Management,” in Section “4-7: Firewall Management,” in Section “Monitoring a Firewall with SNMP.” Only the all and syslog trap types are shown here, because either is sufficient for the purpose of sending Syslog messages as SNMP traps.
3. Enable traps containing logging messages to be sent:
![]()
Logging messages can be sent as SNMP traps to any configured SNMP management station. Messages are sent if they are at or below the specified severity level: emergencies (0), alerts (1), critical (2), errors (3), warnings (4), notifications (5), informational (6), or debugging (7). Each message is sent in a separate SNMP trap packet.
With ASA or FWSM, you can also use a policy to select which messages are displayed. Messages that are matched by the event list named event-list (defined in Step 2 of the “Configuring Basic Logging Parameters” section) are forwarded to the logging destination.
Logging to a Syslog Server
Use the following configuration steps to send firewall logging messages to one or more Syslog servers.
1. Set the logging level:
![]()
Messages are sent to any configured Syslog servers if they are at or below the specified severity level: emergencies (0), alerts (1), critical (2), errors (3), warnings (4), notifications (5), informational (6), or debugging (7).
With ASA and FWSM, you can also use a policy to select which messages are displayed. Messages that are matched by the event list named event-list (defined in Step 3 of the “Configuring Basic Logging Parameters” section) are forwarded to the logging destination.
Note
You might find it confusing that logging messages sent as SNMP traps are configured using logging history and messages sent as Syslog packets are configured using logging trap. Unfortunately, the term “trap” has a different meaning here.
2. (Optional) Identify the firewall in Syslog messages:
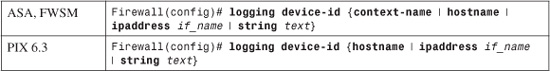
A Syslog server usually records the originating IP address along with each message received. However, you can define one unique identifier for your firewall that also appears in the text of each Syslog message. (This identifier does not appear in EMBLEM formatted messages.)
The identifier can be the firewall’s host name (defined with the hostname configuration command), the IP address of a specific firewall interface named if_name (“inside” or “outside,” for example), or an arbitrary text string (up to 16 characters). With an ASA or FWSM operating in multiple-context mode, the name of the firewall context can also be sent.
For example, the following firewall is named InnerSanctum. It identifies itself using its host name:
Firewall(config)# hostname InnerSanctum
Firewall(config)# logging device-id hostname
3. Identify a Syslog server destination:
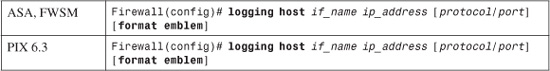
Syslog messages are sent out the firewall interface named if_name (“inside” or “outside,” for example) to the Syslog server located at IP address ip_address.
By default, messages are sent using UDP port 514. You can use the protocol field to specify either udp or tcp (or as a protocol number, 17 or 6, respectively). Define the port number to use with the port field, a number from 1025 to 65535. Because TCP Syslog does not use a standard port, you always have to specify one.
Obviously, the Syslog server must be configured to listen on the matching protocol and port number.
You can use the format emblem keywords to send logging messages in the EMBLEM format.
The firewall in the following example sends its trap logging messages to the Syslog server using the default UDP port 514:
Firewall(config)# logging host inside 192.168.199.70
This command can be repeated to define multiple Syslog servers.
Note
Keep in mind that the firewall sends a copy of each Syslog message generated to each of the configured Syslog servers. If your firewall is heavily utilized and is configured to generate high-severity messages to multiple Syslog servers, its performance can be affected.
Normally, Syslog messages are sent using UDP port 514. This provides an easy way to send messages in a best-effort fashion. The firewall has no idea if the messages are being received by the Syslog server, much less if there is actually a Syslog server at the address.
Some environments require strict collection of security information. In this case, you should use TCP to send Syslog messages, usually over port 1470.
The firewall opens and maintains a TCP connection with the Syslog server. As long as this connection stays open, the firewall can be certain that the messages are being reliably received.
In fact, the TCP Syslog method is designed to be so reliable that the firewall’s operation becomes dependent upon the TCP Syslog connection. The TCP connection closes only if the Syslog server becomes unavailable or if its logging storage space becomes full.
By default, if the TCP connection closes for any reason, the firewall immediately stops forwarding all traffic through itself. You can realize that this has happened in several ways:
— Traffic is no longer passing through the firewall, and users are calling to complain.
— The firewall generates a “201008: The PIX is disallowing new connections” logging message. (Naturally, if the Syslog server connection is broken, you will not be able to see this message on the Syslog server. Instead, you might find it in the logging buffer on the firewall with the show logging command.)
— The show logging setting command shows the Syslog server as “disabled,” as in the following example.
Firewall# show logging setting
Syslog logging: enabled
Facility: 20
Timestamp logging: enabled
Standby logging: disabled
Console logging: disabled
Monitor logging: disabled
Buffer logging: level informational, 716 messages logged
Trap logging: level informational, 162 messages logged
Logging to inside 172.21.4.1 tcp/1470 disabled
History logging: disabled
Device ID: hostname "Firewall"
If this condition occurs, check the Syslog server and determine the source of the problem. Even after the Syslog service is restored, the firewall will still show the server as disabled. To reenable it, you have to reconfigure the TCP Syslog connection manually by re-entering the logging host if_name ip_address tcp/port configuration command.
Tip
With ASA and FWSM, you can use the following command to allow traffic to pass and firewall operation to continue, even if a TCP Syslog server is down:
Firewall(config)# logging permit-hostdown
4. (Optional) Tune the Syslog transmission queue.
As Syslog messages are generated, they are placed in a queue for transmission. If messages are being generated faster than they can be sent, the logging queue begins to fill. By default, a firewall queues up to 512 messages. As soon as this threshold is reached, any new messages are simply dropped and are not sent.
You can see information about the logging queue with the following EXEC command:
Firewall# show logging queue
The output from this command displays the size of the queue, along with the current queue depth and the high-water mark. If the msgs most on queue value is 512, the queue filled up at some point, and messages have been lost. In the following example, a high volume of logging messages is being generated, but they are being transmitted fast enough that the queue has never filled.
Firewall# show logging queue
Logging Queue length limit : 512 msg(s)
Current 0 msg on queue, 136 msgs most on queue
Firewall#
If you find that the logging queue is consistently full (“512 msgs most on queue”), you can tune the queue’s size. Use the following configuration command:
Firewall(config)# logging queue queue_size
The queue holds queue_size messages (0 to 8192; 0 = unlimited up to available memory). You can use the show blocks EXEC command to see how much memory is available before tuning the queue. Syslog messages use 256-byte blocks of memory. Be careful not to allocate too much of this memory to the logging queue, because the 256-byte blocks are also used for stateful failover message queuing.
5. (Optional) Add time stamps to Syslog messages:
Firewall(config)# logging timestamp
By default, Syslog messages are sent with no indication of the date or time at which they occurred. In this case, the Syslog server should add its own time stamps to the messages as they are received. Make sure the Syslog server synchronizes its clock with a known and accurate source.
The logging timestamp command causes the firewall to add a time stamp to each Syslog message before it is sent. The firewall should have its clock set and time synchronized to a known and accurate source—preferably an NTP server that is common to all devices on your network.
Tip
If the logging timestamp command is used to make the firewall add time stamps, it is also possible that the Syslog server is configured to add its own time stamps. This can result in logging messages that have double time stamps in the text. Many Syslog servers can be configured to detect this and strip the extra time stamp automatically.
6. (Optional) Set the Syslog facility:
Firewall(config)# logging facility facility
Syslog servers can collect logging messages from a variety of sources. Messages are marked with a facility number (0 to 23), allowing the Syslog server to classify and store messages from similar sources.
Facility numbers correspond to the UNIX-based Syslog facility names as follows: 0 (Kern), 1 (User), 2 (Mail), 3 (Daemon), 4 (Auth), 5 (Syslog), 6 (Lpr), 7 (News), 8 (UUCP), 9 (Cron), 10 to 15 (System0 to System5), 16 to 23 (Local0 to Local7).
The default facility, 20, is also known as the Local4 facility. This is usually expected by most Syslog server implementations.
7. (Optional) Generate Syslog messages from the standby failover unit:
Firewall(config)# logging standby
Normally, only the active firewall unit in an active/passive failover pair generates Syslog messages. If your environment needs strict collection of logging information, you can use this command to cause the standby firewall to generate Syslog messages too.
The standby firewall can generate the same Syslog messages as the active unit only because the same state information is passed from the active unit to the passive unit. This doubles the number of messages sent to the Syslog server(s), and each message is duplicated. However, if the active unit fails, any messages that were queued might be lost. The standby unit continues sending those messages as if nothing happened.
Logging to a Secure Syslog Server Using SSL
By using a TCP connection to a Syslog server, logging messages can be sent and collected reliably. However, the logging information is sent in cleartext. If someone can intercept the Syslog packets, they can easily examine the logging messages to learn sensitive information such as usernames that have authenticated, collections that are permitted or blocked by the firewall, and so on. The more information an unauthorized user can gather about the secure part of your network, the easier it is for them to find ways to exploit that information.
If your Syslog server is located on a protected network, then the stream of logging messages stays within the boundary of your firewall. Ideally, a Syslog server should be located on a private management network, so that the firewall can strictly limit access to the server and the data being sent to it.
However, this is not always possible or practical. Beginning with ASA 8.0, you can configure the firewall to send its logging messages through a Secure Socket Layer (SSL) tunnel to a Syslog server. The SSL tunnel takes care of encrypting the logging messages and maintaining their integrity until they reach the Syslog server. Now you can locate the Syslog server anywhere on the network without worrying about sensitive logging information being exposed.
Most Syslog servers can collect logging messages over normal UDP and TCP connections, but they do not have the capability to use an SSL tunnel. Fortunately, you can add a “shim” or an additional piece of software that sits between the SSL tunnel and the Syslog server, passing data between the two. You can use any SSL tunneling software, such as the following free open source packages:
• Stunnel—Universal SSL Wrapper at http://www.stunnel.org, as source code and Windows binaries
• OpenSSL—The OpenSSL Project at http://www.openssl.org, as source code only. You can find precompiled Windows binaries at the Win32 OpenSSL Installation Project, http://www.slproweb.com/products/Win32OpenSSL.html
Figure 10-3 shows how the secure Syslog configuration works. The firewall is configured to send logging information to a secure Syslog server destination over a TCP port that you define. In the figure, secure Syslog is using TCP port 60514.
Figure 10-3 Communication Between a Firewall and a Secure Syslog Server
On the Syslog server, the SSL software is installed and configured to receive SSL traffic over the same TCP port that the firewall is using (TCP 60514, for example). The software unencrypts the TCP Syslog packets from the SSL tunnel and relays them to the Syslog application’s TCP port (TCP 1470).
As with a regular TCP Syslog connection, the firewall monitors the status of the Syslog server by the TCP connection status. If the connection goes down, the firewall tries to bring it back up five times.
If it still is not successful, the firewall marks the Syslog server as being disabled. You can re-enable the server only by manually re-entering it into the firewall configuration.
Use the following steps to add SSL capability to your Syslog server and to configure the firewall for secure Syslog operation.
1. Install and configure the SSL tunnel software.
a. Edit the SSL software configuration file.
After the SSL software package is installed, you should find a configuration file in the installation directory. For example, the Stunnel package uses a file called stunnel.conf. On a Windows platform, you can find the file in C:Program Filesstunnelstunnel.conf. Add the following lines to define the secure Syslog SSL tunnel:
[ssyslog]
accept = 60514
connect = 1470
Here, the “accept” port is the TCP port used for the SSL tunnel (60514, for example), and “connect” is the TCP port used by the Syslog software (1470). Make sure you do not begin the lines with a semicolon; otherwise, they are ignored as comment lines.
Save the configuration file into its original location and name.
b. Obtain an SSL certificate for the SSL software.
The SSL software acts as an SSL server, whereas the firewall acts as an SSL client. Therefore, the server must have a valid SSL certificate from a trusted certificate authority before the firewall can bring up an SSL connection to it. The Stunnel package comes with a default certificate in the stunnel.pem file, but it should never be used in a production environment. The same certificate is given out to everyone who downloads and installs the package. Anyone who has the package can use the private key found in the stunnel.pem file and can potentially intercept your “secure” Syslog traffic.
Instead, you should request a new SSL certificate from a trusted source. The certificate contents can be pasted into the stunnel.pem file, replacing the old certificate. Be sure to include the surrounding “-----BEGIN/END CERTIFICATE-----” lines, as shown in the following example:
-----BEGIN CERTIFICATE-----
MIIClTCCAf6gAwIBAgIJANtC9yI81EYQMA0GCSqGSIb3DQEBBAUAMIGAMQswCQYD
VQQGEwJVUzERMA8GA1UECBMIS2VudHVja3kxEjAQBgNVBAcTCUxleGluZ3RvbjET
MBEGA1UEChMKTXkgQ29tcGFueTEZMBcGA1UECxMQVGVzdCBFbmdpbmVlcmluZzEa
MBgGA1UEAxMRd3d3Lm15Y29tcGFueS5jb20wHhcNMDcwMzIwMDM0OTU2WhcNMDgw
MzE5MDM0OTU2WjCBgDELMAkGA1UEBhMCVVMxETAPBgNVBAgTCEtlbnR1Y2t5MRIw
EAYDVQQHEwlMZXhpbmd0b24xEzARBgNVBAoTCk15IENvbXBhbnkxGTAXBgNVBAsT
EFRlc3QgRW5naW5lZXJpbmcxGjAYBgNVBAMTEXd3dy5teWNvbXBhbnkuY29tMIGf
MA0GCSqGSIb3DQEBAQUAA4GNADCBiQKBgQDo2eenyqOXltzK/XvV99lrQUHt42SC
afE+uRDIG9nbpGw/3UjPxhKAhM4JCgb6FqtLXAqS0LNTVf4W5u2dJo0WM2rQS12P
bIm4yYlftU8prCTTvxYYuWD+ceZqwc0pSWk//BDOKjOHWBSyfp4aW/uoELcGtUEB
uoV83CwLPBehDQIDAQABoxUwEzARBglghkgBhvhCAQEEBAMCBkAwDQYJKoZIhvcN
AQEEBQADgYEArUYe/jVl/n0iwVdZNhfl6DySYvpa6u4x/Gn86TsWzPTJ8waR0Y+n
fIKb9in1Et8DdFRBOKejhCnGflw857HHFvXFqI5KBAzFyZ28FeGnnt7SP3Wlwfo5
QCNkvzEc/iB4EFKBZ7y0OQsz7xodty4ptRS4icwMA+kiAJUMmk7NhyM=
-----END CERTIFICATE-----
c. Start the SSL software.
The SSL software can run as a service so that it is always available to incoming tunnel requests. On a Windows platform, the software can also run as a regular application that you start manually.
2. Configure secure logging on the firewall.
By default, the firewall does not know about any trusted certificate authorities. This means it will not be able to validate the SSL certificate it receives from the Syslog server’s SSL software. You have to manually configure a certificate authority (CA) trustpoint and its self-signed certificate with the following steps:
a. Define a CA trustpoint:
Firewall(config)# crypto ca trustpoint name
A trustpoint is simply a definition of the CA that the firewall should trust as it validates certificates from SSL servers. The name is arbitrary.
b. Use manual CA enrollment:
Firewall(config-ca-trustpoint)# enrollment terminal
Firewall(config-ca-trustpoint)# exit
Although the firewall can enroll with a CA automatically through an enrollment protocol, you need to enter the CA certificate manually. Here, the terminal keyword denotes the use of a terminal session (Telnet or SSH) with the firewall.
c. Import the SSL software’s certificate:
Firewall(config)# crypto ca authenticate name
The firewall authenticates the CA trustpoint named name by allowing you to enter the certificate contents interactively. When you are prompted to enter the CA certificate contents, you can paste in the same lines of content you pasted into the SSL software certificate file in Step 1b. Here, the certificate can be pasted with or without the surrounding “-----BEGIN/END CERTIFICATE-----” lines. After pasting the contents into the terminal session, be sure to type the word quit as the last line before pressing the Enter key.
In the following example, a CA trustpoint named syslogCA is defined and its certificate entered:
Firewall(config)# crypto ca trustpoint syslogCA
Firewall(config-ca-trustpoint)# enrollment terminal
Firewall(config-ca-trustpoint)# exit
-
Firewall(config)#crypto ca authenticate test
Enter the base 64 encoded CA certificate.
End with the word "quit" on a line by itself
-----BEGIN CERTIFICATE-----
MIIClTCCAf6gAwIBAgIJANtC9yI81EYQMA0GCSqGSIb3DQEBBAUAMIGAMQswCQYD
VQQGEwJVUzERMA8GA1UECBMIS2VudHVja3kxEjAQBgNVBAcTCUxleGluZ3RvbjET
MBEGA1UEChMKTXkgQ29tcGFueTEZMBcGA1UECxMQVGVzdCBFbmdpbmVlcmluZzEa
MBgGA1UEAxMRd3d3Lm15Y29tcGFueS5jb20wHhcNMDcwMzIwMDM0OTU2WhcNMDgw
MzE5MDM0OTU2WjCBgDELMAkGA1UEBhMCVVMxETAPBgNVBAgTCEtlbnR1Y2t5MRIw
EAYDVQQHEwlMZXhpbmd0b24xEzARBgNVBAoTCk15IENvbXBhbnkxGTAXBgNVBAsT
EFRlc3QgRW5naW5lZXJpbmcxGjAYBgNVBAMTEXd3dy5teWNvbXBhbnkuY29tMIGf
MA0GCSqGSIb3DQEBAQUAA4GNADCBiQKBgQDo2eenyqOXltzK/XvV99lrQUHt42SC
afE+uRDIG9nbpGw/3UjPxhKAhM4JCgb6FqtLXAqS0LNTVf4W5u2dJo0WM2rQS12P
bIm4yYlftU8prCTTvxYYuWD+ceZqwc0pSWk//BDOKjOHWBSyfp4aW/uoELcGtUEB
uoV83CwLPBehDQIDAQABoxUwEzARBglghkgBhvhCAQEEBAMCBkAwDQYJKoZIhvcN
AQEEBQADgYEArUYe/jVl/n0iwVdZNhfl6DySYvpa6u4x/Gn86TsWzPTJ8waR0Y+n
fIKb9in1Et8DdFRBOKejhCnGflw857HHFvXFqI5KBAzFyZ28FeGnnt7SP3Wlwfo5
QCNkvzEc/iB4EFKBZ7y0OQsz7xodty4ptRS4icwMA+kiAJUMmk7NhyM=
-----END CERTIFICATE-----
quit
INFO: Certificate has the following attributes:
Fingerprint: 4097e286 8f4425db 36ddae78 f750d6d8
Do you accept this certificate? [yes/no]: yes
Trustpoint CA certificate accepted.
% Certificate successfully imported
Firewall(config)#
d. Define the SSL trustpoint:
Firewall(config)# ssl trust-point name if_name
So, the CA trustpoint named name is used as the trusted CA for the firewall’s SSL connection. The trustpoint (secure Syslog server) can be found on the firewall interface named if_name. For example, if your secure Syslog server is located on the outside interface, you could use the following command:
Firewall(config)# ssl trust-point syslogCA outside
e. Configure a secure Syslog server destination:
Firewall(config)# logging host if_name ip_address tcp/port secure
The firewall begins sending logging messages to the Syslog server located on the firewall interface if_name at IP address ip_address. Instead of using a normal TCP connection, the secure keyword tells the firewall to attempt to bring up an SSL tunnel to the TCP destination port number you specify.
As an example, the Syslog server is located on the outside interface at 172.21.4.37 and uses SSL tunneling software configured for TCP port 60514. To configure this setup, you would enter the following command:
Firewall(config)# logging host outside 172.21.4.37 tcp/60514 secure
Caution
As with a regular TCP Syslog destination, the firewall’s default behavior is to stop passing traffic through itself if the TCP connection fails for any reason. You might want to disable this feature while you build and test the secure Syslog server configuration so that you do not interrupt your production firewall traffic inadvertently. You can use the following command to force the firewall to continue forwarding traffic even if the secure Syslog TCP connection fails:
Firewall(config)# logging permit-hostdown
3. Verify the secure Syslog operation.
You can verify that the SSL connection to the secure Syslog server is operational by using the show logging setting command. In the following example, the Syslog server destination is shown to be up and active by the “SECURE” status:
Firewall# show logging setting
Syslog logging: enabled
Facility: 20
Timestamp logging: enabled
Standby logging: disabled
Deny Conn when Queue Full: disabled
Console logging: disabled
Monitor logging: level debugging, 93799 messages logged
Buffer logging: level debugging, 93799 messages logged
Trap logging: level debugging, facility 20, 93799 messages logged
Logging to outside 172.21.4.217 tcp/60514 SECURE
History logging: disabled
Device ID: disabled
Mail logging: disabled
ASDM logging: level informational, 176 messages logged
Firewall#
If the SSL tunnel is not successful, the firewall makes five attempts at bringing the tunnel up before declaring the server to be disabled. In that case, you could see the logging destination status shown as an attempt number or “disabled,” as in the following lines from the show logging setting command output:
Firewall# show logging setting
Syslog logging: enabled
Facility: 20
Timestamp logging: enabled
Standby logging: disabled
Deny Conn when Queue Full: disabled
Console logging: disabled
Monitor logging: level debugging, 10730084 messages logged
Buffer logging: level debugging, 10730084 messages logged
Trap logging: level debugging, facility 20, 10730084 messages logged
Logging to outside 172.21.4.37 tcp/60514 SECURE retry: Attempt 2
History logging: disabled
Device ID: disabled
Mail logging: disabled
ASDM logging: level informational, 1950 messages logged
Firewall# show logging setting
Syslog logging: enabled
Facility: 20
Timestamp logging: enabled
Standby logging: disabled
Deny Conn when Queue Full: disabled
Console logging: disabled
Monitor logging: level debugging, 10730091 messages logged
Buffer logging: level debugging, 10730091 messages logged
Trap logging: level debugging, facility 20, 10730091 messages logged
Logging to outside 172.21.4.37 tcp/60514 SECURE disabled
History logging: disabled
Device ID: disabled
Mail logging: disabled
ASDM logging: level informational, 1950 messages logged
Firewall#
You can also see evidence of the SSL tunnel process by looking through the firewall’s logging buffer. In the following example, the firewall has attempted to bring up the SSL tunnel and to validate the Syslog server’s SSL certificate. The tunnel is successful, as shown by the final “Device completed SSL handshake with server” message.
%ASA-6-725001: Starting SSL handshake with server outside:172.21.67.252/1041 for
TLSv1 session.
%ASA-7-725009: Device proposes the following 4 cipher(s) to server
outside:172.21.4.37/1041
%ASA-7-725011: Cipher[1] : RC4-SHA
%ASA-7-725011: Cipher[2] : AES128-SHA
%ASA-7-725011: Cipher[3] : AES256-SHA
%ASA-7-725011: Cipher[4] : DES-CBC3-SHA
%ASA-7-725013: SSL Server outside:172.21.4.37/1041 choose cipher : RC4-SHA
%ASA-7-717025: Validating certificate chain containing 1 certificate(s).
%ASA-7-717029: Identified client certificate within certificate chain. serial number:
00DB42F7223CD44610, subject name: cn=www.mycompany.com,ou=Test Engineering,o=My
Company,l=Lexington,st=Kentucky,c=US.
%ASA-6-717022: Certificate was successfully validated. Certificate is resident and
trusted, serial number: 00DB42F7223CD44610, subject name:
cn=www.mycompany.com,ou=Test
Engineering,o=My Company,l=Lexington,st=Kentucky,c=US.
%ASA-6-717028: Certificate chain was successfully validated with revocation status
check.
%ASA-6-725002: Device completed SSL handshake with server outside:172.21.4.37/1041
Logging to an E-mail Address
When logging messages are generated, they can be sent to an e-mail address. Each message is sent as a single e-mail message.
You can configure the “From” and “To” addresses for the resulting e-mails. The firewall always sends these with the subject line “ASA Alert (hostname)” or “FWSM Alert (hostname).” The actual e-mail message has the following format:
Date: Sun, 6 May 2007 16:17:43 Eastern
From: [email protected]
To: [email protected]
Subject: ASA Alert (Firewall-c)
<165>May 06 2007 16:17:43 admin : %ASA-2-106001: Inbound TCP connection denied from
172.16.89.4/1489 to 172.21.2.200/23 flags INVALID on interface outside
In this example, the firewall has added its own time stamp and the originating context name (admin in multiple-context mode) to the logging message text.
Use the following configuration steps to begin sending logging messages to one or more email destinations.
1. Set the mail logging level:
![]()
Messages are sent to any configured e-mail recipient addresses if they are at or below the specified severity level: emergencies (0), alerts (1), critical (2), errors (3), warnings (4), notifications (5), informational (6), or debugging (7). The ASA and FWSM also let you use a policy to select which messages are sent. Messages that are matched by the event list named event-list (defined in Step 3 of the “Configuring Basic Logging Parameters” section) are forwarded to the logging destination.
2. Identify an SMTP server for e-mail delivery:
![]()
The firewall sends all its mail logging messages to an SMTP server, which should relay the mail to the appropriate recipients. Up to two servers can be identified, either by IP address or host name. The firewall first tries to send to server_primary. If that fails, it tries server_secondary.
Note
If you use a host name, a matching name command must already be configured so that the name can be resolved to an IP address. This is because the firewall will not resolve names through an external DNS server. Instead, resolution must happen internally.
Even if you supply a host name with the smtp-server command, the IP address is substituted in the actual running-config.
3. Assign a sender address for the messages:
![]()
Mail messages are sent with an arbitrary e-mail source address of from_email_address. This address is not automatically verified or resolved; instead, it is just copied into the resulting message and sent to the SMTP server. The address can be fictitious, because it is not necessary or possible to reply to that address. In the following sample command, logging messages appear to be sent from [email protected]:
Firewall(config)# logging from-address [email protected]
4. Identify the e-mail recipient:
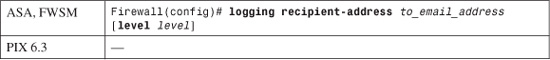
Logging messages are sent to the recipient address to_email_address. This can be an actual person’s address or the address of a system that can automatically distribute the e-mail message to any number of recipients. You can repeat this command to define multiple recipient addresses.
Each mail logging recipient can have a unique severity level associated with it, specified as level: emergencies (0), alerts (1), critical (2), errors (3), warnings (4), notifications (5), informational (6), or debugging (7). If a message is at or below the recipient’s severity level, it is sent. However, the logging mail level command sets the highest possible severity that can be sent to any e-mail recipient.
Caution
Be careful when you set a mail logging severity level. Remember that each relevant logging message is sent as a separate e-mail message. A highly utilized firewall or a severity level that is too great can quickly overload a recipient’s mailbox. In addition, it can overload the firewall’s SMTP queue to the point that new logging messages are dropped. The firewall reminds you of this potential, as the following example demonstrates:
Firewall(config)# logging recipient-address [email protected] levelinformationalWARNING: SMTP logging is very inefficient. At this severity level, a large number of syslogs might overwhelm the SMTP input queue, resulting in dropped messages.Firewall(config)#
Logging to an ASDM Management Application
A firewall can feed logging messages to one or more ASDM sessions. Messages are kept in a buffer until they are requested by an ASDM session. The messages are transferred to ASDM over an SSL connection rather than as traditional Syslog packets.
Use the following steps to configure ASDM logging on your firewall.
1. (Optional) Set the buffer size for ASDM messages:
![]()
By default, the buffer holds 100 messages. You can adjust the buffer size to num_of_msgs (100 to 512 messages).
2. Set the ASDM logging level:
![]()
Messages are buffered for ASDM if they are at or below the specified severity level: emergencies (0), alerts (1), critical (2), errors (3), warnings (4), notifications (5), informational (6), or debugging (7).
On an ASA or FWSM, you can also use a policy to select which messages are displayed. Messages that are matched by the event list named event-list (defined in Step 3 of the “Configuring Basic Logging Parameters” section) are buffered for ASDM use.
Verifying Message Logging Activity
Use the show logging command to verify where logging messages are being sent. The first few lines of output display message counters for every possible logging destination.
The firewall in the following example has sent 117 messages to the console, 408,218 messages to the internal buffer (only 4096 bytes of the most recent messages are kept), and 1,852,197 messages to the Syslog host at 192.168.199.200. You can also verify each destination’s severity level.
Firewall# show logging
Syslog logging: enabled
Facility: 20
Timestamp logging: enabled
Standby logging: disabled
Console logging: level warnings, 117 messages logged
Monitor logging: level errors, 0 messages logged
Buffer logging: level informational, 408218 messages logged
Trap logging: level informational, 1852197 messages logged
Logging to outside 192.168.199.200
History logging: disabled
Device ID: hostname "Firewall"
ASA and FWSM platforms provide some additional information, along with the settings of any additional logging destinations. The show logging setting command displays the same type of information without showing the logging buffer contents, as demonstrated in the following example:
Firewall/admin# show logging setting
Syslog logging: enabled
Facility: 20
Timestamp logging: enabled
Standby logging: disabled
Deny Conn when Queue Full: disabled
Console logging: disabled
Monitor logging: disabled
Buffer logging: list MyFilter, class config ip np session sys, 6756 messages
logged
Trap logging: level debugging, facility 20, 259799 messages logged
Logging to outside syslog.mycompany.com
History logging: disabled
Device ID: context name "admin"
Mail logging: level critical, 166 messages logged
ASDM logging: level informational, 246891 messages logged
Firewall/admin#
ASA and FWSM platforms also let you add message filters and classes to any logging destination. The preceding example shows how an event list called MyFilter is being used on the logging buffer. Notice that buffered logging is being performed for the event classes called config, ip, np, session, and sys.
Also notice that the firewall is using its context name “admin” as a device ID. Settings and counters are also shown for the other logging destinations, mail logging and ASDM logging.
Manually Testing Logging Message Generation
If it is not apparent that the firewall is sending Syslog messages, you can use another method to force messages to be sent while watching them being received at the destination. First, make sure the logging destination has been configured for severity level 4 or greater. Then, from enable mode in a session, run the following EXEC commands with a bogus or unused IP address:
Firewall# shun ip-address
Firewall# no shun ip-address
This creates and deletes a temporary shun on the nonexistent address. This command is handy because it is the only one that generates simple Syslog messages at a very low severity level (level 4, warnings) without a complex scenario. You should see something similar to the following logging messages displayed at the appropriate logging destination:
%ASA-4-401002: Shun added: 10.1.1.1 0.0.0.0 0 0
%ASA-4-401003: Shun deleted: 10.1.1.1
Tip
You can view the firewall’s internal logging buffer with the show logging EXEC command. Only the most recent messages still remaining in the buffer are shown.
ASA and FWSM platforms add both time stamps (if configured to do so) and the complete %ASA-severity-messageID or %FWSM-severity-messageID prefix to each message in the buffer. PIX 6.3 does not add the prefix or time stamps. Only the six-digit message number and the message text are shown.
To clear the internal logging buffer, you can use the clear logging buffer (ASA or FWSM) or the clear logging (PIX 6.3) command.
10-3 Fine-Tuning Logging Message Generation
After you have chosen and configured severity levels for logging destinations, you should make sure you are receiving only necessary messages. In other words, do not choose a severity level that can produce an abundance of messages that will be ignored. Always keep in mind that a Syslog server must receive and archive every message sent to it. Storage space is at a premium, especially when logs continuously grow over time.
Here are rules of thumb to follow when choosing a severity level:
• If only firewall error conditions should be recorded and no one will regularly view the message logs, choose severity level 3 (errors).
• If you are primarily interested in seeing how traffic is being filtered by the firewall access lists, choose severity level 4 (warnings).
• If you need an audit trail of firewall users and their activity, choose severity level 5 (notifications).
• If you will be using a firewall log analysis application, you should choose severity level 6 (informational). This is the only level that produces messages about connections that are created, as well as the time and data volume usage.
• If you need to use any debug command to troubleshoot something on the firewall, choose a destination with severity level 7 (debugging). You can use the logging debug-trace command to force debug output to be sent to a logging destination for later review. All Syslog messages containing debug output use message ID 711001 at a default severity level of 7.
Pruning Messages
If you find that a severity level meets your needs but generates some unnecessary messages, you can “prune” those messages and keep them from being generated at all. Locate the message from an actual Syslog capture, from the lists of messages in this section, or from the message listing in Appendix B. Next, disable the message based on its six-digit message number with the following configuration command:
Firewall(config)# no logging message message-number
You can see a listing of all the disabled logging messages with the following EXEC command:
Firewall# show logging message
To re-enable a disabled message, you can use the logging message message-number configuration command. To return all messages to their default levels on an ASA or FWSM, you can use the clear configure logging disabled configuration command.
Changing the Message Severity Level
Recall that each logging message has a default severity level associated with it. You can change that default behavior so that a message is sent based on a configurable severity level instead. This might be useful if you choose a severity level for a logging destination that includes most (but not all) of the messages that are interesting to you. For the messages that have a higher default level and that will not be sent, you can reconfigure their level to a lower value.
To change a message’s severity level, use the following configuration command:
Firewall(config)# logging message message-number [level level]
Here, the message is identified by its six-digit message-number or Syslog ID and is assigned a new severity level (0 to 7). To see a message’s current severity level, you can use the following EXEC command:
Firewall# show logging message {message-number | all}
The all keyword causes the state of all known or supported logging messages to be listed. Otherwise, you can specify the six-digit message-number to see the state of a specific message. The output shows the default severity level, the newly configured severity level (if any), and whether the message is enabled.
For example, suppose a firewall administrator wants to completely disable Syslog message 111008 while changing the severity of message 111009 from its default (debugging) to notifications. You could use the following commands to accomplish and verify this:
Firewall/admin(config)# logging message 111009 level notifications
Firewall/admin(config)# no logging message 111008
Firewall/admin(config)# exit
Firewall/admin# show logging message
syslog 111009: default-level debugging, current-level notifications (enabled)
syslog 111008: default-level notifications (disabled)
Firewall/admin#
Access List Activity Logging
By default, logging message 106023 (default severity level 4, warnings) is generated when a deny access list entry is matched with a traffic flow. Only the overall ACL is listed in the message, with no reference to the actual denying ACL entry, as in the following example:
%ASA-4-106023: Deny tcp src outside:220.163.33.180/18909 dst inside:
10.10.95.23/8039 by access-group "acl_outside"
You can log messages when specific access control entries (ACEs, or individual permit/deny statements within an ACL) permit or deny a traffic flow by adding the log keyword to an ACE.
You can also log the rate at which traffic flows match specific access list entries. This can be useful to gauge the volume of attacks or exploits that are occurring over time.
After a traffic flow triggers an ACE configured for logging, the firewall keeps the flow in a cached list. If the reporting interval completes and there are no additional occurrences of the same flow, the cached entry is deleted, and the flow’s hit count becomes 0.
You can set the logging severity level on a per-ACE basis if needed. Otherwise, severity level 6 is the default.
Tip
ACE logging generates logging message 106100 (default severity level 6), which has the following format:
%ASA-6-106100: access-list acl_ID {permitted | denied | est-allowed} protocol interface_name/source_address(source_port) -> interface_name/dest_address(dest_port) hit-cnt number ({first hit | number-second interval})
The ACL name acl_ID is shown to have permitted or denied a traffic flow. The specific traffic flow is defined as a protocol (UDP or TCP, for example), from the source (firewall interface name, IP address, and port) to the destination (firewall interface name, IP address, and port).
If this is the first packet in a flow, the hit count is 1, followed by the “first hit” flag. If the traffic flow has already been seen and is being tracked, this logging message appears at intervals defined along with the ACE log keyword. The hit count reflects how many times the same flow has been attempted, and the hit count interval is shown as a number of seconds. Using the hit count and interval timing values allows you to calculate the flow rate that is occurring.
1. Configure logging on specific access list entries:
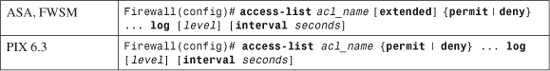
Enter the access list entry normally, but add the log keyword at the end. If you want to log activity on this entry at a severity level other than 6, specify the level (1 to 7) too.
As soon as a traffic flow triggers this ACE, the hit count begins to increment with each new occurrence of the same flow. Nonzero hit counts are reported with a logging message at intervals of seconds (1 to 600; the default is 300 seconds or 5 minutes).
Tip
If you already have an access list configured and in place on a firewall, you can safely add the logging capability to any number of ACEs within it. In other words, when log and its associated fields are added to an existing ACE, the ACE remains in its current location in the list sequence; it is not moved to the end of the list. In addition, you do not have to remove the ACE before configuring the log options. Simply re-enter the existing ACE and add the log keyword and options.
In the following example, an existing ACL called acl_out is being used on a production firewall. The third ACE needs to have logging added to it at severity level 4. Notice that after the ACE command is re-entered with log 4 added, it stays in the third ACE position and becomes active immediately.
Firewall# show running-config[output omitted]access-list acl_out permit icmp any anyaccess-list acl_out permit tcp any host 192.168.199.100 eq telnetaccess-list acl_out permit tcp any host 192.168.199.100 eq wwwaccess-list acl_out permit icmp any host 192.168.199.100[output omitted]Firewall(config)# access-list acl_out permit tcp any host 192.168.199.100 eq www log 4Firewall# show running-config[output omitted]access-list acl_out permit icmp any anyaccess-list acl_out permit tcp any host 192.168.199.100 eq telnetaccess-list acl_out permit tcp any host 192.168.199.100 eq www log 4access-list acl_out permit icmp any host 192.168.199.100[output omitted]
To disable message ID 106100 logging on an ACE, re-enter the command with the log default keywords appended. For example, the preceding shaded command would be re-entered as
Firewall(config)# access-list acl_out permit tcp any host 192.168.199.100 eq www log default
You can also re-enter the ACE with the log disable keywords to completely disable all ACE logging (both message IDs 106100 and 106023). In this case, the sample command would be re-entered as
Firewall(config)# access-list acl_out permit tcp any host 192.168.199.100 eq www log disable
2. Limit the volume of deny messages.
a. Limit the number of deny flows that are tracked:
Firewall(config)# access-list deny-flow-max n
Each unique traffic flow that is denied by an ACE configured for logging is added to a cached list of tracked flows. This usually is not a problem unless something like a denial-of-service attack causes a very large number of flows to be denied and tracked.
The firewall limits the maximum number of denied flows it tracks. By default, the maximum number is based on the available firewall memory: 4096 (64 MB or more), 1024 (16 MB or more), or 256 (less than 16 MB).
You can change this to a lower maximum number of flows by specifying n (1 to the default maximum).
b. (Optional) Send an alert when the number of tracked flows is too high:
Firewall(config)# access-list alert-interval seconds
When the maximum number of tracked flows is reached, the firewall generates logging message 106101. By default, this message is limited to appearing only every 300 seconds (5 minutes). You can change the alert interval to seconds (1 to 3600 seconds).
10-4 Analyzing Firewall Logs
The most important thing you can do with a firewall is collect and analyze its Syslog information.
Firewall logs should be inspected on a regular basis. Always make sure the Syslog collector or server is configured to archive older information and that disk space is not completely consumed.
The Syslog collector or server should be sized according to the following parameters:
• The number of firewalls and other network devices sending Syslog messages to the Syslog server
• The number of Syslog events per second (usually called EPS) generated by all devices
• How long Syslog information should be kept available
Consider the type of information you want to get from your firewall logs. Here are some examples:
• Connections permitted by firewall rules—Glancing through these messages can help you spot “holes” that remain open in your security policies.
• Connections denied by firewall rules—You can instantly see what types of activity are being directed toward your secured inside network.
• Denied rule rates—Using the ACE deny rate logging feature can show attacks that are occurring against your firewall.
• User activity—Firewall user authentication and command usage can all be logged, providing an audit trail of security policy changes.
• Cut-through-proxy activity—As end users authenticate and pass through the firewall, their activity can be logged for a general audit trail.
• Bandwidth usage—Firewall logs can show each connection that was built and torn down, as well as the duration and traffic volume used. This can be broken down by connection, user, department, and so on.
• Protocol usage—Firewall logs can show the protocols and port numbers that are used for each connection.
• Intrusion Detection System (IDS) activity—A firewall can be configured with a set of IDS signatures and can log attacks that occur.
• Address translation audit trail—If Network Address Translation (NAT) or Port Address Translation (PAT) is being used, the firewall logs can keep records of each translation that is built or torn down. This can be useful if you receive a report of malicious activity coming from inside your network toward the outside world. You can backtrack to find which internal user had a specific global IP address at a specific time.
You can scan the flat or raw Syslog data yourself to discover quite a few curious events or trends. However, if your firewall generates a large amount of logging information, you might want to invest in a firewall log analysis tool.
You should choose a logging analysis application that is tailored for firewalls so that the connection and ACL messages (among many others) can be fully interpreted and utilized. The following are some firewall logging analysis applications:
• CS-MARS from Cisco Systems (http://www.cisco.com)
• LogLogic Log Management and Intelligence Platform from LogLogic (http://www.loglogic.com)
• Network Intelligence Engine from Network Intelligence (http://www.network-intelligence.com)
• Network Security Analyzer and FirewallAnalyzer Enterprise from eIQnetworks (http://www.eiqnetworks.com)
• Sawmill Log Analyzer from FlowerFire (http://www.sawmill.net)
• CiscoWorks VPN and Security Management Solution (VMS) and Security Information Management Solution (SIMS) from Cisco Systems (http://www.cisco.com)
Consider the volume of Syslog information your firewalls and other network devices will generate. Syslog collection and analysis tools must be able to handle a sustained number of events per second so that no logging information is missed. They must also be able to store Syslog data over a reasonable period of time so that you can come back and analyze information from the recent past.
You can get an idea of how many events per second a firewall generates without having a Syslog collector already in place. You can use the firewall’s internal logging buffer as a gauge. Follow these steps:
1. Enable logging to the buffer at a severity level:
Firewall(config)# logging buffered level
Here, the severity level is set to level (0 to 7): emergencies (0), alerts (1), critical (2), errors (3), warnings (4), notifications (5), informational (6), or debugging (7). The higher the level, the more messages (and types of messages) that are generated.
Set this to the level you think will generate the logging messages you are most interested in recording. When this command is executed, logging to the buffer begins immediately.
2. Read the logging buffer counter as a baseline:
Firewall# show logging
Note when you issue this command. This begins the time period during which buffered logging is monitored.
The “n messages logged” counters cannot be reset while the firewall is operational. Therefore, you can take a reading of the buffer logging message counter now as a starting point. The logging counters are shown in the first few lines of output. For ASA and FWSM platforms, you can use the show logging setting command to omit any output except settings and counters.
In the following example, the firewall begins with 460,864 messages that have already been sent to the buffer, because buffered logging has been active in the past.
Firewall# show logging setting
Syslog logging: enabled
Facility: 20
Timestamp logging: disabled
Standby logging: disabled
Console logging: disabled
Monitor logging: disabled
Buffer logging: level informational, 460864 messages logged
Trap logging: level warnings, 1882119 messages logged
Logging to outside 192.168.254.100
History logging: disabled
Device ID: disabled
3. Wait 60 seconds and then see how many messages were sent to the buffer:
Firewall# show logging setting
Note the number of buffer messages logged now, and calculate the difference between this and the baseline number from Step 2. This is the number of messages generated at the desired severity level over the span of 60 seconds. Divide that by 60, and you have an estimate of events or messages per second (EPS).
In the following example, the firewall begins with 438,113 buffered messages. After 1 minute of buffered logging at severity level 6 (informational), the counter has risen to 460,864. Therefore, 460,864 minus 438,113 equals 22,751 messages in one minute, or 379 messages per second.
Firewall# config term
Firewall(config)# logging buffered informational
Firewall(config)# exit
Firewall# show logging setting
Syslog logging: enabled
Facility: 20
Timestamp logging: disabled
Standby logging: disabled
Console logging: disabled
Monitor logging: disabled
Buffer logging: level warnings, 438113 messages logged
Trap logging: level warnings, 1882092 messages logged
Logging to outside 192.168.254.100
History logging: disabled
Device ID: disabled
[after one minute]
Firewall# show logging setting
Syslog logging: enabled
Facility: 20
Timestamp logging: disabled
Standby logging: disabled
Console logging: disabled
Monitor logging: disabled
Buffer logging: level informational, 460864 messages logged
Sample Breakdown of Received Syslog Messages by Severity Level
Trap logging: level warnings, 1882119 messages logged
Logging to outside 192.168.254.100
History logging: disabled
Device ID: disabled
As you might expect, higher severity levels generate more logging messages. This is because the firewall reports on more types of normal activity. Higher severity levels actually mean that the events reported are less severe (more normal). Figure 10-4 shows a sample breakdown of the Syslog severity levels in messages that were collected over an hour from a firewall supporting an enterprise of several thousand users. Notice how the number of Local4.Critical (level 2) messages are few, progressing to the very large number of Local4.Info (level 6) messages.
Figure 10-4 Sample Breakdown of Received Syslog Messages by Severity Level