Chapter 13. The Art of Data and Event Analysis
This chapter covers the following topics:
• Using the 5-Tuple Correlation to Respond to Security Incidents
• Using Retrospective Analysis and Identifying Malicious Files
• Mapping Threat Intelligence with DNS and Other Artifacts
• Using Deterministic Versus Probabilistic Analysis
This chapter starts with details about how you can normalize security events and other data generated by different sources such as intrusion prevention systems (IPSs), firewalls, routers, and other infrastructure devices across your organization. In this chapter, you also learn how to use the 5-tuple correlation to respond to security incidents. You learn what retrospective analysis is and how to use it to reconstruct what happened after an attack has taken place. This chapter also teaches you how to use security tools to identify malicious files as well as how to map DNS, HTTP, and threat intelligence to identify and respond to attacks. Finally, this chapter ends with an explanation of the differences between deterministic and probabilistic analysis.
“Do I Know This Already?” Quiz
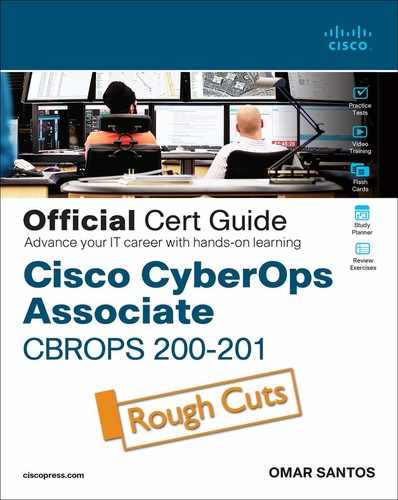
The “Do I Know This Already?” quiz allows you to assess whether you should read this entire chapter thoroughly or jump to the “Exam Preparation Tasks” section. If you are in doubt about your answers to these questions or your own assessment of your knowledge of the topics, read the entire chapter. Table 13-1 lists the major headings in this chapter and their corresponding “Do I Know This Already?” quiz questions. You can find the answers in Appendix A, “Answers to the ‘Do I Know This Already?’ Quizzes and Review Questions.”
Table 13-1 “Do I Know This Already?” Foundation Topics Section-to-Question Mapping
1. Which of the following is the process of capturing, storing, and analyzing data so that it exists in only one form?
a. Data normalization
b. Data correlation
c. Big data analytics
d. Retrospective analysis
2. Which of the following is not a data normalization method used in the industry?
a. First normal form (1NF)
b. First data ingest (FDI)
c. Second normal form (2NF)
d. Third normal form (3NF)
3. Which of the following is not an element in the 5-tuple?
a. Source IP address
b. Source port
c. Protocol
d. IP option
4. Which of the following describes the security event log shown here?
a. NetFlow record
b. Traditional firewall syslog
c. WSA log
d. Intrusion prevention system (IPS) or intrusion detection system (IDS) log
5. Which of the following statements is true about retrospective analysis?
a. Cisco Talos uses threat intelligence from Cisco to perform retrospective analysis and protection. Cisco AMP also provides device and file trajectory capabilities to allow the security administrator to analyze the full spectrum of an attack.
b. Cisco AMP for Endpoints uses threat intelligence from Cisco to perform retrospective analysis and protection. However, Cisco AMP for Networks does not support device and file trajectory capabilities to allow the security administrator to analyze the full spectrum of an attack.
c. Cisco AMP uses threat intelligence from Cisco Talos to perform retrospective analysis and protection. Cisco AMP also provides device and file trajectory capabilities to allow the security administrator to analyze the full spectrum of an attack.
d. Cisco AMP uses threat intelligence from Cisco WSA to perform retrospective analysis and protection. Cisco WSA also provides device and file trajectory capabilities to allow the security administrator to analyze the full spectrum of an attack.
6. Which of the following can be combined with security event logs to identify compromised systems and communications to command and control (CnC or C2) servers?
a. PII
b. PHI
c. AH/ESP
d. DNS
7. In which type of analysis do you know and obtain “facts” about the incident, breach, and affected applications?
a. Probabilistic
b. Compound
c. Deterministic
d. Dynamic
Foundation Topics
Normalizing Data
![]()
Data normalization is the process of capturing, storing, and analyzing data (security-related events, in this case) so that it exists in only one form. One of the main goals of data normalization is to purge redundant data while maintaining data integrity. The normalized data is protected by making sure that any manifestation of the same data elsewhere is only making a reference to the data that is being stored.
Another goal of security data normalization is to eliminate the risk of evasions and ambiguities. There are different types of normalization, depending on levels of increasing complexity. The following are three different types of data normalization categories used in the industry:
• First normal form (1NF)
• Second normal form (2NF)
• Third normal form (3NF)
These categories can continue to increase in form and complexity, depending on your requirements and environmental needs.
Intrusion prevention systems (IPSs) focus on throughput for the most rapid and optimal inline performance. While doing so, in most cases, it is impossible for full normalization to take place. Traditional IPS devices often rely on shortcuts that only implement partial normalization and partial inspection. However, this increases the risk of evasions. Fragmentation handling is an example of such an evasion.
Next-generation IPS devices perform data normalization in a very effective way. They analyze data as a normalized stream instead of as single or combined packets. This ensures there is a unique way to interpret network traffic passing through the security appliance.
Interpreting Common Data Values into a Universal Format
![]()
It is important that you have a way to interpret common data values into a universal format and have a good data model. Okay, so what’s a data model? It is a hierarchically structured mapping of semantic knowledge about one or more data sets. Having a good data model for all your security event data allows you to build an assortment of specialized (and fast) queries of those data sets.
To be able to create an effective data model, you must first understand the sources of security event data in your infrastructure. Figure 13-1 illustrates a security information and event management (SIEM) system receiving data from different sources, including IPS devices, firewalls, NetFlow generating devices, servers, endpoints, and syslogs from infrastructure devices.

Figure 13-1 SIEM Receiving Security Event Data from Different Sources
Your data model architecture can be affected by how the security event data is structured from each of these sources and by your data semantics (how the different fields in your data are extracted, related, and organized).
Tools such as Splunk already accept data from well-known security devices and other sources. Such tools allow you to arrange the data to have it get additional fields at search time through regex-based field extractions, lookups, and evaluation expressions, once you have a data model created.
There’s also a problem within the industry concerning the different ways security tools and humans refer to security events, incidents, and related information. This is why specifications such as the Vocabulary for Event Recording and Incident Sharing (VERIS) have been created. Per the website http://veriscommunity.net/veris-overview.html, “VERIS is a set of metrics designed to provide a common language for describing security incidents in a structured and repeatable manner. The overall goal is to lay a foundation on which we can constructively and cooperatively learn from our experiences to better manage risk.”
Using the 5-Tuple Correlation to Respond to Security Incidents
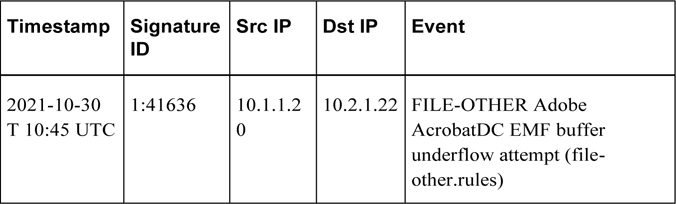
The 5-tuple refers to the following five elements:
• Source IP address
• Source port
• Destination IP address
• Destination port
• Protocol
This is also illustrated in Figure 13-2.
![]()
Figure 13-2 The 5-Tuple
Traditional firewalls typically provide security event logs that are mostly based on the 5-tuple. For instance, in traditional Cisco ASA logs, you might see logs similar to the following:
%ASA-3-106010: Deny inbound protocol
src [interface_name:source_address/source_port]([ idfw_user | FQDN_string ],
sg_info)] dst [ interface_name : dest_address / dest_port }
[([ idfw_user | FQDN_string ], sg_info)]
The following is another example:
%ASA-6-106015: Deny TCP (no connection) from IP_address /port to IP_address /port flags tcp_flags on interface interface_name
In the second example, the Cisco ASA dropped a TCP packet that didn’t have any associated connection in its connection table. In short, the Cisco ASA looks for a SYN flag in the first packet of a TCP connection. The Cisco ASA will drop the packet if the SYN flag is not set and there is no existing connection.
Tip
You also see the 5-tuple in IPS events, NetFlow records, and other event data. In fact, on the exam you may need to differentiate between a firewall log versus a traditional IPS or IDS event. One of the things to remember is that traditional IDS and IPS use signatures, so an easy way to differentiate is by looking for a signature ID (SigID). If you see a signature ID, then most definitely the event is a traditional IPS or IDS event.
Let’s look at another example. Figure 13-3 shows the output of a packet capture. Try to identify the 5-tuple in packet 9 and at the same time describe what types of transactions are shown in the packet capture.
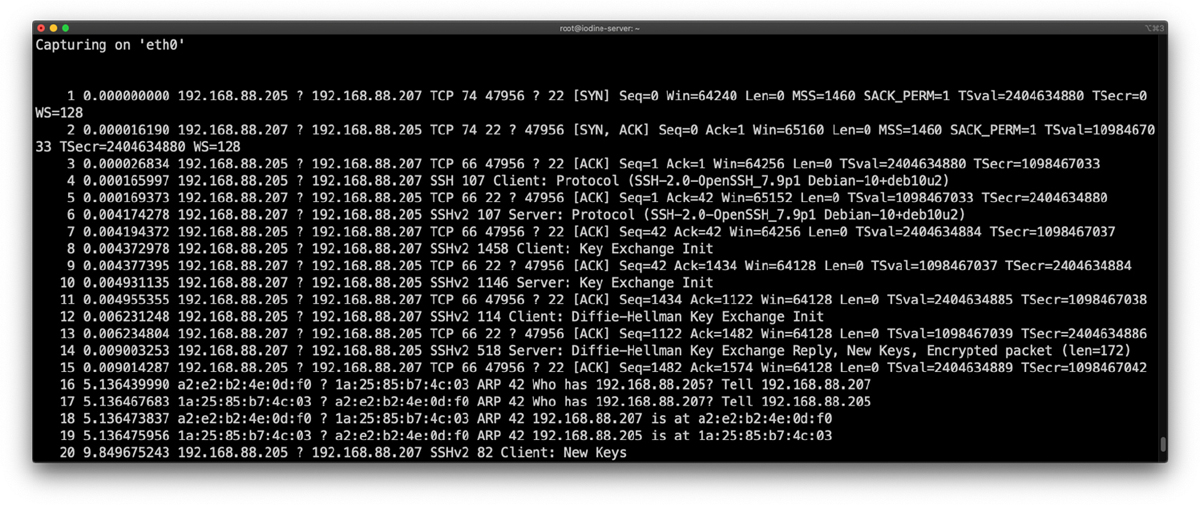
Figure 13-3 The 5-Tuple Example in a Packet Capture
The following is the 5-tuple of packet 9:
• Source IP: 192.168.88.207
• Destination IP: 192.168.88.205
• Source Port: 47956
• Destination Port: 22
• Protocol: TCP
In Figure 13-3 there are also two types of transactions or protocols. Packets 1 through 15 and 20 are related to an SSH connection from a client (192.168.88.205) to a server (192.168.88.207). Packet 9 is just an ACK packet from the server to the client during the SSH negotiation. Packets 16 through 19 are Address Resolution Protocol (ARP) packets.
Using Retrospective Analysis and Identifying Malicious Files
![]()
Cisco Advanced Malware Protection (AMP) for Networks and AMP for Endpoints provide mitigation capabilities that go beyond point-in-time detection. They use threat intelligence from Cisco TALOS to perform retrospective analysis and protection. Cisco AMP also provides device and file trajectory capabilities to allow the security administrator to analyze the full spectrum of an attack.
You can track the transmission of any file with an AMP cloud-assigned disposition. The system can use information related to detecting and blocking malware from both AMP for Networks (for example, used in Firepower Threat Defense and other Cisco security products) and AMP for Endpoints to build the trajectory. The Network File Trajectory List page displays the malware most recently detected on your network, as well as the files whose trajectory maps you have most recently viewed. From these lists, you can view when each file was most recently seen on the network as well as the file’s SHA-256 hash value, name, type, current file disposition, contents (for archive files), and the number of events associated with the file. The page also contains a search box that lets you locate a file based on SHA-256 hash value or filename or by the IP address of the host that transferred or received the file. After you locate a file, you can click the file SHA-256 value to view the detailed trajectory map.
Identifying a Malicious File
Figure 13-4 shows the Network File Trajectory screen of the Cisco Firepower Management Center (FMC) for some malware (in this case, the Angler Exploit Kit).

Figure 13-4 Cisco FMC Network File Trajectory and Retrospective Analysis
In Figure 13-4, you can see that the file was first seen on January 9 at 04:05:55 on two hosts (85.143.222.170 and 10.1.117.142). It then subsequently spread to another host in the network.
Mapping Threat Intelligence with DNS and Other Artifacts
![]()
Security threat intelligence is extremely useful when you need to correlate events and gain an insight into what known threats are in your network. DNS intelligence and URL reputation are used in many security solutions such as the Cisco Firepower appliances, Cisco Firepower Threat Defense (FTD), the Cisco Web and Email security appliances, and Cisco Umbrella. For instance, you can correlate security events based on threat intelligence to identify communications to known malicious command and control (CnC or C2) servers and other malicious communication based on DNS information. Figure 13-5 shows different security threat intelligence events in the Cisco FMC.
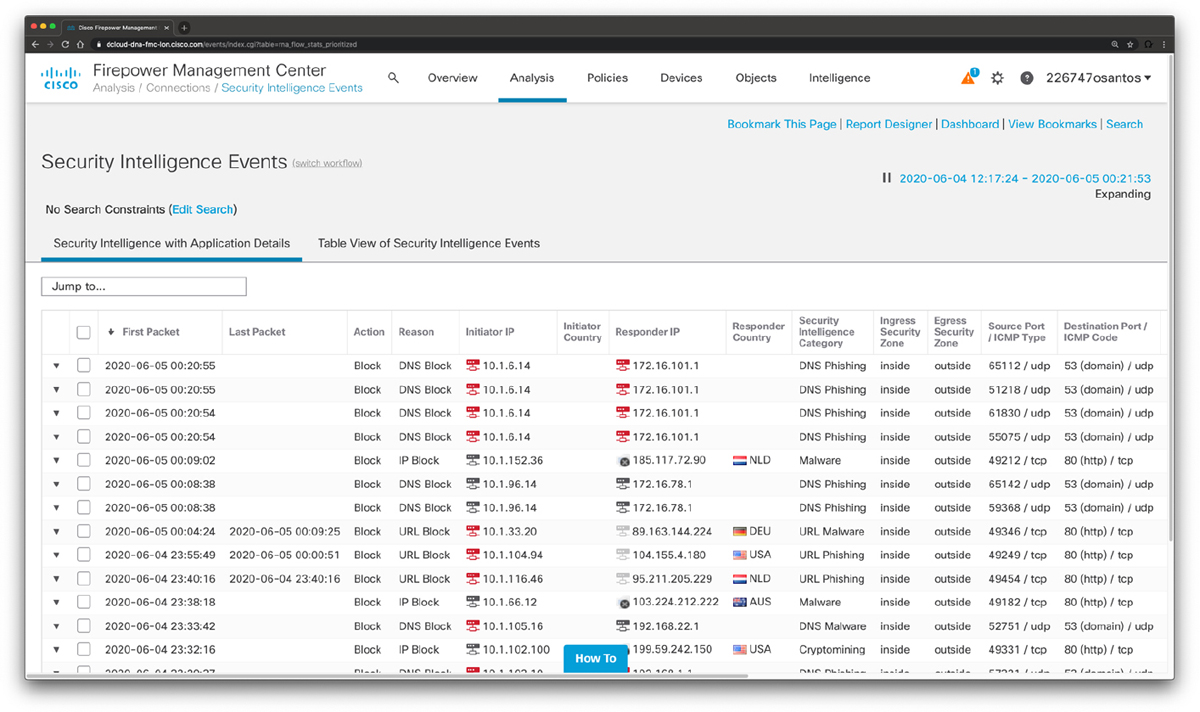
Figure 13-5 Cisco FMC Security Intelligence Events
In Figure 13-5, you can see DNS phishing, URL phishing, crypto mining, and malware activity, along with different DNS-based information.
Using Deterministic Versus Probabilistic Analysis
![]()
Two methods for security analysis have been described and implemented in the industry: deterministic and probabilistic.
In deterministic analysis, all data used for the analysis is known beforehand. Probabilistic analysis, on the other hand, is done assuming the likelihood that something will or has happened, but you don’t know exactly when or how.
Probabilistic methods institute powerful tools for use in many kinds of decision-making problems—in this case, cybersecurity event analysis. In this type of analysis, the analysis components suggest a “probabilistic answer” to the results of the investigation, which is not a definitive result.
In deterministic analysis, you know and obtain “facts” about the incident, breach, affected applications, and so on. For instance, by analyzing applications using port-based analysis and similar methods, you can assume that the process is deterministic—especially when applications conform to the specifications of the standards. Unfortunately, some applications do not follow the standards. A good example is peer-to-peer (P2P) applications, which try to evade firewalls by using ephemeral ports. This is why, in many cases, probabilistic analysis is done.
Exam Preparation Tasks
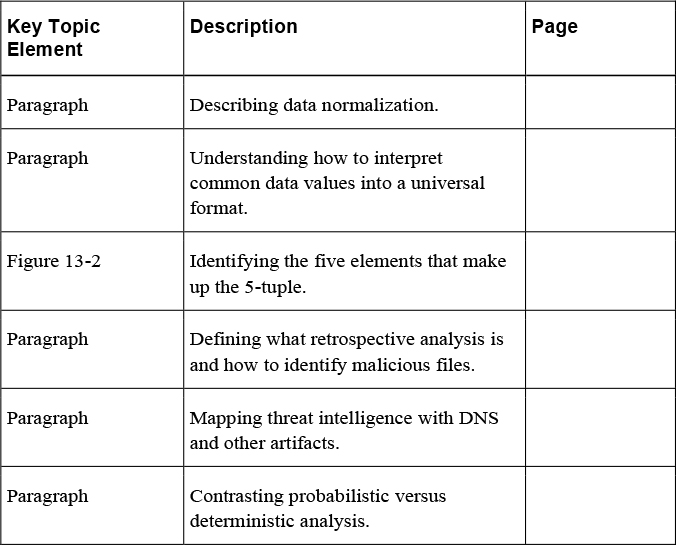
Review All Key Topics
Review the most important topics in the chapter, noted with the Key Topic icon in the outer margin of the page. Table 13-2 lists these key topics and the page numbers on which each is found.
![]()
Table 13-2 Key Topics for Chapter 13
Define Key Terms
Define the following key terms from this chapter and check your answers in the glossary:
Review Questions
The answers to these questions appear in Appendix A, “Answers to the ‘Do I Know This Already?’ Quizzes and Review Questions.” For more practice with exam format questions, use the exam engine on the website.
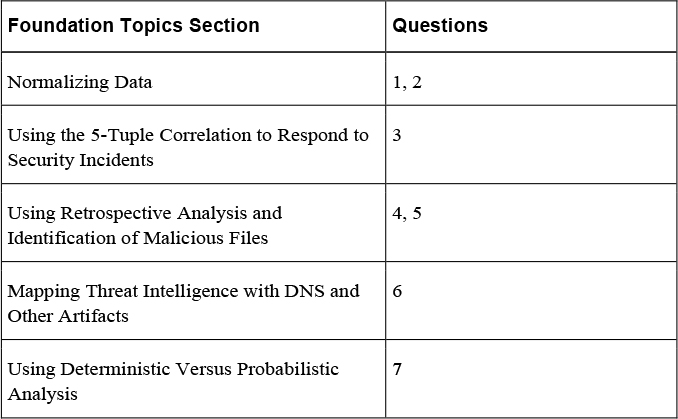
1. What is the type of security or event log or record described in the following table?

2. What type of security event log is the following?
%ASA-6-106015: Deny TCP (no connection) from 192.168.1.22/7263 to 10.1.2.3/80 flags 0xA1 on interface dmz.
3. Malicious communication to ______________ can be identified by correlating DNS intelligence and other security events.
4. Cisco Advanced Malware Protection (AMP) for Networks and AMP for Endpoints provide mitigation capabilities that go beyond point-in-time detection including threat _____________.
5. To purge redundant data while maintaining data integrity is one of the main goals of _______________.