We hope this book helps you become more successful and more organized in your commodity trading. I remember when I was first introduced to commodity trading back in 1987. I had been in the investment business for 13 years by then and specialized in the Point & Figure method of analysis, making it a natural extension to apply the Point & Figure methodology to my commodity trading. At this point I am sure your mind is racing with ideas and questions as we have covered a tremendous amount of material in this book. We have tried to harness what we have learned from our twenty years of experience in the commodity markets, and over 30 years of experience trading and researching the equity markets with the same tools. Amidst that, there are several crucial points that I don't want lost as you finish this book.
- Supply and demand drives it all. And you don't have to look hard to find examples from your everyday life. Any parent knows this firsthand from inevitably spending a Christmas season looking for “Tickle Me Elmo” or a Sony PlayStation 3. You might have found yourself camping out with other moms and dads at your local Circuit City or Toys ‘R’ Us, or you might have latched onto the modern day equivalent of a farmer's market at eBay.com, bidding thousands for that perfect gift to place under the tree for Christmas morning. I have always viewed commodities simply as another investment vehicle, just like stocks, that adhered to the irrefutable laws of supply and demand—nothing more, nothing less. When I began my own commodity trading, I approached it as nothing more than trading IBM. All the techniques we used to trade equities applied to commodities. To me orange juice was no different than live hogs and live hogs no different than rough rice. They all moved around like IBM or General Motors, in the sense that the very same forces affect them when we break price action down to the lowest common denominator. If there are more buyers than sellers willing to sell, then price must rise. When there are more sellers than buyers willing to buy, price must fall. And when buying and selling are equal, price will remain the same. But just like the produce in the supermarket, what is in season changes, though in the market it isn't determined by a calendar. Commodities will move in and out of favor, so you must construct a trading discipline that embodies both a buy and sell trigger. Many traders spend the bulk of their time crafting the buy decision, to the extent they never consider a sell discipline that is focused on limiting losses. The latter is essential to overall success; it must be central to all that you do in investments, especially in commodities.
- Commodities can have a place in any investor's portfolio. If you have ever been canoeing with a friend you can probably recall at least a time or two that one of you leaned a little too far to the left, or a little too far to the right. It was up to the other person in the boat to compensate by leaning in the opposite direction to counterbalance that action. If they didn't, well, as Newton famously stated, an object in motion stays in motion until acted upon by an outside force. Adding commodities to an equity portfolio acts much the same way—balancing out the equity portion of the portfolio to keep the boat righted in many markets. As you read in Chapter 8, in the last 37 years, there have only been two years when both the equity markets and the commodity markets experienced down years simultaneously. All too often, U.S. investors tend to be quite narrowly focused with respect to the markets that are available to them. One area that should always at least be considered is the commodity market, if for no other reason than that which we illuminated in Chapters 6 and 8, the commodity market has a very low correlation to the equity markets. In other words, they each move to the beat of their own drummer and thus can compliment each other nicely in an investment portfolio. For instance, consider Exhibit 9.1, which shows how an account with pure equities versus one equally weighted with equities and commodities (rebalanced annually) shows less volatility, drawdowns that are typically more shallow, and long-term returns that are better than either asset class on its own.
- Like any investment, overleverage is typically what will precede any large losses. This is not to be blamed on the underlying investment vehicle itself, as many mistakenly believe, but rather on the investor. As we pointed out in Chapters 7 and 8, one of the key differences between the commodity-related ETF market and the futures market is the lack of leverage in the former. This allows investors to access the commodity markets in accounts like individual retirement accounts (IRAs), 401(k)s, and other tax-sheltered accounts. This might be the equivalent of putting training wheels on a commodity investment, which may be the better path for many investors; you need to first be honest with yourself to determine your real risk tolerance and level of discipline. Take a look at our two hypothetical commodity traders in Exhibit 9.2. Trader A starts off with a good year, up 30 percent but then hits two losing years, falling 40 percent both years before recovering and making 30 percent two years in a row. Trader B starts off well too, up 20 percent. Then, the markets deal him a bad hand for two years in a row as well, but he contains his losses to 20 percent each year. Trader B also recovers during the next two years, up 20 percent in each of those years. Trader A's portfolio value has fallen from $100 to $79 during those five years, while Trader B has seen his portfolio value grow from $100 to $110. The lesson here is that you don't have to hit the ball out of the park to have a successful trading strategy. Consistent returns that limit losses will, in the end, allow you to score more runs.

EXHIBIT 9.1 Best of Both Worlds: How Commodities Can Smooth Volatility.
- Follow the trend. Sports fans will remember the football dynasty of the 1980s, the San Francisco 49ers. During their run, it seemed as if they were almost unstoppable. Then the head coach, Bill Walsh, retired and some of the players passed their prime; before long, the slide was on. The markets often move the same way—as the old adage says, “Don't fight the tape.” Once a trend is established, that trend can be harder to stop than a freight train. Just as all good things come to an end, eventually, so do the bad things, and new trends will always be developing somewhere. I think you will agree that throughout this book, we have emphasized the importance of determining the trend of any commodity or currency and then playing that trend so long as it remains in force. Sometimes this is years, others it may be weeks, but we must change when the trend suggests so. The Point & Figure chart is amazingly versatile because it not only guides us toward areas of establishing trends, but also provides definitive levels at which trend has in fact changed. For instance, if gold is in a positive trend, and then we begin to see lower tops, followed by lower bottoms, those are the first warning shots across the bow. This tells us trouble is beginning to set in for the near term, and if the bullish support line is violated that provides the final signal that things have moved from a positive outlook to a negative outlook, dictating our range of action for the foreseeable future.

EXHIBIT 9.2 A Tale of Two Traders.
In addition to the overall trend, the individual Point & Figure chart along with other technical tools, can provide us with valuable insight into timing the entry and exit points. As pointed out in Chapter 1, entry points take on even more importance when you are looking at a shorterterm trade, as we often are with individual commodity contracts. Keep the following checklist handy whenever you evaluate any commodity position—and always remember that the goal of this entire process is simply to stack as many odds in your favor as possible (Exhibit 9.3).
- Relative strength (RS), as you have learned, is one of the cornerstones of Dorsey, Wright's technical research. As the name implies, RS measures how one security is performing when compared directly with another; this comparison allows you to determine which security is outperforming the other. From this analysis, you want to invest in the vehicle that is outperforming the other, be it the market, another commodity or an index such as the CRB Index. However, we look to habitually steer clear of the underperformer. By focusing on strong RS commodities or currencies, for example, you put yourself in the position to capture large, positive outliers (winners), while avoiding big losers. The benefits of using relative strength in your analysis can be both short term and long term in nature, so RS can be applied by both traders and investors alike. One important aspect of relative strength to keep in mind is that it is a “relative” measurement. For this reason it is paramount that you use relative strength in conjunction with other “absolute” Point & Figure tools, such as trend and chart pattern analysis, especially when trading.

EXHIBIT 9.3 Commodity Evaluation Sheet.
There are many ways to apply relative strength to the commodities landscape. The concept can be used for both broad and specific commodity-related decisions. For example, as previously discussed, RS can determine if the equity market is outperforming the commodity market, as measured by the S&P 500 versus the CRB Index. This allows you to make macro asset allocation level decisions. Furthermore, RS can pinpoint specific opportunities within a sector of the commodity market, such as grains, or can be used to itemize a specific foreign currency situation. This can be accomplished by comparing one commodity or currency to another with an individual RS chart, such as the U.S. dollar versus the euro, or can be visualized by constructing an RS matrix of all grains or all the CurrencyShares ETFs, for example.
When considering investing in commodities and currencies, it is important to rely on RS first in a very broad-brushed approach, as this will allow you to make sound asset allocation (big) decisions. It will also minimize the number of decisions you need to make in the long run. First, answer the big questions, and from there you can use RS to pinpoint specific opportunities within that asset class. Exhibit 9.4 provides an example of how RS can be used in a very broad nature. As you can see, we have constructed an RS matrix that pits a number of different asset classes against one another. This allows us to determine which areas of the total market are performing the best. As this matrix suggests, International (EFA), domestic equities (RSP, SPX), and Gold (GC/) should command your attention first, given that they reside at the top of the matrix. Conversely, in this example, the broad commodity indexes (DJP, GSP, and DBC) and Crude Oil (CL/) should be avoided as they are exhibiting the weakest RS when compared to other assets. By consulting this single matrix you are provided with valuable information to make sound “big” investment decisions. Very clearly, within commodities specifically, a bet on gold rather than crude oil (or crude-dominated indexes) appears advisable based on this figure. (This posture was confirmed with a specific RS chart in Chapter 7, Exhibit 7.6.)

EXHIBIT 9.4 Total Market Access Class RS Matrix.
In Exhibit 9.5 we provide you with a summary table of RS applications. Hopefully, this information will allow you to easily remember the different uses and functions of RS.
- The list of commodity-related products currently available is growing nearly as fast as we can write this book. Throughout the course of this text, we have spent considerable time educating with respect to the subject of commodity investing via futures contracts. It wasn't very long ago that this was the only way to garner exposure to this alternative asset class for most investors, short of literally purchasing a farm and managing your own crop of corn or soybeans! The average investor now has access to commodities markets in ways that before were only dreamt of; and these offerings are expanding rapidly, almost daily. After reading Chapters 7 and 8, you are likely more aware of the products now available to you. For example, the greatest expansion in product offerings comes in the form of ETFs (and ETNs). This particularmedium has brought to your fingertips an array of choices, giving you the ability to play crude oil, grains, base metals, and the euro currency, to name a few, and to do so in much the same fashion as you would buy or sell a stock.

EXHIBIT 9.5 Relative Strength Application Examples.
The existing mutual fund universe also permits investment into commodity indexes and currencies (as discussed in Chapter 8), though with some limitations compared to the ETF. As this book is being sent to press there are many new commodity-based ETFs in registration (pending approval from the Securities and Exchange Commission), with PowerShares due to launch two new ETFs that will allow access to the U.S. dollar (either long or short). Moreover, Barclays Global (BGI) is expanding their commodity-based ETFs, and is currently waiting approval on a handful of ETFs that will allow you to play natural gas and livestock, among others. Bottom line: As an investor you have the power to truly diversify your investment portfolio due to the plethora of commodity and currency-related vehicles now available. In Exhibit 9.6 we summarize the current commodity product offerings within the mutual fund and ETF universe. For a more complete list of futures contracts that are available for trading, consult the appendix at the end of the book.
It is up to you to harness the power of these products and bring this asset class into your investment spectrum. The DWA web site database can be a great advantage for you in doing so, as we offer an extensive array of tools that permit you to technically analyze commodity futures, ETFs, and mutual funds; and we constantly endeavor to offer up-todate technical information on every commodity-related vehicle available. All Point & Figure concepts and indicators you learned throughout this text are available on our site—they are merely a mouse click away. Take advantage of the fact that you have such a powerful database of commodity information at your disposal, at www.dorseywright.com. In Exhibit 9.7 we show you a small glimpse of the technical tools offered on our site.

- Think big—“big picture,” that is. You've learned a great deal by this point, especially if this is your first introduction to Point & Figure analysis, but that knowledge does nothing for you if you suffer from chronic “analysis paralysis.” We've explained our process of commodity trading, but much of this book has focused upon using that asset class to produce an overall investment portfolio that better manages risk in the long run. Perhaps the greatest step for Dorsey, Wright in recent years has been our ability to refine relative strength into a systematic money management platform. Relative strength has been around in many forms for at least 70 years, we didn't invent it, but we have refined it into a powerful tool for overall portfolio management.

EXHIBIT 9.7 A Glimpse of DWA's Database.
The most widely known modern treatment of relative strength was offered by James O'Shaughnessy in his book, What Works on Wall Street. He tested, in a rigorous manner, what investing strategies can actually be proven to work in the stock market. He got access to the Compustat database and tested everything that had been purported to work—investing based on market capitalization, price-to-earnings ratios, price-to-book ratios, price-to-cashflow ratios, price-to-sales ratios, dividend yields, earnings per share, profit margins, return on equity, and relative strength—over a long period from 1951 to 1996. He tested them independently and in conjunction with other variables. He found that the market clearly and consistently rewarded certain attributes and consistently punishes others over a long period of time. His results were rather conclusive. He wrote, “Relative strength is one of the criteria in all 10 of the top-performing strategies, proving the maxim that you should never fight the tape.” In addition, he pointed out that the worst strategy he tested was the anti-relative strength strategy of bottom fishing.

EXHIBIT 9.8 A Truly Global, Truly Balanced Option.
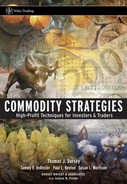
In 32 years in this business, I have found that there are no “get-richquick” schemes in the commodity or equity markets, none that have any staying power at least. Mr. O'Shaughnessy's findings speak directly to that point, though many would have you think otherwise. I also know that the commodity and equity markets have symbiotic characteristics within an investment allocation. This observation along with the advancements we have made in relative strength led to the creation of our first mutual fund, a global allocation fund titled the Arrow DWA Balanced Fund (DWAFX). I assure you this is no “get-rich-quick” fund, it is a fund that is truly balanced by always maintaining some level of exposure to U.S. equities, foreign equities, fixed income, and “alternative investments.” The latter is where commodities often come into the equation (Exhibit 9.8).
Each quadrant invests in ETFs related to that asset class, but the first thing that happens in the management of the product is a tactical overlay to determine the allocation that is deserved by each of the four quadrants. Then, the tactical tools are applied to the inventory within each quadrant to determine which areas have the strongest relative strength of that asset grouping. Through relative strength, the portfolio is designed to become more defensive through bonds and alternative investments when the equity markets are not in favor. When equities have the strongest relative strength, the weightings will vary accordingly toward that group. This fund is essentially a summation of everything we have discussed to this point. It employs the latest, most innovative, products on Wall Street and the timetested strategy of relative strength to create amanaged product that is truly global and truly balanced. As the list of available ETFs expands, so too will the ability of this fund to enter new markets. DWAFX may be something that you decide to incorporate into your own investments, or it can simply serve as an example of how this methodology can work seamlessly for a total allocation answer. For us, this is a way to be certain we are always thinking “big picture.”
Formore information on the fund, visit www.arrowfunds.com, you can also call Arrow Funds directly at 301-260-0163 and ask for Jake Griffith.
Successful commodity trading takes dedication, patience, and a logical, organized method of recording the imbalance between supply and demand. Never forget, as I mentioned before, it is the irrefutable law of supply and demand that causes all price change. Embrace this basic economic law and you will be well on your way to consistent trading profits. Finally, I want to leave you with a quote from the late great investor Bernard Baruch (1870–1965), which speaks to the necessity of finding a trend following system that provides you with conviction in your actions. I hope Point & Figure analysis is that system for you.
If a speculator is correct half of the time, he is hitting a good average. Even being right 3 or 4 times out of 10 should yield a person a fortune if he has the sense to cut his losses quickly on the ventures where he is wrong.
—Bernard Baruch
I invite you to utilize the commodity resources on the DWA web site. All of the tools discussed in this book are available on the web site—from charts, to relative strength tools to momentums to trading bands to matrix creation capabilities. I hope you have great success in trading. If you get a chance, let us know how you are doing; send me a note at [email protected]. We'd love to hear from you, and we answer all e-mails.