TIMING IS EVERYTHING
The exchange-traded fund (ETF) market has been the most important innovation in the equity markets in the last 30 years. The ETF market started slowly but over the last couple of years has virtually exploded. In 2006 alone there were more than 150 ETFs added, and 2007 looks like it is going to rival that. It appears that the time has finally come for the commodity-based ETF too as we experienced a flood in this area. Prior to 2006, the only commodity-based ETF was gold related. There are now ETFs based on precious metals, the energy markets, the agriculture markets, currencies, and more. But before we get to the specifics on evaluating commodity based ETFs, let's talk about this important market and structure of product. For those of you who have read my book, Point & Figure Charting, 3rd edition, this story about the beginning of the ETF market and my involvement might be familiar, but this product is such an important evolution on Wall Street that it deserves considerable treatment in this book as well.
It is said that timing is everything. In my life I certainly have found this to be true. I remember my early Navy days and how just four short months changed my life. I joined the Navy with the express purpose of entering underwater demolition (UDT) and then moving on to SEAL Team I. Out of boot camp I was told I had to first go to my duty station, Naval Air Squadron VP31, and then apply for underwater demolition. I did so and was accepted. Fortunately for me, I was stationed just down the road from the UDT training school while I waited for the next class to start. Since I was a Red Cross Water Safety Instructor, the squadron personnel department placed me in Air-Crew Training. They had been waiting for a water safety instructor to come through for months by then. I was immediately placed in the deep sea survival instructors group. My duties included teaching pilots who were heading to Vietnam how to survive in the ocean if they had to abandon their plane over the ocean.
As an enlisted man, the position as a deep water survival instructor was as good as it could get. So, when my underwater demolition class was about to begin, I decided to postpone the class for the second half of my enlistment if the squadron would allow me to stay in my survival instructor position. The squadron was perfectly happy to have me stay on, so the die was cast. I simply put on hold my desire to become a Navy SEAL until my last two years of enlistment. Well, all good things must come to an end, and my first two years of shore dutywere rapidly expiring. I had a choice—go to sea or go back to underwater demolition class. I chose UDT/SEAL training.
I was accepted to class again after spending three months getting in shape for the entrance test a second time. I ran into a little administrative wrinkle though. Since I waited for the second half of my enlistment to attend class, the Navy required that I extend my enlistment by four months to qualify for having two full years of naval duty following the end of training. Since I had made a commitment to go back to college at the end of my enlistment, I decided not to extend. As I look back in retrospect, this was a major turning point in my life. I was transferred to Vietnam on an aircraft carrier already steaming in the South China Sea. In fact, they flew me out to the ship on a mail plane. Experiencing an arrested landing on an aircraft carrier under full steam in the middle of an ocean is an experience I'll never forget.
I spent the next two years both at sea and on shore in San Diego. When I was honorably discharged from the Navy, I immediately went back to college. I'm sure, had I chosen UDT, I would not have gone back to college and would more than likely own a dive shop in some remote part of the world. It's interesting how life is full of choices. I made the right choice for me and went back to college. Soon after graduation and a short stint as a production supervisor at a winery, I found employment on Wall Street as a stockbroker at Merrill Lynch. One decision, not to extend my enlistment for four months, profoundly affected how my life turned out. Timing is everything.
Interestingly enough, during World War II the United States was cut off from rubber produced in Southeast Asia just as demand for the rubber was increasing significantly. Do you know what happened? We made synthetic rubber through a large national effort to both increase the output and quality of this rubber. Here is the clincher, though: After the war, we went right back to natural rubber even though we had weaned ourselves off it by creating high-quality, synthetic rubber. Why would we do that? It doesn't make sense. We had already broken away from the addiction to Southeast Asian rubber, but we went right back. The reason is simple: We just weren't ready as a society for synthetic rubber. Many years later we gravitated back to synthetic rubber, but only when we were ready as a society to accept it. The war accelerated the process of substitution beyond what was natural. After the war we settled back to the natural curve.
It's a classic example of the technology gap. New technologies emerge while we fight tooth and nail to hold onto the old guard. I remember that my company had to drag me away from WordPerfect to begin using Microsoft Word when the quality of Word was already superior to WordPerfect. I wanted the old technology I was used to. Look at the resistance that electricity met when Thomas Edison first developed it. People cried about the demise of the candle industry, not the acceptance of this new source of light. And so it is with financial products. They have a time and a place and until the time is right, substitution for the new will be slow coming.
HISTORY OF EXCHANGE-TRADED FUNDS
I remember my first thoughts on securitizing a basket of stocks came from working with the Philadelphia Stock Exchange (PHLX) Gold and Silver Index. I knew early on, before ETFs hit the market, their viability, as an investment vehicle, was undeniable. I remember vividly my conversations at the time with Joseph Rizzello, head of product development and marketing at the PHLX. The PHLX is one of the most progressive and forward-thinking exchanges in America. In 1983, the PHLX had just come out with options trading on indexes. It was truly a revolutionary idea developed by Joseph Rizzello. Much like the first commodity-based ETF is in gold, the first index options traded were on the PHLX Gold and Silver Index (XAU). This was the first product of its kind where an investor could simply make an investment in an option on an index of stocks in a particular sector, rather than having to focus on one stock itself.
At the time, the index was priced around the $600 level, and the options were naturally very expensive as well. It hit me one day that the real product was not the options that traded on this index, but rather the ability to buy the index itself. Having been a stockbroker in the past, I knew exactly what would have made the greatest difference in my business, and it would have been the ability to buy the index, a basket of stocks with a common theme, instead of the options on the index. What the PHLX needed to do was split the XAU 10-for-1, making it a $60 per share index and then securitize it. In other words, trade the XAU as a $60 stock, a stand-alone product. Then, add the options for those who were so inclined.
I knew in my heart that this had to be a fantastically successful product. It was as clear as a bell to me. I went to Joseph Rizzello, who was a close friend of mine, and he concurred. It would be a huge undertaking to create a product like that. It would be expensive to accomplish and it was very forward thinking—maybe, in fact, too forward thinking for the time.
Nothing happened with that idea for the XAU. But, Joseph Rizzello and the PHLX did come out with a product called Cash Index Participation (CIP) units, on the S&P 500 (SNP) and Dow Jones (BIG). These were theoretical baskets of stocks that acted like an index portfolio. You owned the unit in perpetuity and had a cash-out provision once a quarter. If the cashout provision was drifting away from the net asset value, those long the unit could ask for the net asset value of the unit. This prevented short sellers from manipulating the value of the unit. Because you owned the unit, when any components went ex-dividend, you would collect the dividend by debiting the short sellers and crediting those long the unit. The CIP unit could also be margined.
It was a fantastic product, but doomed from the start. I traveled all over the country with the PHLX holding seminars to packed houses. I mean packed houses of 500 to 600 brokers and professionals. The investment world wanted this product. But it was doomed because the futures exchanges decided to sue for the product. They suggested that the product was a futures contract and should come under their purview. This lawsuit resulted in a famous ruling called the Easterbrook Decision. The judge ruled in favor of the futures exchanges. While this instrument had all the elements of a security, it also had an element of futurity. Therefore, the courts ruled in favor of the futures exchanges. The futures exchanges, after winning the lawsuit, simply took the product and shelved it—“dead on arrival.”
That decision spurred the workings of the ETF that we now have in our arsenal of trading tools, but it came from an unlikely source. The Toronto Stock Exchange came to the PHLX to learn how the CIP was created. The Toronto Stock Exchange created the first ETF called TIPs (Toronto Index Participation Units), which traded on the Toronto Stock Exchange. Following the debut of the TIPS, the AMEX created the S&P 500 SPDRs (SPY), and now we have numerous vehicles to invest in that have the same characteristics as the CIP we first traveled the country marketing. Once again, timing was everything—this time society was ready and willing.
TODAY'S COMMODITY/CURRENCY ETF MARKET
The first ETFs to come to the market were based upon the equity markets. In fact, some of the first ETFs were the SPDRs and the QQQs, representing the S&P 500 and the NASDAQ 100; respectively. Other ETF providers came onto the scene starting in 2000 with Barclays introducing the iShares lineup. Other providers have since come onto the scene. The first commoditybased ETF was introduced by State Street Global Advisors (SSGA) and it was the StreetTRACKS Gold Shares (GLD). At this writing, there are 16 commodity-based ETFs ranging from contract specific ETFs to a basket of commodities, 9 different currency-based ETFs, and fixed income ETFs. In this chapter we deal specifically with commodity- and currencybased ETFs. We'll leave the fixed income ETFs for another book, but you'll learn the tools and strategies that you can easily apply to the fixed income ETFs.
Before we get into the ins and outs of using technical analysis to trade and invest in ETFs, let's start out with some basics about ETFs. There are a couple of different types of structures to the ETFs, but the basic premise is that this vehicle allows us to mimic an underlying index, like gold, oil, or the Goldman Sachs Commodity Index (GSCI). ETFs are different from mutual funds and commodity futures in a couple of ways. ETFs differ from mutual funds because ETFs do not trade at net asset value. However, traders on the floor will arbitrage the commodities or stocks underlying the ETF if a price disparity develops. They are also different from mutual funds because they trade throughout the day. You can buy and sell anytime during the day using stop loss orders and limits just like you would with a commodity or a stock. ETFs are also transparent. That is, most mutual funds do not list their current holdings and weightings (there are a couple of exceptions to that including the Rydex Family of Funds). On any day, one could go to the web site of the ETF in question, and find the current holdings and the weighting. This is very important in the evaluation of the ETF as you will learn a little later in this chapter.
The first difference between ETFs and commodity contracts is the leverage. At this time, commodity ETFs are not leveraged products and no commodity ETFs trade options and that could be one way to increase leverage. ETFs can be margined, but still not to the extent that you are leveraged when you have a commodity contract. For instance, let's say that you believe gold is likely to rise 10 percent in price from $600 an ounce to $660 per ounce. If you were to buy the StreetTRACKS GLD, for each share you purchase, you are essentially buying one tenth of an ounce of gold or you'd be paying $60 for the GLD. On the futures side of things, each gold contract represents 100 ounces of gold. So let's say that you wanted to invest in 100 ounces of gold, as you believe it is going to rise in price. You could purchase one gold contract, which would require that you put up $2,500 (margin requirement). Or you could purchase 1,000 shares of the GLD (.1 ounce per share × 1000 shares = 100 ounces of gold). That would cost you $60,000. Should gold rise to $660 per ounce, you've made 10 percent on your $60,000 investment in the GLD ($66,000 less initial investment of $60,000). If you had purchased the commodity contract, though, you would have also made $6,000 ($60 rise in gold price × 100 ounces per contract = $6,000). However, instead of that $6,000 representing a 10 percent gain, you've made 140 percent gain on your initial investment of $2,500.
While you may not be able to get the same leverage as having a commodity account, the commodity ETFs bring the accessibility of the commodity markets to a much wider investing audience. Because you don't have the leverage, you don't have to pass the financial requirements to open a commodity account. As well, accounts like an individual retirement account (IRA) now have the ability to gain exposure to an asset class with low correlation to the equity markets, where they would traditionally be invested. On the note of accessibility, one other difference between commodities and the commodity ETFs is the trading hours. For instance, commodity ETFs trade on the stock exchange trading days and hours, 9:30 A.M. to 4:00 P.M. Eastern Standard Time. Many commodity and currency contracts differ from that, with many having fewer hours of trading. For instance, if you were to purchase a sugar contract, it would have to be between the hours of nine and noon—and they talk about bankers having good hours! However, I could purchase the PowerShares DB Agriculture Fund (DBA), which has exposure to sugar, anytime between 9:30 A.M. and 4:00 P.M. Also like commodities, ETFs can be sold short if you believe that commodity or currency is poised to move lower in price.
In Exhibit 7.1 we have listed some web sites you will find helpful in learning more about ETF structures and what's available as you begin to use this product in your investments and trading as well as all of the currently available commodity or currency based ETFs. Those with an asterisk represent those ETF providers offering commodity or currency-based ETFs at the time of this writing. In Exhibit 7.2 you will find a listing of the current commodity and currency-based ETFs available at the time this book was written.


EXHIBIT 7.2 Commodity and Currency ETFs.
EVALUATING THE POINT & FIGURE CHART OF COMMODITY ETFS
The introduction of the first ETF based on a commodity came in November 2004 with the StreetTRACKS gold shares under the symbol GLD. This ETF is priced as one tenth the price of gold with an expense ratio of generally .40 percent. Instead of stock backing the ETF, actual gold is held in vaults. As this is being written, the GLD price is tracking greater than 99.9 percent to gold for the past 30 days, so you can see it is tracking the way it was designed to track.
The next commodity-based ETF was introduced by Barclays Global Investors, the iShares COMEX Gold Trust under the symbol IAU, in January 2005. According to Barclays, the IAU seeks to correspond generally, to the day-to-day movement of the price of gold bullion. The objective of the Trust is for the value to reflect, at any given time, the price of gold owned by the Trust at that time, less the expenses and liabilities of the Trust. Remember from our discussion above, gold ETFs are intrinsically different from trading gold commodities because they are not leveraged.
With any ETF, the most important consideration when determining whether to buy or sell, and how to manage a position, is to examine the ETF chart you are purchasing or selling. When you go to our web site at www.dorseywright.com, you will find that what we have done for most ETFs is extrapolate backwards the theoretical price movement of the ETF based on the underlying index, or commodity index. This makes it easier for the user to just pull up the ETF in question and evaluate it. With respect to the GLD or IAU, we would use the underlying price of gold. And let's say that gold was up 1 percent on any given day, then we would assume that the ETF was also up 1 percent that day. By doing this, we can create a long-term trend chart aswell as relative strength charts for commodity and currency-based ETFs. Let's take a minute and go through some of the technical analysis we apply to commodity ETFs using the StreetTRACKS GLD. We should note here that for box sizes on commodity ETFs, we will typically use our standard ETF pricing, which is slightly different from stock pricing and shown in Exhibit 7.3.
In any Point & Figure evaluation, the first thing we want to do is get a handle on the longer-term trend. Is gold trading on I-95 North and above the bullish support line or is it trading on I-95 South and below the bearish resistance line. Once we know the longer-term trend, we can then formulate appropriate strategies. In the case of the GLD, at www.dorseywright.com we have a chart that has been extrapolated back years based on the underlying price of London gold. Over the past 10 years there have been only two trend changes in this chart. As discussed previously, trend changes are very important for an investor in gold, and any trend line change should be taken seriously. With only two trend changes in the last 10 years you can see that we are talking about trends that stay intact for years at a time. We'll get to some trading techniques in a minute, but let's first focus on the longer-term gold signals from the Point & Figure methodology.

EXHIBIT 7.3 Point & figure box sizes for ETFs.

EXHIBIT 7.4 Trends in StreetTRACKS Gold Shares (GLD).
In Exhibit 7.4 we see that in the past 10 years, there have only been two trend changes for the GLD, so you can see that the trend of gold can remain intact for several years and help you to identify longer-term themes in the metal. During the course of these years, there are certainly corrections during uptrends and rallies during downtrends, but this chart, shown in Exhibit 7.5, gives us a terrific guideline for the overall trend of gold. Keep in mind that it is this trend that helps us determine the type of strategies we want to employ.
In addition to the trend of the Point & Figure chart, we can also look for specific patterns developing as opportunities to enter new positions or add to existing positions. In addition, we can combine that with other technical tools we use, like monthly momentum. Momentum calculations are simply a comparison between twomoving averages we developed many years ago. One is a short term and one is a long term moving average. We watch for crosses in the short-term weighted moving average over the longer-term average. Crosses of the short-term average to above the long-term average is said to create positive momentum. Conversely, crosses in the short-term average to below the long-term average is said to create negative momentum. We developed these momentum indexes back in the late 1970s when I was head of option strategy at Wheat First Securities. We used them to help us time option trades. They worked well back then, so we simply began to use them on all equities we followed. They are simply an addition to the Point & Figure chart.

EXHIBIT 7.5 Point & Figure Chart of StreetTracks Gold Shares (GLD)—1997–2007.
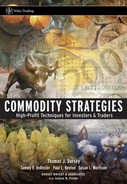
In Exhibit 7.6 you will see a monthly momentum table along with the Point & Figure trend chart of StreetTRACKS GLD in September 2005. Notice that the GLD was breaking a spread triple top at 45. This is typically a good pattern because the commodity has been going through a period of consolidation, and that consolidation creates a base from which it can move higher. If we combine that with the fact the monthly momentum turned positive for GLD in September 2005, it increases our probabilities that gold is ready for another upward move after about seven months of consolidation. In fact, during the time that the monthly momentum was positive, GLD rallied from 45 to 65, a gain of 44 percent in nine months. Then, the monthly momentum turned negative for the GLD and during the next nine months that the monthly momentum has been negative, the GLD has not made any net headway on its chart, still trading in the mid-60s. What's interesting is that now after nine months of negative monthly momentum, GLD has just broken a triple top on its chart, has maintained is long-term positive trend, and now momentum is very close to turning positive. Whether it plays out as well as last time or not is anyone's guess, but all we can do for any trade is stack as many odds in our favor as possible.
The patterns in commodity-based ETFs are all about the irrefutable law of supply and demand. I learned in my economics education that if there are more buyers than sellers willing to sell, the price must rise. Conversely, if there are more sellers than buyers willing to buy, then the price must go down. If buying and selling are equal, then the price must remain the same. This is as true for a stock, commodity, ETF, or cabbage. Again, for more information on trading strategies using currencies and commodities, we encourage you to revisit Chapters 4 and 5, as these same principles are applied to ETFs.
RELATIVE STRENGTH COMPARISONS
As you have gathered by now, relative strength (RS) is a very important tool in our work. It tells us where we should be and when we should be there. It smooths out the rough edges of the buy and sell signals and allows us to step back and see the big picture. When I think about relative strength, I recall the Zen story of an old man who accidentally falls into the river rapids leading to a high and dangerous waterfall. Onlookers feared for his life. Miraculously, he came out alive and unharmed downstream at the bottom of the falls. People were amazed he had lived and asked him how he managed to survive. The old man replied, “I accommodated myself to the water, not the water to me. Without thinking, I allowed myself to be shaped by it. Plunging into the swirl, I came out with the swirl. This is how I survived.”

EXHIBIT 7.6 Combining Trend, Patterns, and Momentum.
If we just let the market tell us what it is doing and we adapt ourselves, we'll come out fine. When we try to make the market accommodate us, that's when the trouble begins. This is probably where the old Wall Street adage, “The market can remain irrational much longer than we can remain solvent” comes from. Thinking back to 2000 in the equity markets, largecap stocks were all the rage. It's where all the money flowing into funds was going. But those well versed in reading the tides and currents of the river, that is, understanding the Point & Figure work, knew that in February 2000 the small-cap stocks moved back in favor. Instead of trying to fight the current, go with it and change where you are investing. Since that change, to the end of 2006, the S&P Smallcap 600 (SML) is up 90 percent, while the S&P 500 (SPX) is up only 2 percent.
Or if you had wanted to buy large-cap stocks, it was best to purchase the S&P 500 on an equal-weighted basis instead of a cap-weighted basis. Again, the relative strength chart alerted us to this switch in May 2000. That move has meant the difference between being profitable and basically breakeven from May 2000 to December 2006 in large-cap stocks. The S&P 500 Equal Weighted Index is up 65 percent, while the S&P 500 Cap Weighted Index is up only 3 percent. Trying to fight the water would make it much more difficult to survive the turbulence. You must accommodate yourself to the markets, not the other way around.
The same RS calculations that we perform on indices can be applied to the commodity markets, helping us to determine when the tide is coming in and when it is going out. For instance, as you read in Chapter 4, using an RS comparison of a broad commodity index versus an equity index like the S&P 500 can tell us where to be more heavily weighted in the portfolio. We can continue to get more specific with our RS calculations to determine, within a specific area, what is the best vehicle to use.
Let's take a look at a couple of different ways we could apply the RS tool in commodity- and currency-based ETFs. One simple comparison would be to compare something like the GLD to the PowerShares DB Commodity Index (DBC). Essentially, what we are trying to do with this RS chart is tell us whether we are better off to be concentrated in gold investments or should we be in a broader array of commodities with the DBC. You can see this relative strength chart in Exhibit 7.7. In this RS chart, a buy signal would suggest an investment in the GLD over the DBC. Conversely, a sell signal would signal an investment in the DBC over the GLD.

EXHIBIT 7.7 StreetTRACKS Gold Shares (GLD) versus Powershares DB Commodity Index (DBC) Relative Strength Chart.
Since 1996, there have only been two relative strength changes—yet another example of how RS tends to be longer term in nature. In this RS chart we see that the first signal was a sell (suggesting buying the DBC over the GLD), from April 2, 1996, to February 14, 2006. During this 10-year time frame, the DBC was up 117.38 percent compared to 41.16 percent for the GLD. Then the RS chart flipped to a buy signal, suggesting the GLD over the DBC. During the time frame that this signal has been in effect, the GLD is up 18.02 percent, almost three times the DBC, which is up 6.58 percent. With any RS chart, not every signal will work this well. However, what you will find is that you are still standing and able to fight another day, after the signals that don't work, because the chart will adapt and admit defeat, and that is all we can ask for any losing trade because no matter how many i's we dot and t's we cross, there will always be trades that don't work out. The key is to make sure your system is logical and then stick with your system, on each and every signal. So all in all, following the RS signals from this GLD versus DBC chart has kept you on the right side of the coin.
A couple of months prior to writing this book, CurrencySharesSM introduced eight ETFs allowing investors to gain exposure similar to that of holding a foreign currency. For the first time, investors have the ability to easily diversify holdings away from the U.S. dollar. This is especially attractive as we go beyond just being global; today, we are truly neighbors with other countries around the globe, and the sooner you get use to international investing, I think, the better off investors are going to be. One easy place to start is with the foreign currency market, which is the largest and most liquid financial market in the world. With the Point & Figure methodology's robust, adaptive nature, you will be armed with the tools you need to evaluate any ETFs on the market. Imagine, now you can hold your assets in your IRA in the euro instead of dollars should you choose. And, just like an equity, you can establish stop loss points. The possibilities that this opens are tremendous to the average investor.
Let's start off with an example alluded to above: Should I have cash in my accounts in U.S. dollars or the euro? To hold my cash in dollars I would just leave the money in a traditional money market account. However, I could choose to instead hold those monies in euros. But how would I know which one? The tool I like to use to answer that question is an RS chart. As you read about in Chapter 4, one can easily create an RS chart of the U.S. dollar to the euro. This same chart is shown again in Exhibit 7.8. As you can see in this figure, since 2002, the RS comparison has suggested that one be invested, longer term, in euros rather than the U.S. dollar. With the introduction in December 2005 of the Euro Currency Trust (FXE), this is easy to accomplish. The FXE is designed to track the price of the euro, net of Trust expenses, which will be taken from interest earned on the deposited euro. The Trust will not hold or trade in any currency swaps, options, futures, or other currency derivative products, or engage in any foreign exchange market transactions. The sole assets of the Trust are the euro deposited into the deposit account upon the creation of baskets and the euro earned as interest on the deposit account. The FXE is priced at 100 times the price of the euro.
But what if you wanted to drill deeper into the currency markets than just a comparison of the U.S. dollar to the euro? Here, the matrix concept also discussed in Chapter 4 can play an integral role. For instance, a DWA relative strength matrix between currencies could be created. You will find such a matrix in Exhibit 7.9. Recall that the DWA matrix is merely a compilation of RS charts. This graphic is a simplified way of showing how the Mexican peso, for instance, stacks up against all other currencies. The more RS buy signals it has versus others, the higher its ranking will be. In our example, the CurrencyShares British Pound Sterling Trust (FXB), CurrencyShares Swedish Krona Trust (FXS), and the CurrencyShares Euro Trust (FXE) all have seven RS buy signals, and that puts them at the top of the matrix (the number of X's, a measure of short-term RS, breaks the “tie”). Conversely, the NYCE U.S. Dollar Index Spot (DX/Y), the CurrencyShares Canadian Dollar Trust (FXC) and the CurrencyShares Japanese Yen Trust (FXY) all have only one buy signal, which places them at the bottom of the matrix.

EXHIBIT 7.8 U.S. Dollar versus Euro Relative Strength Chart.

EXHIBIT 7.9 DWA Currency Relative Strength Matrix.
Using this DWA matrix as a guideline, it would tell you where to hold your cash assets. At DWA, we always have numerous interns working with us. These interns are the brightest young people out there, and whenever we can, we try to work with international students. One thing we have always found interesting is the international students' understanding of currency risk. For many international students, currency exchange rate news is common dinnertime banter, but most American students have never thought about holding their cash in any other currency than the U.S. dollar. A tool like this matrix provides a snapshot picture of the strongest currencies and the weakest. It will serve you well to get more familiar with the international landscape.
The primary benefit of RS over time is to provide an effective entry point into areas of the market most likely to provide outperformance, and to then provide a tool that will stay with that area so long as it continues to generally outperform. RS has proven its merit within many different markets, and its application within the confines of a matrix format takes the RS concept to another level. From this RS concept, DWA has created a currency ETF allocation portfolio for our professional clients to utilize. Again, the basis for allocations within the portfolio will be made based on RS. Two levels of comparisons are made, the first of which determines whether the broad focus for a cash allocation should be domestic or foreign, and the second comparison being which foreign currency offers the best combination of near-term and long-term RS. The portfolio remains fully invested at all times but will always remain 50 percent invested in domestic currency (U.S. dollars) when the dollar is exhibiting strong RS against the average foreign currency. Conversely, if the domestic currency is not exhibiting positive RS versus the average foreign currency product, there will be no exposure to the U.S. dollar.
RS is a trend-following tool that naturally performs best in trending markets. Choppy markets, or periods of time when long-term RS signals are in the process of changing, typically present tough stretches for any RS-based portfolio. But the long-term benefits suggest that riding out these stretches of congestion more than fairly compensate the investor as the next market trend unveils itself. Exhibit 7.10 shows the annual returns of nine major currencies dating back to January 1999, as well as returns of an equal-weighted foreign currency index (DWAFXI) constituted by those nine currencies less the U.S. Dollar Index, and the hypothetical returns of the DWA Currency Model.
When I look at the returns of different currencies after an eightyear period, one of the most interesting things I notice is that the U.S. dollar is either at the top or at the bottom. There really isn't any inbetween ground. Because of this, some type of tactical approach is necessary to determine when I want to hold assets in dollars and when I want to hold them in foreign currencies. Utilizing a tactical model like our RS tools, a hypothetical back-tested portfolio constructed as we outlined above has kept our returns at the top of the comparison each year, and this consistent performance has put it as the number one performing entity over this eight-year stretch. (Note that none of these returns reflect interest.)

EXHIBIT 7.10 DWA Currency Relative Strength Matrix.
KNOW WHAT IS INSIDE
There are a number of different ways that ETFs can weight their components. As a quick review, with equity-based ETFs, one method is to price weight. In price weighting, the higher the price of the stock, the more weight it carries. This is the way the Dow Jones Industrial Average is priced. Another way to weight an index is by capitalization. That is, the larger capitalized the stock (shares outstanding times price), the more influence it has on the index. This is the most common way to weight indices and ETFs. With this type of weighting, just a handful of stocks can control the vast majority of an index's move. One can also weight an index equally. That is, each stock gets an equal vote. This is the way the DWA sector indicators and bullish percents are constructed, and we are seeing more and more ETFs constructed this way.
To be successful in playing ETFs, you must learn to look under the hood when evaluating the investment merits of any ETF. This is also the case with respect to commodity based ETFs. There are a number of different structures to ETFs and there is no better example than the energy or crude oil market. With the current line-up of almost 20 commodity-based ETFs and almost a dozen currency-based funds, there are at least five distinctly different fund structures that can have a very meaningful impact on how the fund reacts to different markets. To explain the differences within the various exchange-traded vehicles we will use the crude oilmarket as an example, as there are now four differently structured ways to gain access to the oil market through an exchange-traded medium.
In 2006 one of the new additions to the fund world was the iPath Exchange Traded Note (ETN) lineup of commodity-based products, one of which is the iPath Goldman Sachs Crude Oil Total Return Index (OIL) that began trading on the New York Stock Exchange (NYSE). OIL shares provide exposure to crude oil, but do so in a very different manner than the first crude oil–based product that was launched, the U.S. Oil Fund (USO). Barclays created OIL as a vehicle that tracks the Goldman Sachs Crude Oil Total Return Index through a note-linked security. This is different than the commodity pool ETF that trades under the symbol USO. Both are based on the price of crude oil, but the “tracking risk” falls upon the investor in the USO, while it falls upon Barclays with the OIL product. The difference between the two is important to understand if you plan on using these funds. The USO began trading at an opening price of $68.25 on the American Stock Exchange. The price this ETF began trading was certainly not arbitrary—it was the same price at which May 2006 crude oil futures contracts had closed the previous day on the New York Mercantile Exchange. The stated objective of this fund is to track the spot price of West Texas Intermediate light, sweet crude by investing in oil futures contracts traded on the New York Mercantile Exchange, or other U.S. and foreign exchanges if necessary. Investors in the fund have their money pooled together, and amanager allocates the fund across futures contracts, cash-settled options, and other cashlike vehicles in order to provide exposure similar to the price of oil.
The way that the USO is constructed is actually very different than the manner in which the previous commodity-based ETFs are created. The USO is created through the use of futures contracts, while the Gold & Silver ETFs (IAU, GLD, and SLV) are actually backed with the raw material in physical form, and the more recent ETN additions are created using note-linked securities. The assets of the Gold & Silver Bullion—related ETF's consist of stacks of gold or silver bars in a vault somewhere. A share of these ETFs represents actual ownership in bullion, rather than a futures contract. There is no such vault with barrels upon barrels of crude oil that represent units of the USO ETF. Rather, the managers of the oil fund essentially maintain a balance of crude oil futures contracts and cash, which together replicate the price of crude oil. The periodic problem with this construction, as many investors have seen in the early going of the fund, is the potential for tracking error due to contango or backwardation. Contango, specifically, is a term familiar to commodities traders that describes the occurrence of forward contracts being more expensive than near-month futures contracts on expiration. This means that commodity traders rolling out of October crude oil, and into November crude oil, for instance, have to somehow make up for the $0.95 difference in price between the two. Without going into a long dissertation on the subject, simply look at the tracking error of the USO for the first few months after it began trading in April 2006. This was a time when crude oil futures were in “contango” the entire time, the source of considerable tracking error from the spot crude market.
Con-tangled Up
USO Holdings on 4/10/06
96 contracts—June NYMEX Crude Oil (CL/M6)
4/10/06 Px of CL/M6: $68.25
$6,793,000 cash
USO Px: $68.25
USO Holdings on 8/21/06
5,051 contracts—October NYMEX Crude Oil (CL/V6)
8/21/06 Px of CL/V6: $73.30
$386,416,785 cash
USO Px: $67.42
Notice that USO began trading at a price of 68.25 back in April and has actually fallen in price to 67.42 by August. During that same time the “nearmonth” crude oil futures contracts have risen in price from 68.25 in April, to 73.30 by August 21, 2006. The October crude oil futures have rallied from 70.26 to 73.30. The issue, in other words, is that the fund has to pay more for the same amount of exposure every month, and this has caused a significant tracking error for the fund, such that the fund is down 1 percent while crude oil was actually up about 4 percent based on the October contracts. Shareholders of USO maintain tracking error risk as a function of contango, as well as slippage since the manager of the fund is literally turning over the fund's entire inventory of oil contracts every month.
The iPath Goldman Sachs Crude Oil Total Return Index (OIL) began trading on the NYSE in 2006 as an ETN, which is constructed quite differently, essentially transferring a large portion of the tracking risk to the fund provider (Barclays) and away from the investor. Clearly, buying OIL is not without risk, it just carries different risks. One risk is obviously that crude oil may actually go down in price, adversely affecting the price of something tied to the price of crude oil. Another risk specific to the iPath Oil Fund is that Barclays could file chapter 11. However, the tracking risk is a bit different with an ETN. This index measures the performance of a simple investment in oil futures, and that performance includes the change in the price of the futures contracts, the “roll yield” (positive if in backwardation, or negative if in contango), and the Treasury bill rate of interest that could be earned on collateral funds. The benefit on that front when compared to the USO shares is that there is no “slippage” in actually transacting a move from one contract to the next, eliminating some of the tracking error risk. But, because the GSCI Total Return Index does not finesse the “roll” of the futures contracts to maximize profits (contracts are simply rolled from the expiring month to the next month), the index may also lag other strategies when the oil markets remain in contango.
And then came yet another structure for commodity-based ETFs, primarily as a result of the exploited tracking error risk in the earlier funds. Early in 2007 PowerShares launched a number of commodity-based products, one of which being the PowerShares DB Oil Fund (DBO), based on the Deutsche Bank Liquid Commodity Crude Oil Index. The similarity to the other funds is that it is composed of futures contracts on light, sweet crude oil (WTI) and is intended to reflect the performance of crude oil. The primarily difference is that the index it tracks uses an “optimum yield” strategy that employs a rules-based method of selecting which contracts to “roll” to each month. The fund is structured such that it may look out up to 13 months to try and minimize the effects of contango, and maximize any backwardation that may be present within the oil markets. This fund actually invests in crude oil futures contracts like the U.S. Oil Fund, but applies a very different strategy in managing the fund over time.
The latest evolution within the world of commodity-based ETFs has come with the proliferation of MACRO Securities (MACROs), a joint venture between Claymore Advisors and MacroMarkets. MACROs are exchange-traded securities that are issued together, trade separately, and respectively track the upward or downward movement of an index or benchmark price. The first MACROs were launched in late 2006, paired across the value of spot crude oil. Based on the manner in which the MACROs are constructed, there are two exchange-traded vehicles that comprise the set, – an “up” MACRO for crude oil (UCR) and a “down” MACRO for crude oil (DCR). The two securities function as a zero-sum entity, if one rises in value, it does so at the expense of the other. For instance, as the value of crude oil rises, the value of the “up” MACRO rises in kind, and the value of the “down” MACRO falls accordingly. Contrarily, if crude oil falls, the reverse happens.
These funds are structured in a unique fashion as the assets of each fund are wholly invested in Treasuries, with the two MACROs simply trading assets back and forth based on the value of the underlying benchmark. The income generated from the treasuries is used to cover expenses, and excess income is distributed to shareholders each quarter. There are circuit breakers, of sorts, for the crude oil MACROs. If crude falls to $9.00, or rises above $111.0, for three consecutive days the MACROs will cease trading. The expenses are currently higher than those of other commodity products, but while the OIL and USO are highly susceptible to negative “roll yields,” caused by contango, the crude oil MACROs are based on the spot price for crude oil and do not include any similar roll yield. In markets where the “roll yield” is positive for crude, UCR should underperform, while in markets with negative roll yields (such as 2006) UCR offers an exchange-traded solution that will likely hold up much better than other products.
In the end, there are now a number of different oil-related exchanged-traded products, and while the details are a bit voluminous, hopefully you now have a better understanding of what distinguishes one fund from the next. Essentially, we have five types of commodity-based ETFs today; they are roughly categorized in Exhibit 7.11.
WHAT DOES THE FUTURE HOLD?
What is the future of commodity and currency-based ETFs? I can't see how the horizon looks any different than the ETF landscape as a whole and that is to expand. We will continue to see the philosophies behind these ETFs develop. For instance, the PowerShares DB G10 Currency Harvest Fund (DBV), according to the web site www.dbfunds.com, “seeks to track the Deutsche Bank G10 Currency Future Harvest IndexTM by (1) entering into long futures contracts on the three G10 currencies associated with the highest interest rates, (2) entering into short futures contracts on the three G10 currencies associated with the lowest interest rates, and (3) collateralizing the futures contracts with United States 3-month Treasury bills.” A mere three years ago this type of strategy would have been available only through a hedge fund format. Now, we are seeing these types of formats expanding their reach through the ETF format.

EXHIBIT 7.11 Commodity ETF Structures.
With the Point & Figure methodology's robust, adaptive nature, you will be armed with the tools you need to evaluate any ETFs on the market though. In this extensive chapter we hope to have provided you with a better understanding of the ETF landscape. This includes both the development and the current expansion, as well as learning about the differences in ETF structures and the similarities between trading currency and commodity ETFs versus their counterparts in the futures world. And we hope that you have been able to see that the principles you learned about the Point & Figure methodology from Point & Figure Charting, 3rd edition, can be applied to the commodity and currency ETF market with ease since the irrefutable law of supply and demand drives all prices.