This book is primarily about graphics programming and mathematics. Rather than discussing general graphics subjects for end users or how to use graphics software, we will deal with more fundamental subjects, required for graphics programming. In this chapter, we will first understand and appreciate the nature of discreteness of displayed graphics on computer screens. We will then see that x- and y- coordinates need not necessarily be pixel numbers, also known as device coordinates. In many applications logical coordinates are more convenient, provided we can convert them to device coordinates. Especially with input from a mouse, we also need the inverse conversion, as we will see at the end of this chapter.
The most convenient way of specifying a line segment on a computer screen is by providing the coordinates of its two endpoints. In mathematics, coordinates are real numbers, but primitive line-drawing routines may require these to be integers. This is the case, for example, in the Java language, which we will use in this book. The Java Abstract Windows Toolkit (AWT) provides the class Graphics containing the method drawLine, which we use as follows to draw the line segment connecting A and B:
g.drawLine(xA, yA, xB, yB);
The graphics context g in front of the method is normally supplied as a parameter of the paint method we are using, and the four arguments of drawLine are integers, ranging from zero to some maximum value. The above call to drawLine produces exactly the same line as this one:
g.drawLine(xB, yB, xA, yA);
We will now use statements such as the above one in a complete Java program. Fortunately, you need not type these programs yourself, since they are available from the Internet, as specified in the Preface. It will also be necessary to install the Java Development Kit (JDK), which you can also download, using the following Web page:
http://java.sun.com/
If you are not yet familiar with Java, you should consult other books, such as some mentioned in the Bibliography, besides this one.
The following program draws the largest possible rectangle in a canvas. The color red is used to distinguish this rectangle from the frame border:
// RedRect.java: The largest possible rectangle in red.
import java.awt.*;
import java.awt.event.*;

public class RedRect extends Frame
{  public static void main(String[] args){new RedRect();}

   RedRect()
   {  super("RedRect");
      addWindowListener(new WindowAdapter()
{public void windowClosing(WindowEvent e){System.exit(0);}});
setSize (200, 100);
add("Center", new CvRedRect());
show();
}
}
class CvRedRect extends Canvas
{ public void paint(Graphics g)
{ Dimension d = getSize();
int maxX = d.width - 1, maxY = d.height - 1;
g.drawString("d.width = " + d.width, 10, 30);
g.drawString("d.height = " + d.height, 10, 60);
g.setColor(Color.red);
g.drawRect(0, 0, maxX, maxY);
}
}The call to drawRect almost at the end of this program has the same effect as these four lines:
g.drawLine(0, 0, maxX, 0);       // Top edge
g.drawLine(maxX, 0, maxX, maxY); // Right edge
g.drawLine(maxX, maxY, 0, maxY); // Bottom edge
g.drawLine(0, maxY, 0, 0);       // Left edge
The program contains two classes:
RedRect: The class for the frame, also used to close the application.
CvRedRect: The class for the canvas, in which we display graphics output.
However, after compiling the program by entering the command
javac RedRect.java
we notice that three class files have been generated: RedRect.class, CvRedRect.class and RedRect$1. class. The third one is referred to as an anonymous class since it has no name in the program. It is produced by the two program lines
addWindowListener(new WindowAdapter()
   {public void windowClosing(WindowEvent e){System.exit(0);}});
which enable the user of the program to terminate it in the normal way. We could have written the same program code as
addWindowListener
(  new WindowAdapter()
   {  public void windowClosing(WindowEvent e)
     {  System.exit(0);
     }
   }
);
to show more clearly the structure of this fragment. The argument of the method addWindowListener must be an object of a class that implements the interface WindowListener. This implies that this class must define seven methods, one of which is windowClosing. The base class WindowAdapter defines these seven methods as do-nothing functions. In the above fragment, the argument of addWindowListener denotes an object of an anonymous subclass of WindowAdapter. In this subclass we override the method windowClosing. A further discussion of this compact program code for event handling can be found in Appendix B.
The RedRect constructor shows that the frame size is set to 200 × 100. If we do not modify this size (by dragging a corner or an edge of the window), the canvas size is somewhat less. After compilation, we run the program by typing the command
java RedRect
which produces the output shown in Figure 1.1.

The blank area in a frame, which we use for graphics output, is referred to as a client rectangle in Microsoft Windows programming. We will consistently use a canvas for it, which is a subclass, such as CvRedRect in program RedRect.java, of the AWT class Canvas. If, instead, we displayed the output directly in the frame, we would have a problem with the coordinate system: its origin would be in the top-left corner of the frame; in other words, the x-coordinates increase from left to right and y-coordinates from top to bottom. Although there is a method getInsets to obtain the widths of all four borders of a frame so that we could compute the dimensions of the client rectangle ourselves, we prefer to use a canvas.
The tiny screen elements that we can assign a color are called pixels (short for picture elements), and the integer x- and y-values used for them are referred to as device coordinates. Although there are 200 pixels on a horizontal line in the entire frame, only 192 of these lie on the canvas, the remaining 8 being used for the left and right borders. On a vertical line, there are 100 pixels for the whole frame, but only 73 for the canvas. Apparently, the remaining 27 pixels are used for the title bar and for the top and bottom borders. Since these numbers may differ in different Java implementations and the user can change the window size, it is desirable that our program can determine the canvas dimensions. We do this by using the getSize method of the class Component, which is a superclass of Canvas. The following program lines in the paint method show how we obtain the canvas dimensions and how we interpret them:
Dimension d = getSize();
int maxX = d.width - 1, maxY = d.height - 1;
The getSize method of Component (a superclass of Canvas) supplies us with the numbers of pixels on horizontal and vertical lines of the canvas. Since we begin counting at zero, the highest pixel numbers, maxX and maxY, on these lines are one less than these numbers of pixels. Remember that this is similar with arrays in Java and C. For example, if we write
int[] a = new int[8];
the highest possible index value is 7, not 8. Figure 1.2 illustrates this for a very small canvas, which is only 8 pixels wide and 4 high, showing a much-enlarged screen grid structure. It also shows that the line connecting the points (0, 0) and (7, 3) is approximated by a set of eight pixels.
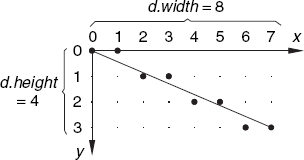
The big dots approximating the line denote pixels that are set to the foreground color. By default, this foreground color is black, while the background color is white. These eight pixels are made black as a result of this call:
g.drawLine (0, 0, 7, 3);
In the program RedRect.java, we used the following call to the drawRect method (instead of four calls to drawLine):
g.drawRect(0, 0, maxX, maxY);
In general, the call
g.drawRect(x, y, w, h);
draws a rectangle with (x, y) as its top-left and (x + w, y + h) as its bottom-right corners. In other words, the third and fourth arguments of the drawRect method specify the width and height, rather than the bottom-right corner, of the rectangle to be drawn. Note that this rectangle is w + 1 pixels wide and h + 1 pixels high. The smallest possible square, consisting of 2 × 2 pixels, is drawn by this call
g.drawRect(x, y, 1, 1);
To put only one pixel on the screen, we cannot use drawRect, because nothing at all appears if we try to set the third and fourth arguments of this method to zero. Curiously enough, Java does not provide a special method for this purpose, so we have to use this call:
g.drawLine(x, y, x, y);
Note that the call
g.drawLine(xA, y, xB, y);
draws a horizontal line consisting of | xB – xA | + 1 pixels.
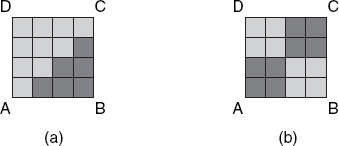
In mathematics, lines are continuous and have no thickness, but they are discrete and at least one pixel thick in our graphics output. This difference in the interpretation of the notion of lines may not cause any problems if the pixels are very small in comparison with what we are drawing. However, we should be aware that there may be such problems in special cases, as Figure 1.3(a) illustrates. Suppose that we have to draw a filled square ABCD of, say, 4 × 4 pixels, consisting of the bottom-right triangle ABC and the upper-left triangle ACD, which we want to paint in dark gray and light gray, respectively, without drawing any lines. Strangely enough, it is not clear how this can be done: if we make the diagonal AC light gray, triangle ABC contains fewer pixels than triangle ACD; if we make it dark gray, it is the other way round.
A much easier but still non-trivial problem, illustrated by Figure 1.3(b), is filling the squares of a checker-board with, say, dark and light gray squares instead of black and white ones. Unlike squares in mathematics, those on the computer screen deserve special attention with regard to the edges belonging or not belonging to the filled regions. We have seen that the call
g.drawRect(x, y, w, h);
draws a rectangle with corners (x, y) and (x + w, y + h). The method fillRect, on the other hand, fills a slightly smaller rectangle. The call
g.fillRect(x, y, w, h);
assigns the current foreground color to a rectangle consisting of w × h pixels. This rectangle has (x, y) as its top-left and (x + w – 1, y + h – 1) as its bottom-right corner. To obtain a generalization of Figure 1.3(b), the following method, checker, draws an n × n checker board, with (x, y) as its top-left corner and with dark gray and light gray squares, each consisting of w × w pixels. The bottom-left square will always be dark gray because for this square we have i = 0 and j = n – 1, so that i + n – j = 1:
void checker(Graphics g, int x, int y, int n, int w)
{  for (int i=0; i<n; i++)
       for (int j=0; j<n; j++)
       {  g.setColor((i + n − j) \% 2 == 0 ?
             Color.lightGray : Color.darkGray);
          g.fillRect(x + i * w, y + j * w, w, w);
       }
}
If we wanted to draw only the edges of each square, also in dark gray and light gray, we would have to replace the above call to fillRect with
g.drawRect(x + i * w, y + j * w, w - 1, w - 1);
in which the last two arguments are w – 1 instead of w.
As Figure 1.2 shows, the origin of the device-coordinate systems lies at the top-left corner of the canvas, so that the positive y-axis, points downward. This is reasonable for text output, where we start at the top and increase y as we go to the next line of text. However, this direction of the y-axis is different from normal mathematical practice and therefore often inconvenient in graphics applications. For example, in a discussion about a line with a positive slope, we expect to go upward when we move along this line from left to right. Fortunately, we can arrange for the positive y direction to be reversed by performing this simple transformation:
| y′ = maxY – y |
Instead of the discrete (integer) coordinates we are using at the lower, device-oriented level, we want to use continuous (floating-point) coordinates at the higher, problem-oriented level. Other usual terms are device and logical coordinates, respectively. Writing conversion routines to compute device coordinates from the corresponding logical ones and vice versa is a bit tricky. We must be aware that there are two solutions to this problem, even in the simple case in which increasing a logical coordinate by one results in increasing the device coordinate also by one. We want to write the following methods:
iX(x), iY(y): | the device coordinates of the point with logical coordinates x and y; |
fx(x), fy(y): | the logical coordinates of the point with device coordinates x and y. |
With regard to x-coordinates, the first solution is based on rounding:
int iX(float x){return Math.round(x);}
float fx(int x){return (float)x;}
For example, with this solution we have
| iX(2.8) = 3 and fx(3) = 3.0 |
The second solution is based on truncating:
int iX(float x){return (int)x;}           // Not used in
float fx(int x){return (float)x + 0.5F;}  // this book.
With these conversion functions, we would have
| iX(2.8) = 2 and fx(2) = 2.5 |
With both solutions, the difference between any value x and fx(iX(x)) is not greater than 0.5. We will use the first solution throughout this book, since it is the better one if logical coordinates frequently happen to be integer values. In these cases the practice of truncating floating-point numbers will often lead to worse results than we would have with rounding.
Besides the above methods iX and fx (based on the first solution) for x-coordinates, we need similar methods for y-coordinates, taking into account the opposite directions of the two y-axes. At the bottom of the canvas the device y-coordinate is maxY while the logical y-coordinate is 0, which may explain the two expressions of the form maxY – ... in the following methods:
int iX(float x){return Math.round(x);}
int iY(float y){return maxY - Math.round(y);}
float fx(int x){return (float)x;}
float fy(int y){return (float)(maxY - y);}
Figure 1.4 shows a fragment of a canvas, based on maxY = 16.
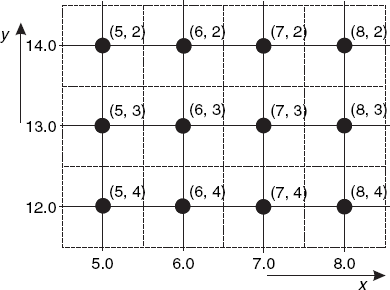
The pixels are denoted as black dots, each placed in the center of a square of dashed lines. In this discussion and elsewhere in this book, let us write x and y for logical and X and Y for device coordinates. (Since it is customary in Java to use lower-case letters at the beginning of variable names, we will not write X and Y in program text.) In Figure 1.4, the device-coordinates (X, Y) are placed between parentheses near each dot. For example, the pixel with device coordinates (8, 2), at the upper-right corner of this canvas fragment, has logical coordinates (8.0, 14.0). We have
iX (8.0)  = Math.round (8.0) = 8
iY (14.0) = 16 - Math.round (14.0) = 2
fx (8)    = (float)8 = 8.0
fy (2)    = (float) (16 - 2) = 14.0
The dashed square around this dot denotes all points (x, y) satisfying
| 7.5 ≤ x < 8.5 |
| 13.5 ≤ y < 14.5 |
All these points are converted to the pixel (8, 2) by our methods iX and iY.
Let us demonstrate this way of converting floating-point logical coordinates to integer device coordinates in a program that begins by drawing an equilateral triangle ABC, with the side AB at the bottom and the point C at the top. Then, using
| q = 0.05 p = 1 – q = 0.95 |
we compute the new points A′, B′ and C′ near A, B and C and lying on the sides AB, BC and CA, respectively, writing
xA1 = p * xA + q * xB;
yA1 = p * yA + q * yB;
xB1 = p * xB + q * xC;
yB1 = p * yB + q * yC;
xC1 = p * xC + q * xA;
yC1 = p * yC + q * yA;
We then draw the triangle A′B′C′, which is slightly smaller than ABC and turned a little counter-clockwise. Applying the same principle to triangle A′B′C′ to obtain a third triangle, A″B″C″, and so on, until 50 triangles have been drawn, the result will be as shown in Figure 1.5.

If we change the dimensions of the window, new equilateral triangles appear, again in the center of the canvas and with dimensions proportional to the size of this canvas. Without floating-point logical coordinates and with a y-axis pointing downward, this program would have been less easy to write:
// Triangles.java: This program draws 50 triangles inside each other.
import java.awt.*;
import java.awt.event.*;
public class Triangles extends Frame
{  public static void main(String[] args){new Triangles();}

   Triangles()
   {  super("Triangles: 50 triangles inside each other");
      addWindowListener(new WindowAdapter()
         {public void windowClosing(WindowEvent e){System.exit(0);}});
      setSize (600, 400);
      add("Center", new CvTriangles());
      show();
   }
}

class CvTriangles extends Canvas
{  int maxX, maxY, minMaxXY, xCenter, yCenter;

   void initgr()
   {  Dimension d = getSize();
      maxX = d.width - 1; maxY = d.height - 1;
      minMaxXY = Math.min(maxX, maxY);
      xCenter = maxX/2; yCenter = maxY/2;
   }
   int iX(float x){return Math.round(x);}
   int iY(float y){return maxY - Math.round(y);}

   public void paint(Graphics g)
   {  initgr();
      float side = 0.95F * minMaxXY, sideHalf = 0.5F * side,
         h = sideHalf * (float)Math.sqrt (3),
         xA, yA, xB, yB, xC, yC,
         xA1, yA1, xB1, yB1, xC1, yC1, p, q;
      q = 0.05F;
      p = 1 - q;
      xA = xCenter - sideHalf;
      yA = yCenter - 0.5F * h;
      xB = xCenter + sideHalf;
      yB = yA;
      xC = xCenter;
      yC = yCenter + 0.5F * h;
      for (int i=0; i<50; i++)
      {  g.drawLine(iX(xA), iY(yA), iX(xB), iY(yB));
         g.drawLine(iX(xB), iY(yB), iX(xC), iY(yC));
g.drawLine(iX(xC), iY(yC), iX(xA), iY(yA));
xA1 = p * xA + q * xB;
yA1 = p * yA + q * yB;
xB1 = p * xB + q * xC;
yB1 = p * yB + q * yC;
xC1 = p * xC + q * xA;
yC1 = p * yC + q * yA;
xA = xA1; xB = xB1; xC = xC1;
yA = yA1; yB = yB1; yC = yC1;
}
}
}In the canvas class CvTriangles there is a method initgr. Together with the other program lines that precede the paint method in this class, initgr may also be useful in other programs.
It is important to notice that, on each triangle edge, the computed floating-point coordinates, not the integer device coordinates derived from them, are used for further computations. This principle, which applies to many graphics applications, can be depicted as follows:
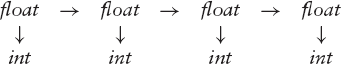
which is in contrast to the following scheme, which we should avoid. Here int device coordinates containing rounding-off rounding-off errors are used not only for graphics output but also for further computations, so that such errors will accumulate:

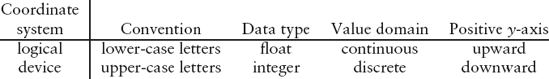
In summary, we compare and contrast the logical and device coordinate systems in the following table, in terms of (1) the convention used in the text, but not in Java programs, of this book; (2) the data types of the programming language; (3) the coordinate value domain; and (4) the direction of the positive y-axis:
Suppose we want to map an interval of real logical coordinates, such as
| 0 ≤ x ≤ 10.0 |
to the set of integer device coordinates {0,1,2,..., 9}. Unfortunately, the method
int iX(float x){return Math.round(x);}used in the previous section is not suitable for this purpose because for any x greater than 9.5 (and not greater than 10) it returns 10, which does not belong to the allowed sequence 0,1,...,9. In particular, it gives
ix (10.0) = 10
while we want
ix (10.0) = 9
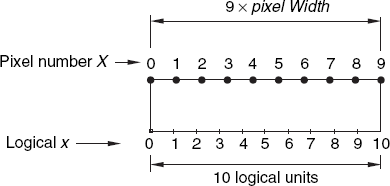
This suggests that in an improved method iX we should use a multiplication factor of 0.9. We can also come to this conclusion by realizing that there are only nine small intervals between ten pixels labeled 0,1,...,9, as Figure 1.6 illustrates. If we define the pixel width (= pixelWidth) as the distance between two successive pixels on a horizontal line, the above interval 0 ≤ x ≤ 10 of logical coordinates (being real numbers) corresponds to 9 × pixelWidth. So in this example we have:
| 9 × pixelWidth = 10.0(the length of the interval of logical coordinates) |
| pixelWidth = 10/9 = 1.111... |
In general, if a horizontal line of our window consists of n pixels, numbered 0,1,..., maxX (where maxX = n – 1), and the corresponding (continuous) interval of logical coordinates is 0 ≤ x ≤ rWidth, we can use the following method:
int iX(float x){return Math.round(x/pixelWidth);}where pixelWidth is computed beforehand as follows:
maxX = n − 1;
pixelWidth = rWidth/maxX;
In the above example the integer n is equal to the interval length rWidth, but it is often desirable to use logical coordinates x and y satisfying
| 0 ≤ x ≤ rWidth |
| 0 ≤ y ≤ rHeight |
where rWidth and rHeight are real numbers, such as 10.0 and 7.5, respectively, which are quite different from the numbers of pixels that lie on horizontal and vertical lines. It will then be important to distinguish between isotropic and anisotropic mapping modes, as we will discuss in a moment.
As for the simpler method
int iX(float x){return Math.round(x);}of the previous section, this can be regarded as a special case of the improved method we have just seen, provided we use pixelWidth = 1, that is rWidth = maxX, or rWidth = n – 1. For example, if the drawing rectangle is 100 pixels wide, so that n = 100 and we can use the pixels 0,1,2,..., 99 = maxX on a horizontal line, this simpler method iX works correctly if it is applied to logical x-coordinates satisfying
| 0 ≤ x ≤ rWidth = 99.0 |
The point to be noticed is that, due to the value pixelWidth = 1, the logical width is 99.0 here although the number of available pixels is 100.
The term anisotropic mapping mode implies that the scale factors for x and y are not necessarily equal, as the following code fragment shows:
Dimension d = getSize();
maxX = d.width - 1; maxY = d.height - 1;
pixelWidth  = rWidth/maxX;
pixelHeight = rHeight/maxY;
...
int iX(float x){return Math.round(x/pixelWidth);}
int iY(float y){return maxY - Math.round(y/pixelHeight);}
float fx(int x){return x * pixelWidth;}
float fy(int y){return (maxY - y) * pixelHeight;}
We will use this in a demonstration program. Regardless of the window dimensions, the largest possible rectangle in this window has the logical dimensions 10.0 × 7.5. After clicking on a point of the canvas, the logical coordinates are shown, as Figure 1.7 illustrates.

Since there are no gaps between this largest possible rectangle and the window edges, we can only see this rectangle with some difficulty in Figure 1.7. In contrast, the screen will show this rectangle very clearly because we will make it red instead of black. Although the window dimensions in Figure 1.7 have been altered by the user, the logical canvas dimensions are still 10.0 × 7.5. The text displayed in the window shows the coordinates of the point near the upper-right corner of the rectangle, as the cross-hair cursor indicates. If the user clicks exactly on that corner, the coordinate values 10.0 and 7.5 are displayed. This demonstration program is listed below.
// Anisotr.java: The anisotropic mapping mode.

import java.awt.*;
import java.awt.event.*;

public class Anisotr extends Frame
{  public static void main(String[] args){new Anisotr();}

   Anisotr()
   { super("Anisotropic mapping mode");
     addWindowListener(new WindowAdapter()
{public void windowClosing(WindowEvent e){System.exit(0);}});
setSize (400, 300);
add("Center", new CvAnisotr());
setCursor(Cursor.getPredefinedCursor(Cursor.CROSSHAIR_CURSOR));
show();
}
}
class CvAnisotr extends Canvas
{ int maxX, maxY;
float pixelWidth, pixelHeight,
rWidth = 10.0F,
rHeight = 7.5F,
xP = −1, yP;
CvAnisotr()
{ addMouseListener(new MouseAdapter()
{ public void mousePressed(MouseEvent evt)
{ xP = fx(evt.getX()); yP = fy(evt.getY());
repaint();
}
});
}
void initgr()
{ Dimension d = getSize();
maxX = d.width - 1; maxY = d.height - 1;
pixelWidth = rWidth/maxX; pixelHeight = rHeight/maxY;
}
int iX(float x){return Math.round(x/pixelWidth);}
int iY(float y){return maxY - Math.round(y/pixelHeight);}
float fx(int x){return x * pixelWidth;}
float fy(int y){return (maxY - y) * pixelHeight;}
public void paint(Graphics g)
{ initgr();
int left = iX (0), right = iX(rWidth),
bottom = iY (0), top = iY(rHeight);
if (xP >= 0) g.drawString(
"Logical coordinates of selected point: "
+ xP + " " + yP, 20, 100);
g.setColor(Color.red);
g.drawLine(left, bottom, right, bottom);g.drawLine(right, bottom, right, top);
g.drawLine(right, top, left, top);
g.drawLine(left, top, left, bottom);
}
}With the anisotropic mapping mode, the actual length of a vertical unit can be different from that of a horizontal unit. This is the case in Figure 1.7: although the rectangle is 10 units wide and 7.5 units high, its real height is less than 0.75 of its width. In particular, the anisotropic mapping mode is not suitable for drawing squares, circles and other shapes that require equal units in the horizontal and vertical directions.
We can arrange for horizontal and vertical units to be equal in terms of their real size by using the same scale factor for x and y. Let us use the term drawing rectangle for the rectangle with dimensions rWidth and rHeight, in which we normally draw graphical output. Since these logical dimensions are constant, so is their ratio, which is not the case with that of the canvas dimensions. It follows that, with the isotropic mapping mode, the drawing rectangle will in general not be identical with the canvas. Depending on the current window size, either the top and bottom or the left and right edges of the drawing rectangle lie on those of the canvas.
Since it is normally desirable for a drawing to appear in the center of the canvas, it is often convenient with the isotropic mapping mode to place the origin of the logical coordinate system at that center. This implies that we will use the following logical-coordinate intervals:
| – 1/2 rWidth ≤ x ≤ + 1/2 rWidth |
| – 1/2 rHeight ≤ y ≤ + 1/2 rHeight |
Our methods iX and iY will map each logical coordinate pair (x, y) to a pair (X, Y) of device coordinates, where
| X ∈ {0, 1, 2,..., maxX} |
| Y ∈ {0, 1, 2,..., maxY} |
To obtain the same scale factor for x and y, we compute rWidth/maxX and rHeight/maxY and take the larger of these two values; this maximum value, pixelSize, is then used in the methods iX and iY, as this fragment shows:
Dimension d = getSize();
int maxX = d.width - 1, maxY = d.height - 1;
pixelSize = Math.max(rWidth/maxX, rHeight/maxY);
centerX = maxX/2; centerY = maxY/2;
...
int iX(float x){return Math.round(centerX + x/pixelSize);}
int iY(float y){return Math.round(centerY - y/pixelSize);}
float fx(int x){return (x - centerX) * pixelSize;}
float fy(int y){return (centerY - y) * pixelSize;}
We will use this code in a program that draws a square, two corners of which touch either the midpoints of the horizontal canvas edges or those of the vertical ones. It also displays the coordinates of a point on which the user clicks, as the left window of Figure 1.8 shows.
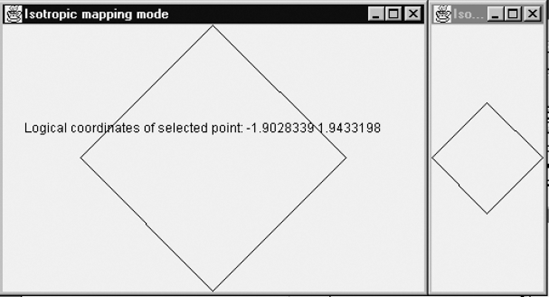
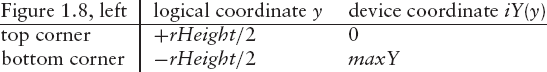
In this illustration, we pay special attention to the corners of the drawn square that touch the boundaries of the drawing rectangle. These corners do not lie on the window frame, but they lie just inside it. For the square on the left we have:
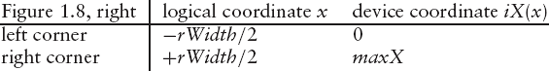
By contrast, for the square that has been drawn in the narrow window on the right, it is the corners on the left and the right that lie just within the frame:
The following program uses a drawing rectangle with logical dimensions rWidth = rHeight = 10.0. If we replaced this value 10.0 with any other positive constant, the output would be the same.
// Isotrop.java: The isotropic mapping mode.
//    Origin of logical coordinate system in canvas
//    center; positive y-axis upward.
//    Square (turned 45 degrees) just fits into canvas.
//    Mouse click displays logical coordinates of
//    selected point.
import java.awt.*;
import java.awt.event.*;

public class Isotrop extends Frame
{  public static void main(String[] args){new Isotrop();}

   Isotrop()
   { super("Isotropic mapping mode");
     addWindowListener(new WindowAdapter()
        {public void windowClosing(WindowEvent e){System.exit(0);}});
     setSize (400, 300);
     add("Center", new CvIsotrop());
     setCursor(Cursor.getPredefinedCursor(Cursor.CROSSHAIR_CURSOR));
     show();
   }
}

class CvIsotrop extends Canvas
{  int centerX, centerY;
  float pixelSize, rWidth = 10.0F, rHeight = 10.0F, xP = 1000000, yP;

   CvIsotrop()
   { addMouseListener(new MouseAdapter()
     {  public void mousePressed(MouseEvent evt)
        {  xP = fx(evt.getX()); yP = fy(evt.getY());
           repaint();
        }
     });
   }

   void initgr()
   {  Dimension d = getSize();
      int maxX = d.width - 1, maxY = d.height - 1;
pixelSize = Math.max(rWidth/maxX, rHeight/maxY);
centerX = maxX/2; centerY = maxY/2;
}
int iX(float x){return Math.round(centerX + x/pixelSize);}
int iY(float y){return Math.round(centerY - y/pixelSize);}
float fx(int x){return (x - centerX) * pixelSize;}
float fy(int y){return (centerY - y) * pixelSize;}
public void paint(Graphics g)
{ initgr();
int left = iX(-rWidth/2), right = iX(rWidth/2),
bottom = iY(-rHeight/2), top = iY(rHeight/2),
xMiddle = iX (0), yMiddle = iY (0);
g.drawLine(xMiddle, bottom, right, yMiddle);
g.drawLine(right,yMiddle, xMiddle, top);
g.drawLine(xMiddle, top, left, yMiddle);
g.drawLine(left, yMiddle, xMiddle, bottom);
if (xP != 1000000)
g.drawString(
"Logical coordinates of selected point: "
+ xP + " " + yP, 20, 100);
}
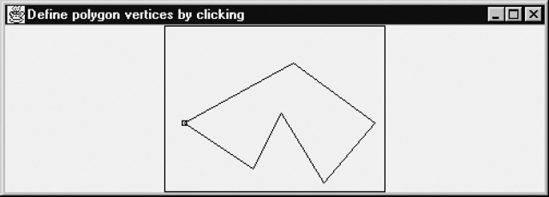
}We will use the conversion methods of the previous program in a more interesting application, which enables the user to define a polygon by clicking on points to indicate the positions of the vertices. Figure 1.9 shows such a polygon, just after the user has defined successive vertices, ending at the first one on the left, which is marked with a tiny rectangle.
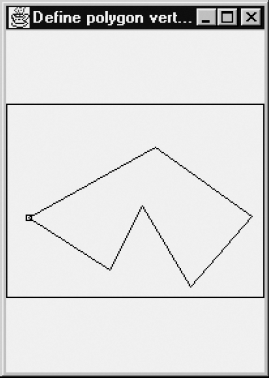
The large rectangle surrounding the polygon is the drawing rectangle: only vertices inside this rectangle are guaranteed to appear again if the user changes the dimensions of the window. The very wide window of Figure 1.9 was obtained by dragging one of its corners. After the polygon was drawn, the dimensions of the window were again changed, to obtain Figure 1.10. It is also possible to change these dimensions during the process of drawing the polygon. We now summarize the requirements for this application program:
The first vertex is drawn as a tiny rectangle.
If a later vertex is inside the tiny rectangle, the drawing of one polygon is complete.
Only vertices in the drawing rectangle are drawn.
The drawing rectangle (see Figures 1.9 and 1.10) is either as high or as wide as the window, yet maintaining its height/width ratio regardless of the window shape.
When the user changes the shape of the window, the size of the drawn polygon changes in the same way as that of the drawing rectangle, as does the surrounding white space of the polygon.
We will use the isotropic mapping mode to implement this program, and use a data structure called vertex vector to store the vertices of the polygon to be drawn. We then design the program with the following algorithmic steps:
Activate the mouse;
When the left mouse button is pressed
2.1 Get x- and y-coordinates at where the mouse is clicked;
2.2 If it is the first vertex
Then empty vertex vector;
Else If the vertex is inside the tiny rectangle (i.e. last vertex)
Then finish the current polygon;
Else store this vertex in vertex vector (i.e. not last vertex);
Draw all vertices in vertex vector.
The last step to draw all the polygon vertices can be detailed as follows:
Obtain the dimensions of the drawing rectangle based on logical coordinates;
Draw the drawing rectangle;
Get the first vertex from vertex vector;
Draw a tiny rectangle at the vertex location;
Draw a line between every two consecutive vertices stored in vertex vector.
In both Figures 1.9 and 1.10 the drawing rectangle has a width of 10 and a height of 7.5 logical units, as the following program shows:
// DefPoly.java: Drawing a polygon.
// Uses: CvDefPoly (discussed below).
import java.awt.*;
import java.awt.event.*;

public class DefPoly extends Frame
{  public static void main(String[] args){new DefPoly();}

   DefPoly()
   {  super("Define polygon vertices by clicking");
      addWindowListener(new WindowAdapter()
         {public void windowClosing(WindowEvent e){System.exit(0);}});
      setSize (500, 300);
      add("Center", new CvDefPoly());
      setCursor(Cursor.getPredefinedCursor(Cursor.CROSSHAIR_CURSOR));
      show();
   }
}
The class CvDefPoly, used in this program, is listed below. We define this class in a separate file, CvDefPoly.java, so that it is easier to use elsewhere, as we will see in Section 2.13:
// CvDefPoly.java: To be used in other program files.
//   A class that enables the user to define
//   a polygon by clicking the mouse.
// Uses: Point2D (discussed below).

import java.awt.*;
import java.awt.event.*;
import java.util.*;

class CvDefPoly extends Canvas
{  Vector v = new Vector();
   float x0, y0, rWidth = 10.0F, rHeight = 7.5F, pixelSize;
   boolean ready = true;
   int centerX, centerY;

   CvDefPoly()
   { addMouseListener(new MouseAdapter()
     {  public void mousePressed(MouseEvent evt)
        {  float xA = fx(evt.getX()), yA = fy(evt.getY());
           if (ready)
           {  v.removeAllElements();
              x0 = xA; y0 = yA;
              ready = false;
           }
           float dx = xA - x0, dy = yA - y0;
           if (v.size() > 0 &&
              dx * dx + dy * dy ≤ 4 * pixelSize * pixelSize)
              ready = true;
           else
              v.addElement(new Point2D(xA, yA));
           repaint();
        }
     });
   }

   void initgr()
   {  Dimension d = getSize();
      int maxX = d.width - 1, maxY = d.height - 1;
      pixelSize = Math.max(rWidth/maxX, rHeight/maxY);
centerX = maxX/2; centerY = maxY/2;
}
int iX(float x){return Math.round(centerX + x/pixelSize);}
int iY(float y){return Math.round(centerY - y/pixelSize);}
float fx(int x){return (x - centerX) * pixelSize;}
float fy(int y){return (centerY - y) * pixelSize;}
public void paint(Graphics g)
{ initgr();
int left = iX(-rWidth/2), right = iX(rWidth/2),
bottom = iY(-rHeight/2), top = iY(rHeight/2);
g.drawRect(left, top, right - left, bottom - top);
int n = v.size();
if (n == 0) return;
Point2D a = (Point2D)(v.elementAt (0) );
// Show tiny rectangle around first vertex:
g.drawRect(iX(a.x)−2, iY(a.y)−2, 4, 4);
for (int i=1; i<=n; i++)
{ if (i == n && !ready) break;
Point2D b = (Point2D)(v.elementAt(i \% n));
g.drawLine(iX(a.x), iY(a.y), iX(b.x), iY(b.y));
a = b;
}
}
}The class Point2D, used in the above file, will also be useful in other programs, so that we define this in another separate file, Point2D.java:
// Point2D.java: Class for points in logical coordinates.
class Point2D
{ float x, y;
  Point2D(float x, float y){this.x = x; this.y = y;}
}
After a complete polygon has been shown (which is the case when the user has revisited the first vertex), the user can once again click a point. The polygon then disappears and that point will then be the first vertex of a new polygon.
Note that the comment line
// Uses: CvDefPoly (discussed below).
occurring in the file DefPoly.java, indicates that the file CvDefPoly.java should be available in the current directory. Since the comment line
// Uses: Point2D (discussed below).
occurs in the file CvDefPoly.java, the program DefPoly.java also requires the class Point2D. Comments such as those above are very helpful if different directories are used, for example, one for each chapter. However, since class names are unique throughout this book, it is possible to place all program files in the same directory. In this way, each required class will be available.
EXERCISES
1.1 How many pixels are put on the screen by each of the following calls?
g.drawLine (10, 20, 100, 50);
g.drawRect (10, 10, 8, 5);
g.fillRect (10, 10, 8, 5);
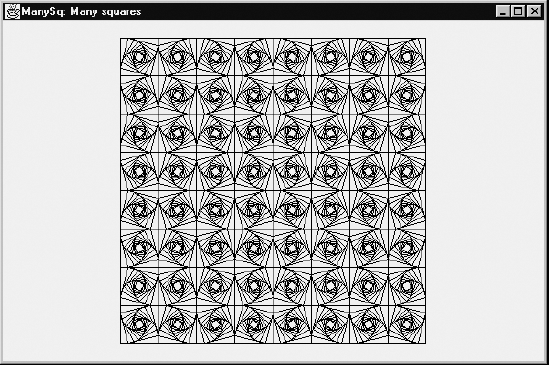
1.2 Replace the triangles of program Triangles.java with squares and draw a great many of them, arranged in a chessboard, as shown in Figure 1.11.
As usual, this chessboard consists of n × n normal squares (with horizontal} and vertical edges), where n = 8. Each of these actually consists of k squares of different sizes, with k = 10. Finally, the value q = 0.2 (and p = 1 – q = 0.8) was used to divide each edge into two parts with ratio p : q (see also program Triangles.java in Section 1.3), but the interesting pattern of Figure 1.11 was obtained by reversing the roles of p and q in half of the n × n 'normal' squares, which is similar to the black and white squares of a normal chessboard. Your program should accept the values n, k and q as program arguments.
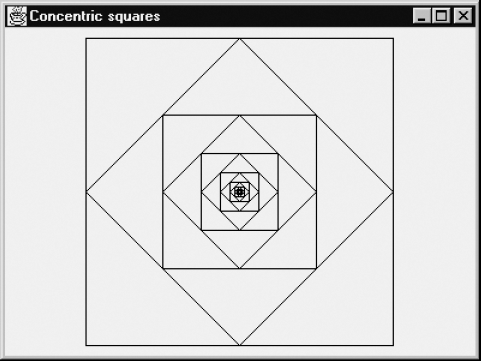
1.3 Draw a set of concentric pairs of squares, each consisting of a square with horizontal and vertical edges and one rotated through 45°. Except for the outermost square, the vertices of each square are the midpoints of the edges of its immediately surrounding square, as Figure 1.12 shows. It is required that all lines are exactly straight, and that vertices of smaller squares lie exactly on the edges of larger ones.
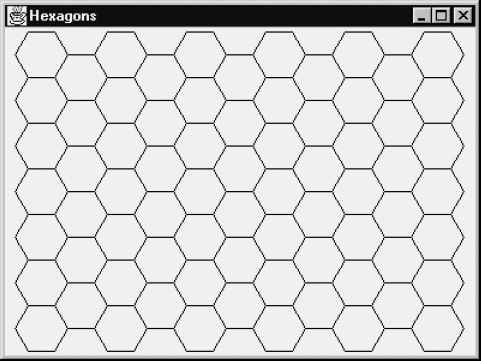
1.4 Write a program that draws a pattern of hexagons, as shown in Figure 1.13. The vertices of a (regular) hexagon lie on its so-called circumscribed circle. The user must be able to specify the radius of this circle by clicking a point near the upper-left corner of the drawing rectangle. Then the distance between that point and that corner is to be used as the radius of the circle just mentioned. There must be as many hexagons of the specified size as possible and the margins on the left and the right must be equal. The same applies to the upper and lower margins, as Figure 1.13 shows.
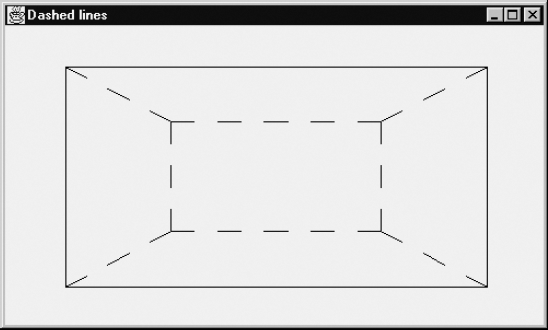
1.5 Write a class Lines containing a static method dashedLine to draw dashed lines, in such a way that we can write
Lines.dashedLine(g, xA, yA, xB, yB, dashLength);
where g is a variable of type Graphics, xA, yA, xB, yB are the device coordinates of the endpoints A and B, and dashLength is the desired length (in device coordinates) of a single dash. There should be a dash, not a gap, at each endpoint of a dashed line. Figure 1.14 shows eight dashed lines drawn in this way, with dashLength = 20.