
Chapter 4
The Information Domain
Intuition is useful in business. But...it isn’t enough.
The Wall Street Journal, October 23, 2007
From the first discussions of enterprise architecture, information management has been the lynchpin of every major strategy to gain control over the increasing complexity of managing IT functionality. Spewak and NIST, TOGAF and Zachman, all began with the management of information.
I use the term information, not data. Originally, the terms were interchangeable, but two factors are changing that:
- First, as the discipline matures, we’ve realized that there’s a great deal of difference between simple, raw data like transaction amounts, and complex, derived data liked predictive analytic outcomes. To call them all data would miss important nuances that are critical to understand in order to manage all types of information successfully. See page 99 for more details.
- Furthermore, another group of professionals who specialize in the visualization of data on screen or page has taken to calling themselves data architects, creating LinkedIn groups and conferences under that name. That’s a very useful specialty, but things get confusing when both trades take the same name.
To avoid any ambiguity, the practice today is to use the term information to describe the full range of business data, from simple to complex, both at rest in physical repositories or in flight using batch files and web services. We refer to this area of IT as the information domain. Information management refers to the architecture and governance processes we use to administrate this domain. The people who set up these management structures are information architects. We try to only use the term “data” when discussing the simplest type of information: raw data created and maintained by operational processes in order to provide core business functionality.
In this book, you’ll find a great deal more discussion of the information domain than of the application or technology domains. There’s a reason for this. As I said in the introduction, I’m not trying to teach anyone how to perform any of the functions in any of the domains. I have to assume you know, or have people who know how to perform these functions: how to model data, how to develop software, how to upgrade hardware, and so forth. The purpose of this book is to tell you how to coordinate all those different efforts into an EAG program that checks two key boxes:
- Spans all the information systems you support (i.e. how to model data at the enterprise level, rather than project by project)
- Integrates with all the other functions (i.e. how your data modeling function needs to integrate with your data security function and application development function)
In the discussion that follows, we aren’t going to try to teach you how to perform the basic functions; there are already whole books dedicated to each with far more information and expertise than I can provide. Instead, we are going to focus on the aspects of each IT function that need special attention when you take those efforts from isolated silos of expertise and make them instead components of an enterprise architecture and governance (EAG) functional framework that spans all functions and all information systems in the enterprise.
In that context, I have more to say about the management of information than about applications or technology. Although the entire focus of computer technology in business is to improve the efficiency of managing information, most companies have been focusing on the hardware and software, not the information that the hardware and software was supposed to be supporting.
The information domain is the weakest link in corporate IT today. Many companies have great EAG programs in place to manage hardware and software, but still practically ignore information management as a discipline.
This is why I feel driven to speak at such length in the pages ahead about the information domain; because most of us are doing a poor job of it. There are far more gaps to address in the information domain than the other two domains put together.
Information architecture in an EAG program
In the context of enterprise architecture and governance (EAG), information architecture suffers from a bit of an identity problem.
Unfortunately, information architecture is still often treated as an IT-centric initiative. When you focus on data for data’s sake, you’re missing the bigger picture. Information is only as valuable as the business processes and decisions it improves. The ultimate goal of an information management program is to generate the greatest return from corporate information assets.
In an EAG program, the information architecture should be second only to business architecture. Once the business has identified a problem or goal, the first questions shouldn’t be about the hardware the solution will sit on. Your first questions should target the information required by the business. These could include:
- How should the data be represented in the enterprise logical data model (entities, attributes, data type and length, relationships, and constraints)?
- What’s the data volume?
- What’s the system of record for this data?
- Is any of the data sensitive?
Only after you understand the information needs should you consider the application requirements needed to collect, maintain, and deliver the information and the technology needed to support those application requirements.
As late as the 1990’s, very few companies formally recognized information as an independent domain equal to the application and technology domains. The application domain rolled up to the CIO, and the technology domain rolled up to the CTO. However, the information domain, if it existed at all, was usually subservient to one of those two in the org structure. In some cases, the developers in the application domain might perform their own information architecture functions within the scope of the project they’re working on, or might employ a dedicated project-level data modeler. In other cases, the DBAs in the technology domain might serve as data modelers. However, in all these cases, information management was a project-level tactical function, not an enterprise-level strategic one.
I once worked for a large company that developed banking software. One of the products I was responsible for was a Customer Relationship Management (CRM) system that was the golden copy of the customer name and address information across all our product lines. When developing features for this product, each project followed the same flow:
- The business would give us requirements for new functionality.
- The data modelers would model the required data through several layers of abstraction, eventually producing an updated physical model. This physical model was instantiated as both DDL to create tables, and XML to give to the application developers.
- The first team of application developers would create simple data maintenance CRUD (Create, Read, Update, and Delete) services. These simple data access and maintenance services are commonly and collectively known as Data as a Service, or DaaS.
- Then a second team of developers would develop front-end applications which orchestrated those DaaS services together into complex business process services (Software as a Service, or SaaS).
- A third team would then expose the functionality to our users through a web-based user interface.
- Technology architects would address issues with the Enterprise Service Bus (ESB), network access, firewalls, server capacity, and the like.
In this example, the business gives the initial direction, but, true to Spewak’s vision, everything else is driven by information.
Even today, this isn’t often the way things work at most companies. I think the reason for this has to do with how companies were organized and how they functioned before the advent of EAG. Data had been around for thousands of years and was considered just part of the business. However, when computers came on the scene, we suddenly needed specialized roles to manage all the new hardware and software that came with them. Suddenly all the interest was focused on the shiny new computers, not the information those computers existed to support.
I liken this to someone who buys an expensive sports car, then keeps it locked up in a garage where they can admire it, enhance it with more powerful parts and keep it polished. The purpose of a car isn’t to sit in the garage; a car exists to take you places you want to go. The business doesn’t exist so that IT can assemble the latest technology; the technology is assembled to manage the information assets of the business. Without information, hardware and software have no purpose.
Unfortunately, for most IT organizations, the Information Age isn’t about information. From the beginning, the IT department was supposed to be all about the information, never the computer. The term Information Technology (IT) described the original intent that all this technology existed to support information.
Until recently, the process flow at most companies was that a business request would be routed straight to an application developer with no real guidance regarding enterprise information standards and interoperability. The developer pretty much had free rein to implement the information in any way they thought best. Many of these developers were talented, intelligent people who wanted to write the best code they could for their company, but they were hampered by:
- Lack of experience with information management disciplines
- Lack of an articulated enterprise vision for information
- Lack of guidelines regarding how to best manage information
- Lack of communication with developers from other teams across the enterprise
- Lack of time and money to spend worrying about the bigger picture
As such, any consideration of information architecture was left to the hardware and software professionals. Information Management seldom rose above project-level planning and scope. A data modeler (if they existed at all) reported to the project developer and implemented the project team’s decisions.
Although most companies followed established best practices and defined information architecture as a separate domain of EAG from the very beginning, many remain under the assumption that information architecture is a sub-function of the application or technology domains. They did not create an organization structure with a separate domain for information. This has been changing since 2000, slowly at first, but accelerating each year as companies realize that the central purpose of information management had somehow been lost. Somehow, IT had become all about the hardware and software.
Consider this. Every organization, regardless of size or industry, has a finance function. There’s some person in the organization whose responsibility includes protecting and optimizing the value of the organization’s financial assets. This person is usually the CFO, a direct report to the CEO, and often sits on the board of directors. Likewise, every organization has a similar role that is responsible for technology assets, the CTO. While the financial assets do rely on supporting and enabling technology, the financial assets aren’t a technology domain responsibility. In the same manner, the human assets of a company rely on the technology infrastructure, but HR isn’t a technology domain responsibility.
The growing recognition of the importance of information assets has led to the establishment of a dedicated C-level executive role to manage information assets, the Chief Data Officer (CDO). The CDO manages the information assets. The Chief Analytics Officer (or CAO) manages the things that are done to those information assets to provide insight and make decisions. It took thirty years, but the work of NIST and Spewak is finally beginning to bear fruit in the boardroom.
Why now? I believe that the progress we have seen in the steady rise of the influence of the information domain within enterprise-level IT management is due to more than thirty-year-old books and theories. Whether or not they’ve acted on the knowledge, most companies have recognized the need for enterprise architecture and governance for at least two decades now. But only in the last five years has mainstream IT culture suddenly become interested in information architecture. What’s going on?
I believe the answer lies in looking at how corporate competition has evolved over time.
Information as a competitive differentiator
I believe businesses today are feeling more pressure than ever before to manage their information assets strategically to create a competitive advantage. I see this as the inevitable evolution in the nature of competition in the information age. I have a theory. I believe that every industry follows a standard evolutionary path.
Phase 1 - competing on infrastructure
In the early stages of any industry, companies compete by building out infrastructure. During this phase, financial institutions are rushing to build branch banks on every street corner, car manufacturers are building car lots and showrooms, and telecoms are buying up the rights to put up cell towers. During this phase, you aren’t so much competing against other companies as you are staking your claims on the unwashed masses.
I imagine this phase of competition as a reenactment of the great land rush in Oklahoma. On April 22 of 1889, an estimated 50,000 people waited at a starting line for the noon gun that would release them to rush out and claim up to 160 acres of some of the most valuable land in the United States. Regardless of how you feel about the morality of the Indian Appropriations Act parceling out this “unoccupied” land, this vivid image of a rush to stake a claim is a perfect picture of the earliest phase of competition in every developing industry.
If you have a young niece or nephew just beginning to pursue a degree in computer science who comes to you for advice, this is when you would advise them to focus their studies on technology and infrastructure. “Learn as much as you can about security, LAN/WAN and NAS/SAN.” “Get your Cisco certification and buy a wheelbarrow to take all your money to the bank.” You want to work in the technology domain.
Technological advances can still return a company to this phase of competition overnight. When 4G cellular service technology became widely available and the Feds opened up bidding on the new frequencies, telco carriers suddenly found themselves in another land rush to stake out their claims to 4G tower locations across the country.

Phase 2 - competing on feature/function
At some point, though, the infrastructure rollout saturates the marketplace. There’s a branch bank and car lot on every corner and no more cell tower licenses are available for purchase. No unclaimed customers remain, so you have to figure out how to steal customers from your competitors while protecting your own customer base. At this point, companies begin to compete on feature/function and it becomes an application development arms race. At one time, the only way to access your bank account was to drive to a branch during business hours, park, get out of your car, and walk in to talk to a teller. Then one bank began offering drive through windows where customers didn’t have to get out of their cars. All the customers would leave the bank across the street and rush over to take advantage of this cutting edge feature. Remember those amazing pneumatic chutes? The bank they left would not only have to even the playing field by getting drive through windows, but they would then have to one-up the other bank by rolling out ATMs. And so on. ATMs, telebanking, internet banking – each bank would have to bring out some attractive new feature function in order to up the ante and regain the competitive advantage.
This is the point where you tell your niece or nephew to get into application development. “Learn C++.” “Learn HTML.” “Learn Java and you can name your price.” Companies are always willing to invest their money in the people who are most critical to the work that will make the company competitive. Steer them toward the application domain.
At this point in the competitive landscape, the infrastructure just gets you in the game. You have to have it, but it isn’t a competitive differentiator. No matter what your industry is, you need to ante into the game with technology before you can increase the bid with feature/function. At some point, the technology playing field is level, and you must turn to feature/function to remain competitive.
As with technology, there are times when new functionality becomes available and disrupts the industry. Companies who thought they were past all this suddenly find themselves competing over feature/function again. Blockchain, for example, is a disruptive game changer. Once the functionality overcomes the performance and scale issues facing that technology today, companies in every industry will find themselves fighting to roll out blockchain-enabled features that will differentiate them from their competition.
However, you can’t depend forever on your ability to keep coming up with the next killer app. At some point, the feature/function landscape becomes a level playing field. My little community bank has a great internet banking site. How do you remain competitive? Do you desperately throw your corporate investment into finding the next killer app? Or do you change tactics once again?
Phase 3 - competing on information
Eventually, in every industry, the focus shifts again and companies begin to compete on information. It’s not enough to know your product; you have to know your customer:
- You must know more about your customers and prospects than your competitors and you must know it faster.
- You must be able to apply that knowledge to generate business decisions.
- You must offer individualized products and services that appeal to your target market while maximizing your profit.
- You move from one-size-fits-all to products and services customized for a customer segment of one.
This is the point when you would encourage your niece or nephew to learn data modeling, or learn statistical analysis. “Whatever you do, do it in the information domain because the future is in information, not application or technology.” Forbes consistently lists data scientist salaries well above the highest developer salaries15 and Harvard Business Review recently named “data scientist” the sexiest job of the twenty-first century.16
Companies are outsourcing more and more these days. Hardware and software infrastructure are quickly becoming cloud-based virtual commodities. Application development is being outsourced to offshore contractors who do great work for a quarter of what you’ll have to pay locally. In any stage of competition, businesses are going to try to hang on to those skills that they perceive as enabling their competitive differentiators. If a company believes that the key to their success is their ability to cleanse, integrate, and mine information, then that’s where they’re going to be offering the most competitive salaries in an attempt to attract and retain the best people.
When I was working in the telecommunications industry, I thought it was very interesting to compare the advertising strategies of the big carriers:
- Verizon focused their advertising on technology. Consider their advertising message, “Can you hear me now?” They very intentionally focused on telling the public that Verizon had the best network infrastructure. They were competing on technology and infrastructure. A phone was a piece of hardware.
- Sprint and AT&T had advertising that seemed to focus on feature/function. You could watch the game, manage your stock portfolio, and listen to music all on one device. They were competing on applications. A phone was an application platform.
- Alltel’s campaign focused on customer-centricity and flexibility. Rollover minutes, discounted rates on calls to your friends and family, and no fees for early termination. Their tagline – “Come and get your love” – was intended to communicate that they will treat you like a person, not a number. A phone was a social connection. If I traveled to the other side of the country, I would see exactly the same Verizon commercial that aired back home, but the Alltel commercials would be completely customized for the local region. Alltel was competing with information.
Today, information is the key to competition. You must have a strong information architecture team and you must build an information-centric IT infrastructure to ante up. Companies that don’t have strong information management programs are steadily losing ground in the market, wondering why everyone else seems to be playing a different game.
Phase 4 – What’s next?
I don’t know what the next phase of competition will look like. The future will certainly bring more disruptive technological advances like the coming flood of internet connected devices or quantum computing, and there will be application breakthroughs like blockchain that create new opportunities for companies to differentiate themselves and grow their customer base. Those aren’t new phases of competition so much as brief returns to a previous phase until the playing field is level once more.

If technology infrastructure were required before we could begin competing on application feature/function, and applications were required before we could begin competing on information, then it would seem that the next phase of game-changing corporate competition would be built on top of well-managed information. Personally, I have my eyes on artificial intelligence and machine learning. I think they’re much more than a new application. They’re a completely new kind of competitive advantage.
However, like all the previous phases of competition, each new phase will require a solid mastery of what’s come before. Whatever comes next, you won’t be able to jump on board until you first master competing on information. I can’t predict the future, but I can predict that it’s going to require rock-solid information management.
Recommended Reading:
Competing on Analytics: The New Science of Winning, by Thomas H. Davenport and Jeanne G. Harris, 2007, Harvard Business School Publishing.
Two kinds of people – knowledge sharers versus knowledge hoarders
There are two kinds of people in this world: those who think knowledge is more valuable when shared, and those who think knowledge is more valuable when withheld.
We’ve all seen people who are undisputed experts at what they do, yet still become a serious bottleneck in your organization because they can’t seem to pass their knowledge and experience on to others. They insist that it will be faster for them to do the task themselves than to take the time to teach someone else, especially when the less experienced person will inevitably make mistakes which the more experienced person will then have to spend even more time correcting.
Architects don’t spring forth fully formed from the forehead of God. Every architect started in another role. This is a good thing – you don’t want someone in an architect role who has no real-world experience and expertise. Architects should always be prepared to share their knowledge and experience. The primary responsibility of an architect is creating and communicating a shared vision. It’s a teaching position as much as anything else.
It’s quite common for a developer to do a great job applying their expertise, but be very poor at sharing it. In a developer position, it would certainly be better if your senior resources mentored others, but they can provide value to the company even if they have zero communication skills. But an architect that can’t mentor others isn’t an architect at all – just someone who wants the power and pay grade but isn’t willing or able to do the job.
Some people seem to have more difficulty letting go of control than others. In the end, it may come down to an issue of trust. Do you trust the people who are supposed to do that job to get it done without your help? They may struggle with it and cause you additional work for a while, but eventually they’ll catch on. This is better for everyone. Not only is there more bandwidth and backup for critical functions, but the day-to-day stuff can be handled by the people who are actually being paid to do that job, allowing the architect to focus on the tasks they are being paid to focus on.
For myself, I’m far too easily bored to keep all that knowledge close to the vest. If I don’t make it easy for someone else to do this job, then I’ll be stuck with it forever, and I’ll never get to do the exciting new stuff.
Trends
Before we begin discussing how to manage the business’ information at the enterprise level, it’s important to understand a couple of trends that are shaping how we manage that information.
The coupling of operational and analytical
The functions that comprise the lifecycle of information are, at a high level, the same for both operational systems which process data in many small transactions (Online Transaction Processing, or OLTP) and for analytical data marts and data warehouses that process many rows at a time in a few large batches (Online Analytical Processing, or OLAP). While operational systems are responsible for the day-to-day operations of the business, they are, in the end, little more than data maintenance applications, adding, updating, and deleting records. The resulting data produced by these systems is the raw, unrefined source material for analytical systems.
That sounds as if I’m saying that the operational systems are trivial to develop, and the true work is happening in the analytical systems like the data marts and the data warehouse. In the information domain, there’s some truth to this. Other than the initial data modeling, the bulk of the complexity of developing an operational system lies in the business logic, which is the responsibility of the application domain. Honestly, very few systems have ever been purely operational or analytical. Most of our core operational systems have always had some form of reporting and analytics. In fact, there has been a little-discussed trend in the last fifteen years to break down the barriers between operational and analytical. We’re blurring lines.
Back in the day, there were recognized best practices in place to keep operational systems separate from analytical systems. The operational system was the business. It was dedicated to transactional performance and availability. Analytical systems were seen as just the opposite: poorly performing resource hogs not critical to business operations. All analytical functions were deliberately separated from operational functions so that they didn’t impact the critical business systems. Analytical systems were typically lower tier environments, often without redundancy and failover, with large scheduled maintenance windows when the analytical systems were completely unavailable. The performance expectations were quite low, and the system itself wasn’t considered mission critical. Often analytical systems weren’t even part of the disaster recovery plan because, in the days before competing on information, the business could get along quite easily without analytical platforms until things got back to normal. Because of these factors, you didn’t want your analytical processes to be in the middle of an operational process flow. Operational processes could feed data into an analytical process, but you didn’t want an operational process depending on the output of an analytical process.
But over the years, as companies have had to rely more and more on analytically derived information to compete, the analytical systems have become much more closely coupled with the operational. We no longer deem it poor practice to intertwine the two in the same process flow, provided both are designed with acceptable performance, availability, and latency.
One example of the power of this trend is in making real-time decisions. At the telecom company where I worked as an EA architect, we were investigating the potential of combining operational and analytical information into a real-time offer generation solution. Our enterprise architecture team looked at several commercial products and made a recommendation to the business executives. The solution, with hardware, software, and the development necessary to integrate it into our environment was going to cost upwards of three million dollars. We made a compelling case for the business investment, but before signing the check, the executives wanted us to put together a proof of concept (POC).
At the time, if one of our customers called our automated support line and chose all the correct menu options to navigate to the “I hate your company and want to drop my contract” selection, they got routed to a call center in San Antonio, Texas. In that call center, every time the phone rang it was someone who was in a very bad mood and hated our company. The call center had a very high turnover and none of the operators lasted long enough to be trusted to make decisions about granting bill credits or discounts on a new phone. At best, they could put the customer on hold while they went and asked their supervisor to investigate. At that time, the call center was able to save about 1000 calls per month. “Save” in this context meant that the customer hung up without dropping their service. They might call back tomorrow, but in this call, they were saved.
To demonstrate the power of real-time decisions, we spun up a little project where one Java developer wrote some code in about two weeks to combine analytically derived information like profitability, customer segment, and risk score with real-time information entered by the operator to auto-generate a pre-approved decision. If the customer was calling about a problem with their phone, they’ve been a profitable customer for ten years, and are only two months away from the contract renewal date when we would have given them a brand new phone for renewing their contract, then just give them a new phone! Tell them to go down to the store and pick one out, on you. If they weren’t a profitable customer, then thank them for their business and give them the phone number of our competition.
We defined about five different decision rules for things like billing issues, network problems, and competitor offers. We figured that almost all of these people were going to leave the company anyway, so there was very little risk to implementing the solution. With a development investment of only 80 hours, the POC cost the business very little.
Two months after implementing the POC, the number of saves had increased from 1000 to 11,000 customers a month, almost all of which were permanent saves. This little two-week POC was saving 10,000 additional customers per month! At that time, the way the telecom industry worked was that if a customer signed a two-year contract, the company would subsidize about $300 of the cost of a new phone. The company would go in the hole $300 in order to bring a new customer on board, on the premise that they’ll remain a customer long enough to eventually break even and become profitable. There are lots of subtle costs for replacing lost customers, but at the very least, it was going to cost that $300. So saving 10,000 customers a month translated to an easily demonstrated reduction in $3 million dollars in expenses – every month! All for a POC developed by one developer in two weeks. This is the power of combining operational and analytical information. This is competing on information.
We got the funding. Nevertheless, they never did let us take down that little POC. It became a permanent application, with many enhancements over the years.
In the discussion of information lifecycle functions later in this book, we’re going to combine the discussion of operational and analytical functions. For the information lifecycle, the functions you perform on analytical data are a superset of functions you perform on operational data, so the discussion may appear a little analytics-heavy. Get used to it. If you haven’t realized it yet, go back and read about the three phases of competition again (page 91). The entire IT industry is racing to compete on information. Knowledge is power, my friend!
Data monetization
Data monetization has been gaining more and more attention in recent years, changing the way we think about and manage information assets. InformationWeek (January 2016) claims that, for many companies, data is their single most valuable asset.17 If so, then how much is data worth? If data is a corporate asset, does it belong on the financial statement alongside hardware assets and cash reserves?
There’s no doubt that information has monetary value. Companies buy and sell information every day. There are very successful companies whose entire business model is based on buying and selling information.
Unfortunately, Generally Accepted Accounting Principles (GAAP) doesn’t currently specify how to measure the value of information as a corporate asset. However, while there’s no standard, there’s also no specific ruling against the practice, and many companies are already listing information as an asset on their corporate balance sheets.
If we treated data as a corporate asset in the same sense as financial assets, the business would be much more concerned with where data assets were located and who was using them for what purposes. How are we investing in those assets to improve their value? How are we leveraging those assets to increase revenue, reduce expenses, and grow the company? Data monetization is changing the way we think about information assets and how we manage information-related IT functions.
The companies that are changing the way we do business are the ones who are thinking about data differently, such as Google, Amazon, and Facebook. It isn’t a matter of collecting data for data’s sake. It’s a matter of understanding the problems facing the business, and knowing how to use information to solve those problems. Information only has value to the degree that it impacts your company. If it isn’t being used by the business, information has no actual value.
In the context of this book, in order to efficiently and effectively manage the complexity of IT functionality on behalf of the business, it’s important that you realize that the business’ data is a valuable asset that IT is helping to manage. The functional framework will help us to not forget the information lifecycle functions in the press of other demands.
Unfortunately, for most organizations, making information a true corporate asset is a major cultural shift. But that shift is coming whether you’re ready for it or not. An IT organization that is truly serving its business will help, not hinder this transformational shift.
Information lifecycle functions
In the last couple of decades, most companies have realized the strategic importance of being able to use their data competitively and are trying to put together an information management program for the enterprise. Frankly, companies who haven’t realized the importance of their information aren’t surviving. Information management “is the gas powering the operating model’s engine, enabling organizations to more effectively communicate and reach their specific goals.”18
The information domain of the functional framework addresses the infrastructure necessary to compete on information, breaking down the complexities of managing information into a series of simple functions.
At the detail level, there’s no one functional framework that can be dropped in to every corporation’s information management program. Different organizations will have different drivers for data security, accuracy, latency, and for how information is delivered. They’ll have different requirements for data volume and performance. Different organization will begin their journey with the components of their functional framework at different levels of maturity. In most cases, the real world includes accommodating a legacy infrastructure that will impact one or more components of the functional framework for years to come.
Throughout the remainder of this book, in the discussion of all three IT domains, I am not attempting to replace or even summarize the many very fine resources available on each separate IT function. Instead, we’ll discuss these functions from the standpoint of how they must be coordinated and configured in order to fit into the overall vision of a company’s IT management program. We have to assume you already know how to perform these functions. This book will focus on the higher-level task of integrating these practices with other functions in a larger picture that spans functions and spans departments across your organization in a coordinated enterprise strategy for managing IT complexity, as dictated by your functional framework. Knowing how to perform a function within the scope of one information system is one thing. It’s another thing to manage that function across information systems, and integrate that function into other functions. The rest of this book will focus on these latter challenges.
In one sense, the central purpose of this book has already been achieved – the introduction of the functional framework. The rest of this book is really just my attempt to highlight some of the areas where I think IT is struggling today, and illustrate by example how the functional framework helps clarify and organize the thought process, simplifying the process of controlling the chaos that is IT.
So, let’s talk about the information domain of the framework. First, what’s the best way to organize information management functions? Or, for that matter, the best way to organize functions within any domain of the framework? We want a framework that checks the following boxes:
- A framework that is reduced to an easily graspable concept. Everyone in the organization should be able to easily sketch and understand the EAG napkin drawing.
- A framework that is flexible enough to adapt to changing requirements, best practices, and technology.
- A framework whose organization that reflects the real-world, to instill confidence that the framework encompasses the complete picture. The framework shouldn’t look as if someone loaded a random list of functions into a shotgun and blasted them onto a wall. The organization should reflect some tangible, familiar concept. The organization should be meaningful.
You can use any organization of information management functions you want, but I find that the most easily grasped, flexible, comprehensive organization is to arrange the information domain functions so that they reflect the management of an information lifecycle. Just like hardware and software assets, information has a lifecycle that begins with creation/acquisition, and includes integration, inventory, and management of updates, security, and so forth, until the information asset reaches an end-of-life.

If you had organized your information functions alphabetically, the organization wouldn’t be a reflection of the real world. There’s no way you could be confident that you had captured all the functions, and if you did later discover a function you had missed, it could just as easily go in several different places in the organization depending which of several interchangeable words you used to describe it. The information lifecycle organization, however, is an easily grasped reflection of the real world. Looking at the organization, any big gaps would be readily apparent, and the proper place of any missing function would be pretty obvious. That’s the kind of organization structure we are looking for.
The information domain functions don’t just happen – you have to manage them as an information lifecycle. How? You manage them by setting up that lifecycle of functions in your functional framework.
Before we go much further, let’s dig a little deeper into the meaning of “information” that we touched on briefly earlier in this chapter. What is this information we are managing? Information comes in many flavors. One categorization that’s going to be very useful for the purpose of the discussion in this book is the following breakdown:

Raw data is the names, addresses, account numbers, purchases, etc. that you manipulate during the normal course of operating your business. It’s the core information you collect, generate, and maintain in order to operate your business every day. It doesn’t include data collected purely for analytical purposes.
Contextual data is information that puts the raw data in context. This information is often purchased (i.e. retail demographics), but it can also be collected directly. Like raw data, contextual data is just basic facts. The main difference is that contextual information isn’t critical to running your business; it’s critical to running the business smarter and more efficiently.
An insurance company wouldn’t normally need to know a person’s education level in order to pay an insurance claim. Education level just adds context that the business finds useful, perhaps as a predictor of lifestyle or attitude. For the insurance industry, then, education level would be contextual information, not raw operational data. For a university, a person’s education level may indeed be raw data needed to run their business, perhaps a pre-requisite to certain courses. Gender may be core business data to a health insurance company, necessary to pay certain types of claims, but gender may be contextual data at a banking institution, whose checking and savings products are not gender specific.
Contextual data is appended to raw data, but isn’t derived from it. Things like income level, marital status, education level, age, and gender are contextual if they aren’t included in your operational raw business data, and have to be acquired and appended.
Knowledge is information that is derived from the raw and contextual information. Customer profitability scores, churn risk scores, and customer segmentation. An enterprise-wide unique person identifier generated by a CDI/MDM (Customer Data Integration/Master Data Management) tool would be derived knowledge.
Decisions are actions taken based upon information. Examples of decisions include generated customer offers, equipment renewal orders, automated account blocks for suspected fraud, or patient risk-based outreach lists. Decisions are actions based upon raw data, contextual data, and knowledge. We then feed the results of these decisions into applications such as vendor order management processes or employee work queues.
The information lifecycle function Enhancing information (page 135) will discuss these different types of information in more detail, but I wanted to introduce them now because the terms are necessary to the discussion of the modeling and consuming information functions.
Modeling information
If you’ve reached the maturity level where your corporation is competing on information, then it’s not your servers or your software that define your company; it’s your information and what you do with it. The two most important assets your company has are its employees and its information. Vendors can replace applications and technology, but they can’t replace your accumulated corporate information assets.
When introducing the information domain earlier, I said that I would be giving it the most attention of the three EAG IT domains, because, despite thirty years of best practice insisting that IT architecture and governance must begin with information management, it’s the least-well managed domain within most companies today. I’m going to spend most of the discussion of the information domain talking about data modeling for the same reason. You can’t manage what you aren’t tracking. If you want to manage enterprise information, you have to understand it, and that begins with data modeling.
Previously, when discussing data monetization, we talked about information assets being as important as financial assets. Just as you would for your financial assets, you want to keep track of your information assets: where they are, how they are being used, which are returning value, and who has access to them. Tracking your information assets begins with data modeling.
Data modeling is the name given to the processes and techniques that are used to document information assets. Modern data modeling techniques have been around since 1970. They bring clarity and understanding to the information structures within database repositories and web services, and optimize those structures for efficient support of information access.
This book isn’t intended to teach or replace any of those techniques. Instead, this is a discussion of where those data modeling techniques fit into your overall program to manage IT complexity at the enterprise level. Assuming you know the techniques of data modeling, what else do you need to be thinking about when you ramp data modeling up from a project or departmental effort to an enterprise-wide function, part of a holistic effort to manage all aspects of your IT infrastructure across the enterprise?
In 1989, The National Institute of Standards and Technology (NIST) introduced the idea of an Enterprise Logical Data Model (ELDM). The ELDM wasn’t about making a data model for any one repository. Instead, it was about building a conceptual data model for all the information across the entire enterprise. The ELDM was the centerpiece of NIST’s concept of a three-tiered modeling approach.
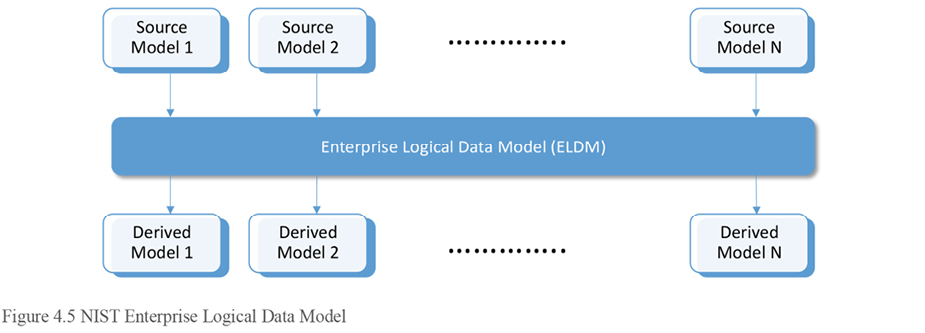
In this approach, the enterprise data architect would first gather all of the pre-existing source data models, including both internal and external applications. From those disparate sources, and from discussions with the business regarding how they conceptualize the company’s information assets, one master data model of the company’s information would be created and maintained.
The ELDM was never designed to be a physical repository. Its purpose isn’t focused on a single project or information system, but on the enterprise. It’s a single data model that shows how the business understands the entities and attributes in single holistic picture, as if all the applications shared one, single, all-encompassing enterprise database. The intent was that this ELDW would let you design one logical model making modeling decisions in one place rather than repeatedly in each repository.
If you try to manage all the different data models in your company separately, it’s simply too overwhelming, and conceptual differences will be introduced that will cause ongoing problems until they’re resolved. By creating one master data model in one place, when you need to implement a model for a project or system, you simply derive it from the ELDM, copying out the subset that you need. There are some segments of our industry today which call the ELDM a Target Information Model (or TIM), but I think that’s misleading, as the intention is for it to become the source, from which many targets are instantiated. I prefer the original ELDM terminology. Of course, the sources and targets of the three-tier NIST model are source and targets only in terms of model building, not information flow.
These derived models will still need modification in order to support application-specific data needs. However, we can do most of the business-related modeling in one consistent model, using consistent terminology, relationships, constraints, and reference data.
Of course, creating a master model of the entire enterprise is a huge task, one that would take many years to complete. This dedicated effort is unlikely to ever be justified in terms of business value. The architectural goal is an enterprise logical model. b Raw data is the names, addresses, account numbers, and purchases that you collect during the normal course of operating your business. It’s the core information you collect, generate, and maintain in order to operate your business every data. It doesn’t include data collected purely for analytical purposes.
Contextual data is information that puts the raw data in context. This information is often purchased (i.e. retail demographics), but it can also be collected directly. Like raw data, contextual data is just basic facts. The main difference is that contextual information isn’t critical to running your business; it’s critical to running the business smarter and more efficiently. But like all strategic goals, we implement that goal over time, in a series of stages consisting of smaller projects that align with business priorities and provide immediate value. Start your enterprise logical model with the entities needed by active business projects, and add to it over time. Like all of IT, the ELDM should only be implemented as it provides real business value, not as an end in itself.
In a company where the technology domain dominates the decision-making, you may find that the data modeling function is the responsibility of the technology team DBAs. There’s no real thought to enterprise data modeling. The modeling that does occur is very technology-centric, with a scope suited to the technology domain focus on server performance, efficiency of disk space utilization, etc. The technology domain isn’t focused on enterprise information management; they are focused on managing pieces of technology.
In other cases, people only model data within the scope of an application development project. In these cases, data may be modeled by the application developer. However, application developers are also not focused on information. Their focus, and rightly so, is on the implementation of business logic in their applications. They aren’t going to make the information easy to manage; they are going to make the applications easy to write. Document databases like MongoDB are especially well adapted to this mentality.
But enterprise information architecture isn’t supposed to be a sub-function of any of the other domains of enterprise architecture. It requires the attention of resources with specific training and a focus on information assets.
I’ve been a fan of IBM’s Rational Data Architect (now renamed Infosphere Data Architect) for many years. From the beginning it had these features:
- The ability to work with multiple data models at once, rather than individually, in isolation.
- Two completely different models could be mapped to each other. This let you reverse engineer the repositories in your legacy sources into models within the tool, and, when you built the enterprise logical data model (ELDM) in another model, document which element in the ELDM model maps to which element in each of these information system models. Between derived models and mapped models, all of your information across the enterprise can map to a single ELDM. The tool didn’t work with a single model at a time, but allowed you to work, simultaneously, with all of the models and with the relationships between them. You could easily use this to trace inheritance back to see where specific ELDM attributes originated.
- Likewise, when you derive new implementation models from the ELDM, the tool could document how they map, so that all the data elements these derived models tie back to the same master ELDM information concepts. You could perform impact analysis when you make a conceptual change to the ELDM in order to identify potential impacts in the derived information system repositories.
- The tool could be used to generate both DDL (for implementing physical repositories) and XML (for implementing data services), resulting in consistency of information representation and exchange throughout the enterprise. It was designed from the beginning to exchange these structures with the application development tools and the technology team database management tools using the Zachman model artifacts.
- The data model could be shared between multiple data modelers and data architects. Most major modeling tools these days have the capability of allowing multiple modelers to work on the same model at the same time, but this is usually separately-purchased functionality. Typically, this works like a code repository, where the modeler makes changes locally, then checks them in to a central repository, where they are merged and distributed.
When this suite of products first came out, it was the only major data modeling tool to have these features. Since that time, other data modeling tools are also adopting more of an enterprise data modeling approach, allowing the modelers to work with multiple models at once, coordinating, and mapping the data attributes across them.
These functions separate an application-level or project-level data modeling tool from an enterprise-level data modeling tool. If you want to implement an information management program to help your enterprise manage complexity, you have to start thinking at the enterprise level of abstraction, eliminating silos of redundant, inconsistent data modeling effort. If you aren’t managing your enterprise data with an enterprise logical data model, then you’ll be overwhelmed by the effort of trying to manually:
- Maintain consistency across physical repositories
- Document the data dictionary over and over within each of your information system models
- Make the same modeling decisions over and over again within each of your information system data models
- Deal with inconsistent, locally-managed reference data
- Maintain consistency across information exchange structures, and consistency between exchange structures and the physical repositories.
- Attempt to manage data at the enterprise level using tools that manage it at the application level.
The data modeling function must integrate with the:
- Data quality function, so that new entities and attributes created in the model can also be added to the metadata repository
- Security function, to identify sensitive data elements consistently across information systems
- Software development functions, to coordinate and simplify the integration of information domain data structures and application domain business logic
The functional framework is a great tool for considering one IT function in light of all the others.
Big data
A big data repository, also known as a data lake, is an array of servers working together as a single distributed solution, using very low cost, commodity hardware and software. It can be used to store both structured and unstructured data. You can use many different tools to manipulate data in a data lake. Some of these tools are similar to tools for relational databases. Other tools are unique to data lakes. Big data repositories are finding their way into more and more business solutions as the products continue to mature.
Why mention big data in a chapter on data modeling? Because big data repositories (by their very design) don’t require data modeling. When the data is initially inserted into a relational database, the data structure must be defined. With a big data repository, modelers just pour raw data into the lake. It’s up to the consumer to interpret the data when the data is read. We describe this difference as “schema-on-insert” versus “schema-on-read.” This difference will impact your long-term vision for enterprise data modeling (and information delivery, data quality, and data security).
There are pros and cons to both approaches. Relational databases typically run on much more expensive hardware and software, and require significant time and development effort to integrate new types of data. However, once the data is loaded into a well-designed data model, it has a great deal of integrity and can be safely, easily and efficiently consumed by end users who aren’t necessarily data experts using many off-the-shelf business tools.
A data lake, on the other hand, is orders of magnitude faster to on-board new types of data. The cost to the business of adding new data is very low, and the time required is almost negligible. One of the major challenges of such a solution, however, is how well the data can be trusted and how easily it can be integrated. It’s up to the user to collect, collate, and interpret the raw data. It is unwise to turn the average end-user loose in a data lake for ad-hoc reporting. When users who are not data experts use poor-quality data to make business decisions, there exists serious risk.
Think of the differences between the two as the differences between using an encyclopedia and using the internet when writing a scholarly paper about an historical event. The encyclopedia set is vetted by experts, but has limited information. It can take years to add new information. On the other hand, lots of lay people (who are not experts) are constantly adding things to the internet. The internet has a lot more information, is almost constantly updated, and it costs a lot less than an encyclopedia, but you really have to use a lot more judgment when dealing with the information. You have to know how much you can trust the different sources it contains and may need to work harder to integrate the different styles of content.
Big data solutions like data lakes are growing more and more broadly useful each year. If you aren’t working with them already, you will be soon. It’s an amazingly useful technology, but I don’t think big data is ever going to completely replace relational databases, at least in the foreseeable future. Relational databases are simply too useful at cleansing, analyzing, and reporting data with defined attribute properties and relationships.
The following two business cases for big data are common, given the current state of technology:
- Big data can be used to offload the kinds of work that relational databases don’t do well, such as working with free-form text or very sparsely populated, dynamically defined data elements. Relational databases do many things very well, but they don’t do everything. There have always been some types of transforms and types of analysis that are better done outside of a database, and the results plugged back in when the outsourced work is done. There have always been some kinds of data that are difficult to store in a rigid schema. Analysis of free form text or of data streams that dynamically define new elements on the fly is better done in a big data solution.
- Big data can serve as a fast-to-fail proof of concept (POC) environment for testing new ideas without going through the delays and overhead of moving data that may never prove useful into a more rigorously designed relational repository. If the idea proves valuable in the POC, then it can be hardened with the data model and data quality inherently found in a relational database. Big data can be a development sandbox for expert business users to trial new ideas. Just be aware that you need to limit the users to those who truly understand the data, and limit the rollout to the development environment only, not to production.
Today, relational databases are the clear default for supporting business solutions, with data lakes being used primarily for tasks that relational databases don’t do well. Some industry experts foresee data lakes gradually becoming more and more the default platform for data storage. Vendors who sell applications for big data platforms certainly have a vested interest in convincing you that this is true. These pundits believe that there’ll be a tipping point where data lakes will become the default, and relational databases will only be used for the things that data lakes don’t do well. Moreover, the list of things that data lakes do well is growing every year. Even heavy-duty statistical analysis tools such as SA, R, and MADlib already support Hadoop big data natively.
However, my opinion is that the future will be less a choice between the two technologies than a merging of the two technologies. One of the primary challenges of using a data lake in a production environment is the lack of a defined schema. We’re already seeing products like Hive allow the imposition of relational database constraints on data lakes, blurring the distinction between the two. More than likely, big data and relational database technologies will merge over time, with the result containing features of both.
It wouldn’t be unusual for database vendors to adopt and incorporate emerging technologies. Several modern relational databases have the following features:
- Can be configured as either Symmetric Multi-Processing (SMP) or Massively Parallel Processing (MPP)
- Can have some tables in the repository defined as row-based and other tables as columnar
- Can leverage solid state disks and in-memory implementations
- Are rolling out implementations that leverage arrays of low-cost commodity servers
The major relational database vendors have consistently realized that no one underlying technology is going to be ideal for all purposes. Rather than lose revenue to another vendor, these databases assimilate the technological advances into their own infrastructure. If big-name database manufacturers begin losing significant revenue to big data solutions, how long do you think it will take them to begin incorporating big data functionality? I predict that relational databases will expand their infrastructure once again to include big data functionality, just as we are seeing big data expand its functionality to include things like relational table modeling. As the two technologies grow, I believe they will inevitably merge. I predict that all the major database vendors like Oracle and IBM will be purchasing big data companies and their intellectual property within the next five years, in the same way they’ve acquired and incorporated columnar, in memory, and XML web service technology. In the future, I predict that some data will be schema-less, and other data in the same repositories will have all the formal constraints of today’s relational databases.
I also predict that the current big data hype will deflate as it comes face-to-face with the cold, hard reality of supporting large-scale, real-world business systems rather than niche solutions targeted for the sweet spot of the current state of big data technology. As more relational capability is adopted by big data platforms, the commodity nodes in a data lake will function very much like nodes in a relational MPP environment such as Teradata, Netezza, or DB2 DPF . As an MPP database solution, data lakes will need to find a way to overcome the same kinds of challenges that MPP relational databases face. An MPP solution is excellent at operational and analytical operations over a single table and over tables where related data can be guaranteed to be collocated on the same node. However, the solutions don’t perform nearly as well in situations where data in two different tables that aren’t co-located must be united (see in depth discussion of this in the hardware domain chapter, page 234). Other emerging technologies that distribute data over an array of servers (including NoSQL databases such as MongoDB) have this same co-location challenge, making the technology difficult to use for large-scale enterprise analytical applications.
Regardless of what component lies at the center of your infrastructure, both big data and relational databases are here for the foreseeable future. You need to determine at the enterprise level how they will be used. What are your policies for big data? How do you secure sensitive data in a schema-less data lake? Perhaps the most important to deal with immediately, what kind of review and approval is needed before standing up a data lake? I’ve seen individual departments stand up data lake and NoSQL solutions with no other justification than that the solution let the application development teams bypass the use of DBAs and data architects entirely, and let their developers create corporate applications without any information management oversight. Get a handle on your big data strategy before it becomes a problem, or it’ll quickly be out of your control.

Zones of information within an enterprise repository
Most application repositories, whether operational or analytical, have several zones of information, though they may not be formally recognized as such. Figure 4.6 demonstrates one way in which information zones within a single repository might be defined in order to create policies and standards specific to different types of information.
You can use this same classification in repositories across the enterprise, allowing you to make your architectural and governance much simpler and more consistent. Thinking about information zones in this way allows you to make fewer, broader, more consistent decisions about architectural vision and governance standards, resulting in reduced complexity, greater uniformity, and increased efficiency.
The following table contains a few simple policies, showing how the division of information into zones reduces the amount of documentation and ensures consistency.

If you set up your architecture and governance around these information zones, then you have far fewer decisions to make than if you made your decisions table by table, repository by repository, and the result will be more consistent across the enterprise. With clear, simple guidelines, your development teams will have far fewer questions, and will tend to do the right thing without much oversight.
Layers of information across enterprise repositories
There is a sense in which data flows through these zones, from temp/working zones, to operational zones, to analytical zones. These zones don’t exist solely within a repository; to some degree, they exist across the information infrastructure of the larger enterprise.
Data flows from repository to repository, being consumed, transformed, and enhanced along the way. In a large organization, there can be thousands of databases. Managing that complexity is impossible without some sort of organization – some way of grouping them into categories that can be managed similarly. You need a napkin drawing that explains your enterprise data repository strategy in a few simple terms. Unlike the application and technology domains, few companies have an enterprise-wide strategy for managing information. Oh, they manage information, but often this happens more intuitively than systematically.
Figure 4.7 represents an enterprise-wide organization of information structures. Note that this is the structure of information repositories, not the structure of application software or the hardware that supports them.

There are several layers of repositories in the conceptual picture. At the top are your operational repositories, where the raw data that runs the business is created and maintained. Beneath that are two transport layers for exchanging data between information systems. The first transport layer is the enterprise bus, over which data is exchanged using real-time web service transactions. The second is the secure file transport area, through which batch data is exchanged using files. At the bottom of the picture are the analytical repositories, the data marts, and the data warehouse.
The advantage of thinking of your company’s information assets in these layers is, again, that you can make broad decisions for each layer, rather than have to plan and document repository by repository. In order to simplify and reduce the complexity of managing the company’s IT functions, the EAG architectural vision for the information modeling function in the information domain of the functional framework should include some such high-level information model. All the repositories should be classified by layer, and all the tables within each repository classified by information zone, such as user-facing tables, reference tables, and temp tables.
The next few sections will discuss these information asset layers in a little more detail.
Operational layer
Operational Repositories contain the raw transactional data that runs the enterprise. This is the information created and maintained by customer systems, account systems, web portals, HR systems, and so forth. These contain business data that is maintained, for the most part, by inserting, updating, and deleting a single record at a time. From a data management standpoint, it doesn’t matter if these repositories are within your firewall or are cloud-based services. These repositories are the System of Record (SoR) for the business data they create and maintain. In an integrated IT infrastructure, information systems will need access to all of the enterprise business data spread across dozens of applications, each of which is the system of record for some subset of the ELDM.
What you do not want to do is distribute complete copies of data throughout the enterprise so that each operational layer information system has its own local copy. This wastes disk space, network bandwidth, and developer time. It causes synchronization and data integrity issues. Each local copy of the data is another potential security breach, and another component that must be managed in a disaster recovery environment.
Instead, the information in these operational repositories should be exposed through service interfaces to your application infrastructure, a practice known as Data as a Service (DaaS). These data services allow the data to be loosely coupled, meaning that the data could be accessed in the same manner by any application that called the correct services interface, and that the application could access any data, provided the data was exposed using the same services interface. Loosely coupled data makes your infrastructure more flexible, easier to enhance, and faster to adapt to changing requirements. Loosely coupled data can be moved to a different data storage technology, or even to the cloud with no impact, so long as the service interface, security, and performance are sufficient. Any application you build or buy today should include the capacity to expose data through transactional web services. Applications should expose data not only internally to their own business logic, but also externally to the rest of the corporate infrastructure. Build or buy with this extra volume requirement in mind.
In some legacy software, the system data is housed in a proprietary storage format or is constrained in some other way such that it can’t be accessed directly even though it is the system of record. In those cases only, you may be forced to stand up an Operational Data Store (ODS) – a copy of your source data with as little latency as possible, which can be used in turn to provide DaaS to the rest of your application infrastructure. The ODS serves as the services interface that the application is unable to provide. When the system forces you to set up an operational data store, that ODS becomes the System of Access (SoA) for operational reads, but the OLTP repository is still the system of record. An ODS typically only exposes read-only services to other applications. Any maintenance of the data must go back through the real source system, after which it will naturally flow down and update the ODS. Since most intra-application DaaS service calls are select statements, this approach works well for most business needs.
When evaluating any new third party software, one of the information domain requirements should be that the application exposes its data externally through services. No new application you build or buy should require an operational data store in order for other applications to access its information via data services. An ODS is only justified for legacy software in your infrastructure. Figure 4.8 shows an ODS in every operational information system. Hopefully, this won’t be the case in your environment!
Information exchange layer
Ideally, information is exchanged between applications in only two ways:
- On a transactional basis, via data services
- In bulk, through secure file transfer
Your enterprise service bus coordinates the exchange of services. The secure file transfer area coordinates the exchange of files.
No single project is likely to want to bear the expense of setting up these areas of your information exchange layer. The cost and complexity is simply too much for one project to bear. Your EAG team will have to build this layer. This may be one of those cases where the EAG team must go request money for an IT-centric project. However, the information exchange layer isn’t a case of IT wanting to play with the latest toys. These information transport areas provide significant value to the business in the long term.
Enterprise Service Bus
An Enterprise Service Bus (ESB) is a means of passing a very high volume of small chunks of transactional data through your network in real time, without having to stage data through files. ESB’s support both software as a service (SaaS) and data as a service (DaaS).
It’s possible to implement services without an ESB using a point-to-point architecture. While better than no services interface at all, a point-to-point architecture forces the source and target to handle a great deal of the overhead of configuring connection points, authenticating the service, orchestrating services into larger business processes and translating from one service protocol to another. You may implement point-to-point as a tactical step toward your strategic vision for managing your corporation’s information assets, but you should make plans to move to a service bus as soon as it can be justified. The business isn’t paying IT’s salary so IT can develop software in-house that could have been purchased off the shelf for less money with more features.
Ideally, in a Services Oriented Architecture (SOA), all data will be accessed via services. This is true even for a software application accessing its own data inside the information system.

Accessing data via services is what creates the loosely coupled architecture that insulates the applications from changes to the repository implementation and vice versa. If a new field is added to a table, applications can still read data with the old service. Likewise, applications can be upgraded or replaced with limited impact, as long as the new/updated application supports the same data service interfaces. For example, you may initially develop a customer data hub in-house to assign a master ID to every customer . As long as all of your operational systems access that information via services, you may one day be able to replace that homegrown functionality with a commercial product, provided you can translate your homegrown interface services to and from those required by the commercial software.
DaaS Services developed for one use are immediately available for any other information system that needs the same data. DaaS services initially developed for the web presentation business logic can be reused by the mobile device presentation logic. This speeds development time and reduces testing.
Data within these services should be modeled on your ELDM model. In a third-party product with a proprietary data model, the data services within the application will reflect the native third-party model. But in this case those data services should still be translated to reflect your ELDM before exposing that information outside the system. Your data modeling tool used to generate the ELDM should be able to generate both DDL to build physical repositories and XML to build data services. This way, you design the information once in the ELDM, then, from that ELDM model, generate consistent representations for various subsets of information at rest and in motion throughout the enterprise.
Most ESB appliance solutions today have the capacity to translate service protocols, for example, from SOAP to REST. One information system can expose data in one format, and, through the ESB, another information system can consume the data in another format. From an information management standpoint, one of the most useful ESB translations is the ability to take a database-stored procedure and translate that procedure name, input, and output into SOAP or REST services. This is a very useful approach for several reasons:
- You don’t have to stand up dedicated web servers to support Java DaaS services developed in-house. You can create a simple stored procedure in the database and let the ESB translation tool expose it as a service. Fewer components means the solution is easier to manage, faster, and your disaster recovery plan is simpler.
- By forcing database access to go through stored procedures, you’re limiting the type of data access that can be done, mitigating the risk of inappropriate access. You can grant a user access to a stored procedure without granting them access to the data in the repository that the stored procedure accesses.
- The stored procedure can be developed to include embedded logging, insuring that there’s an audit trail for all service-based data access. Auditors like an architecture where data can’t be accessed without generating an audit trail.
- When you alter the database structure, you use the same people and tools to modify table structures and to modify the stored procedure. This minimizes the number of resources needed to implement the change. You don’t have to get a DBA and a Java developer to make the database change and the associated service change.
There are several considerations to keep in mind when building data services. Data services should be quite small in size. I once worked at a company with a very powerful ESB infrastructure, yet the system was always bogged down, performing poorly because the developers had coded a one-stop shop “get me everything I could possibly need” service, so that they only had to call a single get_account_info( ) service. Unfortunately, this account information included all the customer information, all the product information, and all the transaction information, all in one multi-megabyte service.
- Services should be designed at the same granularity as the underlying data. In the example above, it would have been better practice to implement a get_account_info( ) service that pulled the account-level information, and separate get_account_product_info( ) and get_account_transaction_info( ) services for all the child objects of the parent account information. If the information would be represented by more than one table in a normalized repository, it should probably be represented my more than one service in a service catalogue.
- In cases where you must retrieve a number of records at the same level, the services should not return all of them in one massive list. Rather, you should implement pagination. Typically, you would implement pagination as Get_list(key, starting_with). For example, Get_transaction_history(account_key, starting_transaction). Calling the service with 0 as the starting transaction would start with the latest. If the caller really needs the entire list every time, this should raise a red flag. Perhaps they’re attempting to build a local copy of the data, which is never a good thing. Or perhaps they are performing some sort of aggregation or analysis which might be better done ahead of time in an analytical repository, with the results exposed as a fast, efficient service.
Secure file transfer area
Most companies will also have a secure file transfer area. Here data can be dropped by one source and picked up by another without risk of access by unauthorized people or systems. A dedicated team within the hardware domain usually manages this. The secure file transfer service is an important business function, which usually includes security, logging, multi-generations of backups, and is monitored against defined service level agreements.
Batch file transfer is rarely a good way to exchange information between two operational information systems. Analysts typically use batches to transfer data outside the network, or to transfer daily delta information between operational and analytical repositories.
Analytical layer
Analytical repositories are copies of data from the operational applications, possibly enhanced, transformed, and accumulated. Where your operational repositories are your systems of record, Forrester Research calls the analytical repositories the System of Insight (SoI).19
Someday the analytical and operational worlds will merge. That trend has already started (page 96). However, until technology catches up, it’s still considered best practice to separate the two most of the time. There are two acceptable analytical repository destinations for operational data, an application-specific data mart, and an enterprise data warehouse. We will also discuss enterprise data marts, but those are fed from the data warehouse, not directly from the operational source systems.
Application-specific data marts
Operational repositories are designed to support a very high volume of create, read, update, and delete (CRUD) transactions that access a very small number of rows. Analytical repositories, on the other hand, need a much smaller volume of transactions that access a much larger volume of records in read-only mode. Implemented in the same repository, analytical and operational functions conflict with each other, causing performance problems on both sides. Database block size, block free space, the number of indexes and constraints, and the entire hardware stack are configured differently for analytical and operational processes .
Until technology matures to the point where the operational and analytical process can coexist in the same repository without conflict, it’s acceptable to make an analytical copy of an application’s data for application-specific analytical reporting. This Application-specific Data Mart (ADM) will be located on a separate physical database on separate physical hardware from the operation data.
The application-specific analytical data mart is usually a dump of a large part of the operation repository, with the minimal database structural changes. The database block size, free space, and indexes may be configured differently. The hardware stack supporting the analytical repository may be tuned differently. However, the table and field names are typically unchanged, so that the same SQL queries can be run against the source system – albeit without the same performance.
The practice of keeping the data in the same structure as the source is mainly used to minimize the effort of building and maintaining the analytical repository, and the complexity testing its fidelity to the operational source. In some cases, it may make sense for the ADM to be created in real-time using a Change Data Capture (CDC) tool. The fewer structural changes between the source and target, the more stable these tools are. The one transformation I would recommend in this case is the generation of a record update timestamp, which can be very useful in determining which records have changed, known as the “delta.”
The analytical repository may need some summary tables that are not present in the source operational repository. That’s ok, provided the operational tables be brought into the ADM as-is, then separate summary tables built from them.
There should be only one ADM for any one information system. That data mart may be built and maintained by the application support team, or it may be built and hosted on their behalf by an analytics team. It’s very common to know the enterprise analytics team as the “data warehouse team,” but this team also manages dozens of applications-specific data marts. There are several advantages to this approach:
- Building and maintaining analytical data marts requires several specific skills distinct from those required to support operational systems. It makes sense to leverage the same set of analytical experts for many hosted data marts.
- Hosted data marts for several applications can share the same physical database, under different schemas and security roles. This allows the repositories to share more powerful physical resources, as well as shared services such as backup/restore, disaster recover, and security provisioning.
- The hosted data mart solution often serves as an end-of-life repository to preserve the application data after the application is decommissioned. If anyone shuts down the operational application, having an analytics team host the data mart eliminates the need to build and populate an end-of-life repository, and allows the operational team to immediately move on to other projects.
End users should never be allowed to join data across multiple application-specific data marts. In effect, that would serve as a mini-data-warehouse solution. Combining data from multiple operational systems into a single confirmed model with conformed reference data, balancing and integrity is an extremely laborious process, requiring a very specific skill set. Your information management strategy should include only one data warehouse, and enforce that all cross-application analytics occur there.
Even if data will eventually flow from the application-specific data marts to the enterprise warehouse, they should not share physical resources. Placing them together will impact database backup and restore times, as well as make your batch windows longer. It increases the size of the technology infrastructure needed to support the solution, which increases the risk of not being able to add CPU and memory to your warehouse solution because your hardware platform is maxed out. It also makes it difficult to manage the data mart and data warehouse at different levels of failover and redundancy, and creates a single point of failure if that one underlying hardware solution fails.
Enterprise data warehouse
The most important five words that describe the Enterprise Data Warehouse (EDW) are “there can be only one.” The enterprise data warehouse is the one place in the entire company where all the enterprise information assets come together.
This is the closest you’ll probably get to a physical implementation of the full enterprise logical data model (ELDM), though the warehouse model will probably be missing some components of the ELDM, such as HR. The goal isn’t to build the entire ELDM; the goal is to consolidate an analytical copy of all the information assets needed to support the business requirement for enterprise analytics in one solution. The data warehouse may have some extensions of the ELDM as well, such as load dates.
As the IT industry focuses more and more on information, analytics becomes more and more critical to the success of your company. The enterprise data warehouse is the only place to perform enterprise-wide analytics. It has to be correct and trusted. It has to be current, and available. It has to perform well, and it needs solid tools to support various types of analysis.
Time was when a warehouse wasn’t a critical component of an IT infrastructure at all, and many companies didn’t even have one. Those that did have them didn’t consider them strategic; and they were mostly an unplanned, gradual accumulation of data necessary for various projects. They were warehouses in name only; practically speaking, they were more of a landing area for loading flat files from various sources than anything. Don’t be too embarrassed if this describes your current enterprise warehouse – it’s pretty much how the first generation of every enterprise warehouse starts.
You probably already realize the limitations of those first-generation, unplanned analytical platforms. At some point, you’ll get the opportunity to start again, usually due to the poor quality and performance of the first-generation solution, or the high cost of building solutions on top of it. The structure of these first generation warehouses is rarely worth saving, but you usually need them to keep running while you build the next generation. As the next generation spins up, you’ll be able to do parallel testing to test the accuracy of the new platform against the old.
At some point, you’ll find the new warehouse a much better platform for all new development, and switch to it as your primary platform. However, it’s actually difficult to get rid of the legacy warehouse. Given the choice between spending your budget rolling out new functionality in the new warehouse, and spending those same dollars porting functionality that’s working just fine in the legacy warehouse, it doesn’t make great business sense to shut the legacy warehouse down.
Instead, the approach you’ll take should be very similar to the way you would roll out any architectural strategic vision in a series of tactical steps. You’ll wait until you get a business-funded requirement to make a significant change to a piece of functionality still implemented in the legacy warehouse, and take that opportunity to redevelop the functionality in the new warehouse instead. Because of the high quality and integrated model of the new warehouse, the development time will actually be shorter there. After enough of this, very little functionality will remain in the legacy warehouse, and the business cost of the hardware, software and support of the legacy solution is greater than the effort of porting the remaining functionality to the new solution.
Enterprise data marts
There’s a difference between an application-specific data mart and an enterprise data mart. Application-specific data marts contain data from only one application, and typically use the same schema and code sets as the application from which the data is derived.
Enterprise Data Marts (EDM), on the other hand, are small subsets of the enterprise warehouse information, a business “sandbox” if you will. They contain the data needed for a specific business purpose, modeled for ease of use and performance. The modeling technique used depends on what you’ll use the sandbox for . The data warehouse itself can be used by reporting, but since it’s a normalized model, it isn’t always the easiest solution for the business to use, nor the best performance. Instead, once the data is brought into the warehouse, conformed, enhanced, and data quality enforced, then specific enterprise data marts can be derived from it.
Enterprise data marts may be housed in one or more dedicated schemas within the same database as the enterprise warehouse, or they may need to be hosted on their own platforms. Both are acceptable. The determining factor is whether the availability and performance of the enterprise warehouse infrastructure is acceptable for the data mart. If the data mart is serving your external customers via a web portal, and your internal warehouse has no failover or redundancy and has regularly scheduled, long maintenance windows where the platform is unavailable, then you’ll probably need a separate platform for the data mart. You may also wish to segregate some critical data marts onto separate hardware to decouple them from the impact of the heavy-lifting batch processes occurring in the data warehouse.
There are several advantages of building enterprise data marts from the enterprise warehouse:
- Built from the same source, all the data marts will yield the same numbers. This promotes trust and increases the use of the data.
- Because each data mart is built from the enterprise data warehouse, all the heavy work of integrating and conforming is performed one time only – not once per data mart. The data marts can be spun up much more quickly.
- Since the enterprise data marts leverage the enterprise data warehouse scope and quality, improvements in data quality or broadened scope of data in the enterprise data warehouse immediately benefit all the enterprise data marts, without any data mart specific coding.
Internal architecture of a data warehouse
There are many fine books on modeling for operational systems, as well as many fine books on modeling data marts. There are even a few excellent books that connect the dots between the two. But I find that most companies’ biggest single trouble spot is creating an analytical enterprise data warehouse in a way that fits into an overall plan for managing the company’s information assets.
As usual, managing complexity begins with reducing it to a few simple concepts that can be managed relatively independently. The data warehouse contains all of the information zones mentioned earlier. In the enterprise data warehouse, these tiers look like:

This is similar to the convention proposed by The Data Warehouse Institute (TDWI) years ago. They didn’t call out the reference data separately, and referred to the remaining four tiers as Staging, Transform, Distribution, and Access.
The seminal book on high-level enterprise data warehouse structure, The Corporate Information Factory, referred to an operationally modeled layer called the Operational Data Store (ODS) and a Data Mart layer. The normalized layer was labeled the ODS not because it was accessed operationally, but because it was modeled as you would an operational database, with a highly normalized design.
These days, there’s a great deal riding on a company’s ability to produce accurate analytics efficiently, and these days, the information domain is the weakest EAG domain at the enterprise level. Because of this, I think it’s worth spending some time discussing the enterprise data warehouse analytics platform in more depth than most of the IT functions in this book.
Recommended Reading:
The Corporate Information Factory, Claudia Imhoff and Bill Inmon, 2001, Wiley.
Staging tier
The first layer of data, known as the Staging Tier, is the raw, untransformed data from internal and external sources, stored just as it was received, with very minimal processing. As such, it doesn’t need to comply with the naming standards imposed on the conformed distribution and access tiers of the warehouse. Genealogy information about the staging tier should be stored in the metadata repository, which maps each field in the staging tier back to its source system.
If the data does not need to be accumulated or accessed directly by end users, then this staging tier is usually a schema in the data warehouse physical database. On the other hand, if the data does need to be accumulated historically, or if end users other than the data warehouse support team need to access the raw data directly, the data should be stored in a hosted data mart, typically housed on another database, with one schema per hosted application. Both the internal landing zone schema and the hosted data mart database are considered part of the staging tier of the enterprise warehouse.
Transform tier
The Transform Tier houses the temp tables used in the data transformation process, as surrogate keys (unique numbers meaningful only within the EDW) are being created and source-specific codes are being translated to enterprise codes. This is particularly useful if your transformations are performed in the database using SQL statements. If you’re using an ETL tool that does most of the data transformation work outside the database, you may have little need for the transform tier. However, I’m one of the old school that still believes that, even if you have a high-end ETL tool, there are many types of data transformations that are going to be far faster and more efficient if performed within the database, in the transform tier.
The transform tier should not be accessible by end users and should not be accumulated historically. It is a working area, where data can appear and disappear without the business being notified. The transform tier is a bit of a mix between the source data format and the enterprise format. Don’t expect this tier to map to the ELDM, or to follow naming conventions of the subsequent tiers of the warehouse. It is usually an odd mixture of the source-specific staging tier attributes and the distribution tier enterprise attributes.
Distribution tier
In almost any operational system, the data will be stored in a Normalized Model. Normalization rules were first set down by Edgar F Codd in 1970, and revised by Codd and Raymond F. Boyce in 1974. Normalization is used to reduce data redundancy and improve integrity.
For example, if you had a table for sales orders and a table for customer information, normalization rules would have you put only the customer key on the order table, rather than copying all the customer information onto each sales order. Putting a complete copy of all customer information on each order would not only be wasteful of space, it would lead to fewer records retrieved per I/O, resulting in poorer performance, and it would cause a great deal of overhead when customer information is changed and had to be updated on every sales order the customer ever made.
In a data warehouse, normalized data is ideally suited for verifying data quality, enforcing referential integrity, balancing transactional data to the general ledger, addressing reference data and master customer data issues, and appending contextual data and knowledge. This tier should contain all of the information assets needed for enterprise analytics in a conformed enterprise schema, using conformed enterprise reference data, with all data quality processes complete. It is the best possible version of the enterprise information assets, intended for use by the business to make the decisions that steer the company.
This highly normalized layer of the data warehouse is known as the Distribution Tier, because it is the source from which all enterprise information is subsequently distributed. It’s also sometimes referred to as the data quality tier, the integration tier, the conformance tier, or the operational data store.
One common debate is the degree to which the distribution tier, or the ELDM upon which it is based, should reflect the source systems.
The distribution tier and ELDM should not attempt to reflect the model of the source systems. The operational source system data model is the way the application domain thinks about the data, but isn’t necessarily how the business thinks about the data conceptually. This is especially true when the operational applications are third-party commercial products, and when there are multiple operational sources that service different segments of the same information (e.g. multiple customer or product systems, multiple claims or sales systems). In these cases, the way the business thinks about the information at the enterprise level is certainly different from the way each application models the information.
You’ll occasionally find an analyst who is very familiar with the operational source for a system data model, to the point where they think that model represents the way the business thinks about the data. Just because the business has had to think about the data in this way for years doesn’t mean that model reflects the actual business concept. Sometimes the person you need to talk to about the proper way to reflect the business understanding of the data concepts is someone a little less familiar with the details of the operational system models. Talk to the business experts, not the business’ application experts.
The distribution tier should, however, attempt to retain the data values from the source systems. Yes, you need to transform source specific codes to the enterprise reference data, but you must not lose the actual source-specific codes that were used. There may be fields other than reference data that are also transformed – perhaps amount fields that different source systems interpret differently. Perhaps one source system includes sales tax, fees, withholds, discounts, or coupons in a paid amount field, where another source system does not. In these cases, you may need fields to house the original source system values and enterprise calculated fields. Retention of the source-specific values facilitates balancing back to the source systems, rebuilding the enterprise calculated fields if necessary, and facilitates research.
Conforming all of the disparate sources into a single enterprise model with consistent enterprise codes and consistent calculations is by far the hardest part of building an Enterprise Data Warehouse, but the distribution tier of your data warehouse can make or break how effectively it will meet the enterprise-wide analytical needs of the business. This function is far more important now than it has ever been before. Make sure you don’t rush through this! Get it right!
Access tier
There’s no reason to prevent an end user from accessing the normalized model in the distribution tier if they can use it efficiently. However, a normalized model isn’t optimized for analytic queries. A normalized model results in the creation of lots of keys, and data spread across many tables. Data quality is much easier if the customer name and address exist on one record in one table, where it can be easily updated. Some analytical processes, such as drill-through detail reports, don’t involve summarization and can be written to use the distribution tier efficiently. However, most analytical processes aggregate huge numbers of records, and perform poorly on a fully normalized model.
Many analytical processes would perform much better if the information were modeled using other techniques. They might prefer the customer name and address be duplicated on every customer transaction. Those techniques are perfectly acceptable, provided they are not used in the distribution tier, where data quality and contextual enhancement are occurring. The purpose of a normalized model in the distribution tier is to facilitate these quality functions. Throwing in other modeling techniques would make data quality processes much more difficult, and the overall quality of the warehouse would suffer.
Instead, you should distribute the normalized data to downstream data marts with end-user optimized models in a layer of your repository known as the Access Tier. The access tier contains many data marts built entirely with data from the distribution tier of the enterprise data warehouse, hence the name Enterprise Data Marts (EDM). Each EDM is a sandbox for a specific business need, modeled for performance and ease of use for a specific type of access. The data has been vetted for that purpose, and, so far as possible, has been arranged in a manner so that the data cannot be misused in ways that might have occurred if an end user had attempted to use the larger, more complicated distribution tier directly.

This practice of creating specific data marts may seem a violation of the enterprise goal of not creating redundant implementations of the same data. Here we’ve taken the operational source data, replicated it in an applications specific data mart, and again in the distribution tier of the enterprise data warehouse, and now we are intentionally distributing that data to a number of enterprise data marts. That’s at least four copies of the same data, probably more.
Always attempt to eliminate redundant physical representation whenever possible. In these cases, though, the business value must outweigh the risks. With the current state of technology, a single repository simply can’t serve as the operational source and as the analytical source at both the application-level and enterprise-level for every kind of analytical process.
From the business perspective, these enterprise data marts provide the real value. To them, these data marts are the enterprise analytical platform, and the distribution tier simply an IT-centric staging area. Ralph Kimball was the father of dimensional modeling (page 124), one of the most popular business-friendly modeling techniques used in these enterprise data marts. Kimball has often been quoted as insisting the entire warehouse be dimensionally modeled. However, if you read his books, you will find that he does recommend a preparatory area where data is conformed, the quality is enhanced, and contextual data appended. He isn’t recommending that prep area be a dimensional model. Instead, he’s simply rebranding the dimensionally modeled data mart as the data warehouse because that is where most users are finally exposed to the analytical information. He isn’t suggesting a difference in architecture; he’s suggesting a difference in nomenclature.
Modeling techniques
There are many different ways to model information. Each technique serves a different purpose. The following sections contain a brief description of a few of the most common modeling techniques. It isn’t my intention to teach modeling techniques in this book. Instead, the goal here is to show you how to use various modeling techniques to bring order to the chaos and manage your IT complexity on behalf of the business.
Relational models
Relational modeling is the type of modeling described earlier, a normalizing technique originally developed by Boyce and Codd to eliminate redundancy. It’s a technique that’s very useful for the IT organization because it makes the data quality so much easier to maintain. If you’re bringing data from disparate sources together or maintaining it on a transactional basis, a normalized relational model is definitely the technique you want to use for business information.
I personally don’t often normalize reference tables. They’re small and don’t change rapidly, so the disk saved by normalizing reference tables, and the cost of potentially having to update the same information on multiple rows of non-normalized reference tables is outweighed, in my opinion, by the convenience of having all the reference attributes together in a single table. Not everyone agrees with me on this.
Normalized models are extremely useful in operational systems. If a developer works on operational systems only, they may never use any other modeling technique.
That said, many operational systems in the past deliberately chose to violate normalization rules, creating data structures that are difficult to use today. There was a time when one could argue that this compromise was justified due to factors such as disk storage costs, but that time is far behind us. No new functionality should be developed using the priorities of a quarter century ago.
Perhaps one day a new modeling technique will prove even more powerful, and we will be stuck maintaining all these normalized models we’ve created. The data architect must always be looking out for new technologies and techniques. They must always be willing to adapt data strategies in support of the business as the industry continues to develop. But for now, the normalized relational model is the preferred technique for business information stored in operational repositories.
Recommended Reading:
Data Modeling Made Simple 2nd Edition, Steve Hoberman, 2009, Technics Publications.
Dimensional models
For slicing and dicing, drilling into and out of different views of the data, the best modeling technique to use is generally a dimensional model. Dimensional modeling is a complex technique that takes a few paragraphs to explain but years to master.
Dimensional models are still relational and can be implemented in any relational database, but the data in these tables is not normalized. The dimensional model is a relational model with a few simple restrictions.
One of the problems with most report authoring tools in the past was that they required a lot of database knowledge on the part of the end user. Specifically, the user needed to know two key pieces of information: the physical table and field names, and how to join those tables together properly.
Dimensional modeling began as an attempt to solve those two problems so that end users only had to know business names, and need not understand the underlying physical database at all.
In response to the first problem, a knowledgeable administrator worked with the business to create a cross-reference table that mapped a concept name that the business understood to an actual table and field name. This isn’t a case of “dumbing down” the database for the sake of the business; it’s a case of bringing the arcane complexity of the database back to the real-world concepts of the business it’s supposed to serve.
The second challenge was harder to solve because, in a normalized database, there are relationships all over the place. It’s difficult to tell how the user may want to join tables together. The way the challenge was solved was to impose upon the reporting tables a rule that there could be only one way to join any two given tables together. A table with all the business information was placed in the center, and joined to surrounding reference tables. This structure is now known as a Star Schema. The administrator then only had to define the keys that joined each of the reference tables (known as Dimension Tables) to the central business table (known as a Fact Table).
The dimensions tables were de-normalized so they could contain many levels of hierarchy fields in each row without requiring additional parent or child reference tables. The central business tables consisted purely of the keys to the dimension tables and the business Measures – the counts and amounts that were being reported.
After this is implemented, the business user simply picks from a list of familiar business terms they want reported. Underneath the covers, the software translates those business terms to table and field names, and adds the necessary joins to connect the tables used by the data. Simple!
Actually, it’s quite complex, and takes years to master, but you get the idea. The point being that this technique gained popularity over other analytical modeling techniques because it was easier to build reporting tools over this model than the others. Because of the proliferation of tools based on this model, the database vendors added optimizations in the microcode to increase the performance of this special subset of relational modeling rules, making the technique even more powerful and more popular. At this point, it looks like the dimensional model is here to stay.
Some proponents of dimensional modeling claim that this technique is the silver bullet for analytical reporting. Some even claim that it’s these fact and dimension tables alone that deserve the title of enterprise data warehouse. Dimensional modeling is an extremely powerful tool for creating analytical BI reports, but there are other analytical processes that are better served by other modeling techniques.
Recommended Reading:
The Data Warehouse Toolkit, Ralph Kimball and Margy Ross, 2013, Wiley.
Statistical models
One case where dimensional modeling doesn’t work well is statistical analysis. This is the process of analyzing statistical relationships between different data elements, such as the relationship between the use of certain prescription drugs and liver damage. When performing statistical analysis, highly educated, highly compensated statisticians often spend 80 percent or more of their time just preparing the data for analysis, and less than 20 percent actually performing the analysis. This is not an effective way for IT to support the business.
Statistical modeling software isn’t optimized for highly normalized models or dimensional models. The software typically works best with wide, flat data sets. This is more than just joining the tables together into one big query returning all the fields. Consider a gender code, for example. A typical wide, flat representation would pull the gender code from the business table and the gender description from a reference table. Since they are based on mathematical algorithms, statistical modeling software isn’t interested in the text descriptions, and would have difficulty with alpha codes.
A typical code domain for gender might be ‘M’, ‘F’, and ‘U’. Because statistical analysis involves mathematical modeling that works much better with numerical data than codes, these gender codes might be better translated, for statistical analysis purposes, to 0 (unknown), 1 (male), and 2 (female). However, if these values were all placed in a single gender field, the statistical model would tend to treat them as ordinal. Assigning the female gender a value twice the male value is probably going to throw off your statistical analysis. Therefore, a statistical model will prefer to roll those genders out into multiple discrete fields such as IS_MALE (0/1), IS_FEMALE (0/1), and perhaps IS_UNKNOWN (0/1).
Creating an automated process to prepare these statistical data sets ahead of time and refresh them regularly will go a very long way toward reducing the amount of time those highly compensated statisticians spend doing manual data preparation, and increase the amount of time they spend actually using their advanced degrees to analyze the results.
In today’s competitive environment, corporations need to be analyzing their data deeply, mining it for insights that can be used to increase revenue, reduce expenses, and grow the business. If the competitiveness of your company rests on data mining, then IT needs to provide a solid platform for creating and testing models, for making the results operational, and for monitoring the effectiveness of those results. Forrester research recently reported that the data engineers who build this data infrastructure have become even more important than the statisticians who do the analysis.20
Recommended Reading:
Discrete Multivariate Analysis: Theory and Practice, Yvonne M. Bishop and Stephen E. Fienberg, 2007, Springer.
Annualized models
There are a number of other techniques for modeling presentation layers, including graph models and object oriented models. There’s no wrong answer as long as the model is derived from your normalized operational model and meets the performance and ease of use requirements of the business.
One last model we will mention is the annualized model, most commonly used with profitability calculation. Profitability is, as you might imagine, very important to the business. Since you can’t manage what you aren’t measuring, you need to be calculating your profitability over time by whatever dimensions your business uses, such as product, region, customer segment, and channel.
There are many ways to calculate profitability, and many third party applications to help with those calculations. The simplest approach is Allocated Costing, in which the costs that can’t be attributed to a single transaction are allocated across a larger group of transactions. If you’re a bank and have a network of ATMs you service, you may want to spread the cost of the ATMs evenly across the people who use each of the ATMs when calculating your customer profitability. Customers on the west side of town share the support costs of the ATMs in their area, and so forth.
Another approach to profitability is Activity-Based Costing. In the previous example, if you have one ATM in a remote or inconvenient location that only a handful of customers use, do you really want to allocate the entire cost of the ATM to those customers, showing them to be very unprofitable? In activity based costing, you only allocate to the customer a percentage of the ATM cost based on their activity time, and show all the idle time as unused bandwidth. Bandwidth that has a cost to you, certainly, but is not allocated to your customers.
Regardless of the costing approach you use, most of the third party software products that perform these calculations for you prefer the data in annualized form. Every count and amount is represented 12 times on each record. Examples include JAN_ATM_COST, FEB_ATM_COST, and MAR_ATM_COST. This isn’t a normalized model, nor is it a dimensional model or a statistical model. It is the model that provides the most efficient platform from which to calculate annualized profitability.
And that’s the point, really. There is no one modeling technique you should use in your analytical data marts. Instead, you need to provide the models that result in the easiest to use, highest performance platform to support the business need. As there are many different business needs, you will probably have many different data marts, each of which may use different modeling techniques. Just don’t try to compromise and mix multiple modeling techniques in a single data mart in order to serve multiple end users. This will result in a confusing, poorly performing data mart that does not serve the business well. Instead, dedicate separate data marts with different modeling techniques to different business needs.
Enterprise modeling guidelines
By this time, you should be well aware that a good deal of the work of architecture and governance is breaking large problems down into smaller, simpler, logically distinct problems. We do this with coding, and we do it with data models. It’s difficult to manage a data model of over 50 or so tables if there’s no implicit information organization structure, no taxonomy, no data classification system. If you have a plotter-generated ERD diagram showing the tables and relationships, you expect the tables to be grouped into several related subject areas of interrelated business information such as product tables, customer account tables, and sales tables. This doesn’t need to be a physical separation in terms of separate schemas or table spaces. The distinction can be purely logical, though I would recommend tracking the subject area in your data model metadata.
IBM has developed a series of industry specific logical models. In these models, they have broken the data out into nine common, cross-industry subject areas. All the information about people is grouped into one subject area. All the information about products is in another subject area, geographic locations in another, network information in another, and customer account information in another. The concept of subject areas didn’t originate with IBM, but they developed and championed the idea that there are universal subject areas that apply to all industries.

Subject areas are a great technique for taming the chaos of large data models. A large application can easily have hundreds of tables. Treating them as one massive, undifferentiated list is overwhelming. Dividing the tables into subject areas has many advantages:
- It’s far easier for developers and end users to conceptualize the model and find their way around if it’s broken down into a manageably small number of logical groups. When ERD diagrams are printed, these subject areas are usually called out by color – by either placing tables on a colored background, or actually coloring the tables in each subject area. If a user is looking for information, they should be able to walk toward the ERD diagram hung on the wall, and from thirty feet away already begin narrowing their focus to a fraction of the whole based on the subject area groupings. In order to keep things simple, I’ll typically show all the relationship lines within a subject area, but will not show the ones that span multiple subject areas. Cross-subject area relationships tend to refer only to the most important tables in each subject area, and are easy to imply without the lines.
- Subject areas often correspond to data ownership or stewardship. It is much easier to draw the lines around who owns what when the data is already grouped into well-defined areas.
- Input batch files and transactions will typically focus on one subject area. This makes it easy to assign developers, analysts, and testers consistently, allowing them to grow their expertise in one area of the model.
- Subject areas can be treated as loosely coupled, while the tables within a subject area are much more tightly coupled. Developers can use common APIs to insulate one subject area from changes to another. For example, a single API can be used to consistently load party subject area tables with names and addresses and return party key assignments. Changes can be made within one subject area without requiring major retesting of the entire system, so long as the APIs are maintained.
This last advantage is true even in a data warehouse where data is loaded by ETL tools. There will be a point at which one subject area needs to populate its business tables with keys from another table using some sort of lookup. If you implement this as a separate, reusable API, then all the processes that need to populate keys in this manner can reuse it. In fact, if you keep a flag indicating whether the API returned valid keys, you can implement a regularly scheduled process to re-attempt the API call.

Using the health insurance subject areas in Figure 4.12, you should see that a developer loading medical claims into the claims subject area would need to look up the data warehouse keys for the enrollment information from the enrollment subject area, and the provider keys from the provider subject area. The enrollment information may be missing or incomplete, and may later be retroactively added or terminated. If enrollment subject area and provider subject area lookup API services exist, they can be used to consistently look up the keys across subject areas. This enforces consistency, decouples the code for one subject area from the code for another, and allows the key lookup to be treated as a service.
Perhaps you only get updates for national providers once a month, and may not yet have a provider key to assign when a claim is initially received. I would suggest implementing a flag on the calling subject area records. The flag would indicate whether the cross subject area lookup was successful, so that it could be automatically repeated until the keys are found. I usually implement these flags as date fields, initially set to null, then setting them to the date when the API service was called successfully. This way, the scheduled process needs only look for nulls. Any downstream processes that are affected by these enrollment key changes can simply check for the records with the most recent dates. If you used a Y/N flag, the downstream processes would not know which records had been changed, and would have to implement their own flags or codes, requiring additional updates to the business tables.
If you discover an error in any subject area, the resulting changes can be localized to that one subject area; simply refresh other subject areas by setting their API successful dates back to NULL, forcing the lookup to repopulate the keys across subject areas.
If an enhancement within one subject area results in significant changes to the data model, there would be no impact on any code in other subject areas, provided they all used an API, and the API service call and response interfaces were unaffected by the underlying data model changes.
One final reason to decouple your model into subject areas and use API service calls to insulate them from one another is that this makes it possible, down the road, to completely cut out a subject area and replace it with another implementation. For example, you may initially develop your own embedded name and address information, but later have a need to replace it with a third party master data management product. That project will be far simpler if the application was already accessing the name and address information via API calls.
There are many other advantages to using subject areas in both operational and analytical information systems. This is just another example of the larger theme of the functional framework. Grouping IT management detail into areas of similarity that can be managed as a unit is critical to making things simpler, more consistent, more intuitive, and more flexible. This same thinking applies to nearly every IT management function. For EAG program architects, this concept is the closest thing to a hammer that can be used to treat every problem like a nail. Architects should live and breathe the practice of grouping similar things together. They should sort pencils on their desks and group food on their plates. This simple practice has profound effects on how you manage the world around you. I believe that the functional framework is such a powerful tool primarily for just this ability to take a thousand complex tasks and group them into a much smaller number of functions that are similar enough to be managed as a unit.
Data modeling is a great example of the large problem. If I reverse engineer the data repository of a large information system, the modeling tool I use will also attempt to create an ERD diagram. No matter how good a job the tool does of arranging the tables to minimize the crossover of relationship lines, the result will look like someone dropped a plate of spaghetti. The resulting ERD diagram is far too complex to simply and intuitively convey any usable information about the model organization. However, after I spend a few hours separating tables into tiers, and into subject areas within each tier, the complexity is reduced to a handful of concepts that are far easier to understand and manage. That process of simplification by grouping, extended to all of IT, is one of the primary jobs of the architect role.
I recently went through this exercise with data from a third-party commercial application within our corporate infrastructure. My purpose was simply to understand the data model within that operational application, so I could properly extract data from it into the enterprise data warehouse for analysis. However, when I showed the source system application developers my results to confirm my understanding, they just about wet their pants. These developers, who had worked on that application for more than a decade, wanted copies of the organized ERD diagram to post throughout their offices. I don’t pretend to understand the complexity of the business logic within that product, but I do know that you’ll never really understand the business logic until you first truly understand the information on which the logic operates.
The more decisions you can make at a high level:
- The fewer modeling decisions you will need to make project by project
- The more consistent your models will be across the enterprise
- The faster new repositories and enhancements to existing repositories can be spun up
- The more similar your repositories and exchange structures will be across the enterprise
We’ve talked about “zones” of data (internal, operational, analytical, reference data, etc.). We’ve talked about “tiers of data” within a zone (i.e. the staging, transform, distribution, and access tiers in a warehouse). Now let’s extend our process of grouping similar things to the description of “types” within a tier.
Business tables in the distribution tier, for example, might include the following types:
- Transactional business tables that are inserted once, possibly with update segments that are updated from a default value to a transactional value only one time
- Transactional golden copy business tables which pick the best transaction (usually the latest one) to represent the current state of a business entity
- Merged golden copy business tables which merge data from many different records into one representation of the business entity
- Snapshot business tables showing the state of a business entity at multiple points in time; not ranges in time, but as of actual calendar dates
Reference tables might break down into several distinct types as well:
- Global reference tables, where there is a single code set that every application uses
- Translate reference tables, where application specific values must be translated to one or more enterprise-wide code sets
- Ralph Kimball was famous for grouping reference tables based on how the data in them changed over time (Type 1, 2 and 3 slowly changing dimensions)
You’ll always need room for exceptions, but as far as possible, you should have guidelines for every “type” of table you have. These should not be decisions a modeler has to make with every model change.
There are many other common types of business and reference tables, and you no doubt have some unique table types of your own. These are types of tables – classes of tables that can and should be managed similarly. Define the types at a high level, and create policies and standards for each type of data for things like:
- How the tables are modeled including table and field naming standards for each table type
- How the tables are audited including how and where are changes tracked
- How sensitive data in the tables is secured
- How the tables are backed up and recovered, and how data is archived and aged out of the repository
- How standards for data quality apply to each table, including referential integrity and tracking of raw input before cleansing
- How is the data tested in lower environments
Creating and enforcing standards for groups of similar data is the key to simplifying information lifecycle functions.
Data modeling is the first function in the information lifecycle. To be an effective part of a framework of IT functions, the data model must include integration points with other functions. Some examples include:
- The data model must reflect data security function requirements. These might require you, for instance, to log every action that adds, changes, or deletes data. These requirements often require the addition of user ids or batch numbers, time stamps, and a history of changes over time. They will require you to identify sensitive data, which will be far easier if you have an enterprise logical data model mapped to well-documented application models.
- The data model must reflect the data quality function requirements, such as enforcing referential integrity and retaining the original source system value for transformed data.
- The data model must reflect the information end-of-life function requirements. The proper data elements must exist to be able to identify when data has outlived its value and should be deleted. It should also identify and not delete any information that is a part of ongoing litigation.
You can’t perform data modeling at the enterprise level just by winging it. You need a system. You need an enterprise-level vision for modeling information assets that is reduced to the essential components. You need a process that ensures all the integration points with other IT functions are taken into account. A functional framework can help you put all that together, and manage information assets effectively for the business.
Consuming information
As Bob Dylan was known to say, “The times, they are a-changing.” Visionary poet and songwriter, or visionary information architect? I wonder.
You will always need to consume data both on a transactional basis and via batch transmissions. I’m sure you are doing that well enough today or you wouldn’t still be in business. In the context of this book, you need to be preparing your corporate infrastructure for a paradigm shift in the way we handle information. The way we have consumed information in the past is simply not going to suffice. Information is increasing in volume, variety, veracity, and velocity: the four V’s. All four are driving information architecture toward a loosely coupled infrastructure of services.
Data volume is increasing. According to Forbes21 (September 2015), more data has been created in the past two years than in the entire previous history of the human race, and by the year 2020, about 1.7 megabytes of new information will be created every second for every human being on the planet.
Gone are the days when you could create your own local copy of all the data you needed. Storage aside, there are some types of data you can’t possibly copy to a local repository as fast as it is created. Even where it is possible, local replication usually isn’t desirable . Increasingly, both operational and analytical applications are going to have to rely on getting data as needed from external sources via services. Companies such as credit bureaus and retail demographics vendors now push clients toward services-oriented access to their data rather than batch downloads. If a health insurance company needs to know information about a provider requesting to join their network, they can now easily access that provider’s specialty certifications, licenses, malpractice information, and more, all with a simple service call, without bothering to download huge databases, manage them locally, and try to keep them current. Information is an asset that companies buy, sell, and trade via services.
Amazon Web Services and the Google API are the shape of the future. Nearly every major information vendor offers access to their information as a transactional service these days. You will need to consider a future where you participate in this kind of distributed infrastructure. It might include accessing data services exposed by other companies, and it might include exposing your own data as a service in return. There are certainly serious security and privacy concerns, intellectual property concerns, performance and availability concerns, auditing concerns, and concerns about how the revenue model of buying and selling data on a transactional basis would work. Nevertheless, the day is coming where your operational information system software is accessing data via services, some of which are hosted by external vendors. Your company’s EAG program should be planning for that future vision, and perhaps experimenting with a low-risk pilot now to work through these concerns. You might consider starting with the US Postal Service API for address cleansing at the point of data entry, or a credit bureau API for making more informed loan origination decisions.
Distributed analytical processing is a bit farther way. Security and other concerns aside, we have the technology today to access remote services one transaction at a time. What we don’t have is a generally accepted solution for performing analytics over large, globally distributed data sources via services.
I believe one of the big hurdles modern business faces before they can implement a truly distributed infrastructure is the development of a robust, distributed analytical query tool. There are certainly federated query tools, but most of them work by first collecting all the distributed data into one local repository. Imagine a day when different companies offer up various proprietary “tables” to the web. If you develop an application to run on your hosted app server, that application can join large numbers of records in your local customer data with address information hosted by the USPS and Census Bureau, with retail demographics hosted by Acxiom, or with inventory data hosted by your supplier – all in a single SQL query without transporting entire data sets across the network to a central location for processing.
This service would need to be able to create a distributed query plan that performs as much of the work locally on each hosted data source as possible, resulting in an absolute minimum of interim results transferred from host to host. There would have to be a way for each site to expose its metadata in a consistent way in order to build the query plan. The same set of distributed analytic services would have to be supported by each host. There would need to be a way to manage distributed security, both to prevent access to unauthorized data, and to prevent unauthorized monitoring of confidential queries. There would have to be some agreed-upon means of keeping track of resource usage, buying and selling all this processing and information. Those are a lot of gaps to fill.
But don’t you believe that day is coming? Do you really think it’s more than a decade away? Imagine how that will transform the way we build IT infrastructure. Imagine how this will separate those businesses that are prepared from those who aren’t. This is going to be like an asteroid destroying the dinosaurs who aren’t equipped to compete with those quick little warm-blooded primates.
You and I probably aren’t going to be the ones to develop that application. However, we can start questioning the degree to which the infrastructure we are building is based on a scalable, service-oriented, loosely coupled, cloud-friendly architecture. That vision has to span every IT function in your functional framework.
Data variety is also going to be a challenge. Cisco reported22 that in 2012, there were 8.7 billion objects connected to the web, consisting of about 0.6% of the things in the world. By 2013, driven by the falling cost of technology, this number exceeded 10 billion devices. Cisco predicts that the number of connected devices will reach 50 billion by 2020, meaning that 2.7% of the things in the world will be connected to the web.
As the network edge continues to disappear, your back-end servers and applications will go into the cloud, your front-end input and display devices will go mobile, and many of your event sources will be devices out in the web. Wearable medical monitoring devices, internet enabled utilities and appliances – every single aspect of your life will be filled with sensors collecting all manner of data. You’re going to need to be able to stream these disparate data sources into your environment as the data is created, in real time, via services.
Working in the health insurance industry now, I see a large number of home health connected devices on the market. Talking about this with our medical informatics experts, I was surprised to find that one of the most valuable connected home health devices is a simple bathroom scale. One of the single highest predictors of a dangerous complication following heart surgery is rapid weight gain accompanied by swelling and pressure. This can happen when water is retained in the tissues surrounding the heart. If this can be detected early, the critical care team can intervene and very likely save a life.
I mentioned earlier that 34 states now provide guidelines for telemedicine, where a doctor visit consists of the doctor in his office, and you in your home, connected by streaming video and various home health sensors. Manufacturers of mobile phones are rushing to partner with devices and apps that will enable these interactions.
This is happening in every industry. My car can provide streaming diagnostics that compare to airline black boxes from the not too distant past. My car keys have a sensor to help me locate them if lost. Refrigerators have built in sensors to assist with shopping. Retail stores can track my location in real time and message me special offers. If I order a product shipped to me, I can track its progress online. I can even order food from my favorite restaurant online, pay for it with a transaction from my financial institution, have it delivered by a third service, and track the delivery vehicle all the way to my door through GPS-enabled streaming data.
But in order for your company to participate in this interconnected future, your corporate infrastructure is going to need to be able to accept all of those different kinds of streaming data and integrate them into your business processes. Your data model and your processes are going to have to be flexible enough to accommodate data from many different sources in many different formats.
This distributed internet of things leads to data veracity. How are you going to authenticate the sources of all this distributed information? While this is a significant concern, it’s more appropriate for the hardware domain.
Data velocity clearly accompanies these streaming data services. If the volume of data is growing rapidly, and the sources are outside of your private network and are streaming data via small transactional services, you’re going to need an infrastructure designed to scale to very large service transaction volumes.
If you want to design an information infrastructure that’s going to serve your company in the years to come, you need a strategy that includes a robust, scalable infrastructure for data services. You may not pass data as services much today, but that’s going to change rapidly. How are you going to model those services? Where are you going to expose the catalog of available services? How are you going to create and communicate your enterprise standards for data services? How are you going to integrate and translate services from different sources, using different protocols, to enterprise standards compatible with your ELDM?
This can’t be done project by project. It’s going to have to be an enterprise-level architectural initiative. Do your homework. Come up with a strategic vision and roadmap. Watch business-sponsored projects for opportunities to take steps toward your target architecture while providing real business value. You need to get ahead of this!
Enhancing information
You’ll have noticed by now that this book is quite data-centric. There are several reasons for that.
My first vehicle was my grandfather’s 64 Chevy truck. Manual transmission, manual choke, no seatbelts, no rear-view mirror, no AC, it had an AM radio, but no FM. The bed was made of wood. When you popped the hood, half the front of the truck swung up, revealing… about six moving parts. It wasn’t that hard to learn about cars in those days – there wasn’t much to them. To work on the engine, you literally climbed up in the engine compartment and sat inside. These days you can hardly reach your hand down in an engine for all the maze of hoses and wires. It’s no wonder that kids don’t grow up working on their cars the way my generation did.
I graduated from Duke University in 1986 with a degree in computer science. Back then, if you were the computer guy, you did everything. You ran the network cables through the ceiling; you installed and configured commercial software; you set up the printers and configured the workstations to use them; and you were the developer for any kind of software that was needed. I’ve built several machines from parts and soldered together my own boards to go in them. We used to develop software in assembly language, with very little between the developer and the internal workings of the CPU. We would burn code on EPROM chips that we installed directly on the motherboards so that we could pull the hard disk, floppy disk, and the keyboard and monitor to make a black box appliance. I’m not bragging at all. This wasn’t unusual at all back in 80’s. It was possible, even expected, that you knew everything about computers. However, like my old ‘64 Chevy, somewhere along the line, things got complicated.
These days, kids joining the ranks of IT professionals must pick a specialty. It’s just not possible to understand everything any more. There’s too much, and it changes too fast. Along the way, some of us stuck with technology. Some became software administrators. Some of us became software developers. I stuck with data. I’ve always been a data person, and this book will reflect that bias without apology.
However, this data focus also reflects the state of the IT industry today. Informatica recently coined the term “Data 3.0” to reflect the fact that data has now moved to the center of the enterprise, ahead of the hardware and software focus of recent years.23 Data isn’t something buried within an application (Data 1.0) or in an enterprise analytical repository slung somewhere beneath the operational applications (Data 2.0). No, information has taken center stage. We have, over the years, developed solid best practices for managing enterprise hardware and software, but managing enterprise data as an asset independent of hardware and software is a relatively new thing, and a thing most of us aren’t doing all that well. The increasing importance of data to your enterprise, combined with the relative lack of guidance regarding how to manage this asset has resulted in IT organizations across the world failing to manage the IT complexity of information assets on behalf of the business.
In a pure operational system, all the information is raw data. Contextual data and knowledge are technically analytical in nature, not operational. That said, most of the systems we think of as operational, the ones that run our core business processes, typically have a good bit of analytics built in.
Adding contextual data
In the information pyramid discussed earlier (Figure 4.4, page 101), the base of the pyramid is the raw operational data. This is the data created and maintained by your operational systems to run the core processes. The next layer of information is the contextual data we gather to append to the raw data. We often, for example, purchase contextual data from companies that specialize in retail demographics: what magazines people subscribe to, their education level, and what kind of cars they drive. This is increasingly valuable information for your business. Why?
Consider this. It’s relatively easy to determine how profitable each customer is. You already know how much they cost you, both directly and in allocated expenses, and you know how much money you made on them. What you don’t know is how profitable the next person to walk through your doors is going to be.
You don’t have transactional, operational history on your prospects. However, you can purchase their demographic data. If you can find correlations between your profitable customers and some data that is available for people who are not your customers, then you can predict prospect profitability.
Say you purchase some demographic information on your customer base and turn it over to your statisticians. After doing some analysis, they determine that for product A, your most profitable customers live on the west side of town, own their own homes, drive SUVs, and have two incomes. Closely behind that in profitability are resident college students who attend schools in your sales area but come from homes out of state. In these cases, they often incur lots of fees, but their parents keep them paid off. The statisticians found these correlations using one set of your data and used it to successfully predict profitability on a control group of your customers who weren’t part of the original analysis.
You can then use this information to go back to your retail demographics company and ask to purchase the names and addresses of people in your sales area who live on the west side of town, own their own homes, drive SUV’s and have two incomes. And you can purchase contact information for resident students in your area with out-of-state home addresses. You can now invest targeted marketing dollars for product A pursuing prospects that you’re sure will look very much like your most profitable customers. You’ll probably find that different product lines have very different profitability models. You’ll find that some customers who are currently unprofitable on the product they have look like they would be very profitable on another product. You don’t necessarily want to get rid of unprofitable customers – you may just need to steer them toward a different product offering.
The reason why this kind of contextual information is so valuable is because it’s closely associated with customer lifestyle. It is often called behavioral data. You would be astounded at the breadth of behavioral data available for purchase. Does your grocery store give away those barcode fobs that can be scanned at checkout for significant discounts? The reason they can afford to do that is that they use that information for predictive modeling, and they sell it to companies that aggregate and resell demographic data. That’s how a bank can purchase information about what kind of cereal you eat for breakfast, if they think it will be predictive.
You may have heard about Target, the retail giant who made national headlines for one of their predictive models. It seems that two of Target’s most profitable product lines are diapers and baby formula. Unfortunately for Target, most new mothers tend to stick with the brand they first use. It’s very difficult to get these women to switch to the Target brand once the child has arrived.
Therefore, the statisticians at Target used their own sales data to predict pregnancy. Yes, you read that correctly. They were able to look back through sales history, tracking people’s purchases, especially those who eventually started buying diapers and baby formula. Using this data, they developed a model that very accurately predicted third trimester pregnancy, based purely on product purchases. They’ve been pretty closed-mouthed about the actual model, but rumor has it the model included variables for bulk wet-wipes and paper towels. Apparently, there’s something to this nesting instinct thing. Target would then focus their advertising efforts, with high-value coupons and free samples, to encourage these women to be considering Target’s brand well before their delivery and first actual purchase!
That prediction is impressive enough, but not the reason they made national headlines. Apparently, one day a gentleman entered his local Target and asked to speak to the store manager. He proceeded to ask the manager to please stop encouraging his teenage daughter to have a child. He was very concerned about all the mail the young girl was receiving depicting how wonderful her life would be with a little baby to care for. He considered this irresponsible on Target’s part and asked to have the girl removed from their marketing lists, which they promptly did.
A month or so later, the father came back to the store to apologize. Apparently, Target had predicted his daughter’s pregnancy long before her father was told.
You can see the value of contextual data to the business, and to fathers. There are many kinds of contextual data such as behavioral demographics, psychographic data, and genetic data. All of it provides additional context to your raw operational data. This combination of your raw operational data and the contextual data helps you understand what’s going on in the real world, allowing you to predict what will happen in the future.
From an IT standpoint, how do you manage this contextual data on behalf of the business?
- First, you need to get your raw data in shape. Since you want the data from all across the enterprise pulled together and conformed, and since the statistical analysis is an analytical process, this process will typically take place in your enterprise data warehouse. You will need to invest in the infrastructure and processes to set up this data, as discussed earlier in the information modeling function (page 119).
- Next, you’ll have to decide on some business goals. Increase profitability? Grow subscribership? Get into a new market? These aren’t IT decisions, and should instead come from the highest levels of the business. Typically, the corporate executives will set a handful of corporate goals for each year – the things they want the company to focus on in the next year. The departmental business VPs will decide the specific details of how their area of responsibility will support the corporate goals.
- Then decide which data elements are likely to be predictive. This deserves careful thought. I once worked with a bank in Chicago who purchased information on every one of their customers regarding whether they owned their own home and whether it had a fence. That seemed like an odd thing for a bank to be interested in, but they combined this with a few other raw and contextual data elements to generate a marketing campaign for pre-approved low-interest swimming pool loans. You see, in their area, by law, if you have a swimming pool, you must have a fence around it to prevent neighborhood children from wandering in and coming to harm. The cost of a pool was much more attractive to consumers if it didn’t include the overhead of installing a fence. Marketing swimming pool loans only to people who owned homes with fences produced a much higher acceptance rate for the bank’s marketing dollar.
- Purchase and import the contextual data into your analytical repository. Be careful to model this data in a way that it is identifiable, usually in separate tables. Most of the vendors of this information license the data for a limited time, and for a limited scope. You will not, for example, typically be able to pass the data on to your customers. They would have to license the data independently. When your contract expires, you will need to be able to easily remove the data from your repository. These contractual constraints will require careful consideration in your data model.
- Once the data is brought into the distribution tier of your enterprise warehouse, you’ll need to generate a statistically modeled data mart as a sandbox for your statisticians .
Adding knowledge
Knowledge is distinguished from contextual data in that it isn’t simply the acquisition of additional data. Instead, it is a layer of information derived from your raw and contextual data.
To be clear, knowledge is information, not statistical analysis. Statistical analysis, discussed later, is the process of building, testing, and refining the models, decision trees, and business logic necessary to create knowledge. Knowledge is the operational result of that analytics. The expression “data-rich but information-poor” refers to organizations that have not established the critical components needed to transform their data into actionable insights.
A few examples of this kind of actionable knowledge are listed below. There are many others, including master data management (page 172) and customer segmentation (page 147).
Predictive analytics generate business logic. This analysis will take raw data, contextual data, and other knowledge, and produce a score representing the likelihood of a future event. Predictive models may score customers on likelihood to churn (leave your company). They may score transactions on likelihood of being fraudulent activity. They may score the likelihood of a certain customer to purchase a certain product. They may score the risk of an insured member to develop a given health condition.
The actual production of the predictive modeling business logic is the analytics function, which IT must support on behalf of the business. But once a predictive model is accepted as valid, IT will likely be asked to “operationalize” that business logic and store the resulting scores. These scores are the knowledge; producing the predictive model is the analytics.
The software used to create the model is seldom the same as the software used to operationalize it. A data scientist may use statistical analysis software in a lengthy, complex process using massive amounts of computational resources before arriving at a model that seems to work. The model, in the end, may be a simple calculation based solely on one or two predictive variable. The likelihood-of-fraud score on a credit card transaction might be as simple as “three times the transaction amount squared plus one third the distance in miles from the last transaction.” Totally made that up, but regression models produce exactly that sort of formula.
Regression models like this result in a formula where you simply plug in the variables. Though hard to create, they are very easy to implement, turning your raw and contextual data into knowledge. Other types of models are much harder to operationalize. Neural nets, for example, are notorious for being almost as difficult to score each night as the model was to create in the first place. We try to avoid techniques like this, if possible, due to the problems of operationalizing them.
However, sometimes the best model is one of these difficult-to-implement techniques. If the business value outweighs the cost of implementation, then you implement it. IT exists to support the business.
Fortunately, neural nets are considered risky even by data scientists, because they’re black boxes. With other techniques, you can examine the resulting formula and see how it might make sense, but with neural nets, the inner workings are non-intuitive. There’s a story of a neural net model that was trained by the military to score the likelihood of artillery being present on a satellite photo. They showed the engine many photos of an area with no artillery present. The next day they rolled a bunch of tanks into the area and took another set of pictures. The neural net began to produce extremely accurate scores regarding whether each photo it was shown contained a tank or not. Fortunately, the analysts did some more testing, which the algorithm completely failed. It turns out that the first day (without tanks) was quite sunny, and the second day (with tanks) was overcast. Unbeknownst to the analysts, what they had modeled was an algorithm to predict the presence of cloud cover in a satellite photo, not the presence of artillery. This turned out not to be nearly as useful.
Another class of knowledge isn’t a prediction of the future, but rather an analysis of the most effective thing you can do today to change that future prediction. You may want to lower the predicted risk of future churn, or you might want to raise the predicted score of the likelihood of a future product purchase.
Predictive models predict what will happen. Treatment effectiveness scores predict the most effective thing to do about it.
This is actually much more complicated than you might think. Different customers may churn for different reasons, in which case the best prevention treatment will likely be different for each. The most effective thing you can do to provide product sales lift will differ by customer and by product.
These treatment effectiveness models are useful in every industry, but are of particular interest in the healthcare industry, where they’re known as evidence-based practices. Imagine the value of an analytical model that scored the most effective cancer treatment for a given individual!
Analyzing information
In Dustin Hoffman’s breakthrough movie, The Graduate, a self-righteous Los Angeles businessman takes aside the baby-faced Benjamin Braddock, played by Hoffman, and declares, “I just want to say one word to you – just one word – ‘plastics.’” That movie came out in 1967. In 2009, the New York Times printed an article titled, For Today’s Graduate, Just One Word: Statistics.
Analyzing information is critical to the business. This book isn’t a treatise on how to analyze data. Rather, we want to discuss how IT can best support the business function of analyzing data as part of an enterprise-level information management program.
Supporting data analytics mostly involves IT functions discussed elsewhere. You have to collect the raw operational data from across the enterprise, make sure it conforms to format and quality standards, append relevant contextual data, and create a statistical model. From the IT side, that’ll cover most of what you need to do.
One thing that must be added, however, is hardened process.
The term DevOps was introduced in 2008 to describe the operational nature of software development; how it flows through several states which differ from one methodology to another, but all include a cycle of continual feedback and improvement. The term DataOps was introduced in 2015 to describe the application of DevOps and continuous delivery principles to improve the data quality and reduce the cycle time of data analytics.24 It includes the statistical process control common to lean manufacturing techniques, meaning that it is automated and monitored for measurable data quality and business value that drives continual process improvement.
Supporting the analytics functions of the business doesn’t mean that IT takes over all the analysis. It means that IT is providing a solid platform to support the analytics done by the business. IT may well use analytics internally to improve IT processes like data quality, but analytics is a primarily business function that IT supports.
Granted, the results of business analytics (which can include fraud models, churn risk scores, profitability scores, next-product-to-buy predictions, and customer segmentation) are almost always given to IT to support as the knowledge generation portion of the data enhancement functions mentioned earlier. But those knowledge-creating processes aren’t business analytics; they are the results of analytics. True analysis is the discovery, validation, and improvement of the models used to generate all that knowledge. That discovery, validation, and continual improvement all require information, information IT must make available to the business in the manner the analytical tools need.
Information analytics is critical to your business. If your IT department isn’t supporting this business function, you are not doing a good job of supporting your business. Make sure there is an analytics function on the information lifecycle of your functional framework, where it will receive the visibility necessary to generate the long term strategies, roadmaps, policies, standards, processes and roles that it deserves.
Delivering information
So far in our information lifecycle, we’ve been talking mostly about the IT functions and information infrastructure necessary to bring information into a repository and enhance it. These are functions IT needs to perform for the business, but the end goal isn’t to simply collect and store information. The end goal is to deliver information where it can be used – the right information to the right place at the right time. This is the information delivery function, and it’s a much more complex function to manage than you might imagine. Think of your IT infrastructure as a restaurant, with a front-of-the-house and a back-of-the-house. You can’t run a restaurant without the kitchen, but that isn’t the part your customers interact with. The part you see, the whole point of a restaurant, is the front of the house where your customers consume the food created in the kitchen.
A pure operational application exists only to maintain data. The only data presentation it includes is to display a record for potential maintenance. However, very few applications are purely operational. Most applications include some sort of data reporting functionality. Analytical applications such as data marts and data warehouses are very focused on data delivery.
Data delivery covers quite a broad array of functionality. As with everything else, this complexity is easier to manage if you combine the details into similar groups. I like to break down information delivery into business intelligence and decision support.
- Business Intelligence (BI) is delivering information so that the recipient can make decisions, and includes:
- Executive dashboards
- Middle management data discovery and mining
- Front line operational reports
- Power user ad-hoc query
- Application interfaces, such as extract files and data web services
- Decision support is delivering already-made decisions to the recipient, and includes:
- Campaign management
- Real time decisions
So you see, at the highest level, I have grouped the data delivery functions into those that deliver information, and those that deliver decisions. You can divide your data delivery functions however you see fit, but this is what works for me.
This outline may appear to be a listing of applications, but here, in the data domain, our primary intention is to discuss the information that supports the applications. We’ll only wander over into discussion of the applications themselves to the extent necessary to understand the information we are delivering. Evaluating, purchasing, configuring, and maintaining these software products will fall under the application domain.
Business intelligence solutions (delivering data)
Business intelligence (BI) solutions deliver information. The information can take many forms, and the recipient can use the information in many different ways. Decisions will be made using the data, but the data itself is not a decision.
Executive dashboards
Executive dashboards, including balanced scorecards and key performance indicators, are graphical user interfaces that display key business metrics at a glance. The use of the word dashboard is intentional; this is a place where that the driver (of the company, as it were) can glance down, see all the important information, and then return their eyes to the road. These tools aren’t mean to contain grids full of data that the executives pore over for hours.
The biggest factor to consider when spinning up executive dashboards will be whether to use a best of breed data visualization product, or whether to purchase an integrated suite of products. Both make sense under different conditions, but I find that the decision between these two is often made for the wrong reason.
The advantage of a best-of-breed solution is that it is faster and easier to implement and has the best visualization options. However, that comes at a cost of being a niche solution. If the executive ever wants to click on part of the dashboard and drill down and down into more and more detail, the solution may not deliver or be pushed to its limits. Drilling down into fine detail is possible, but it isn’t fast or easy to develop, and it’s not what the tool was designed for. Typically, these drill paths are not reusable, and are not high performance.
An integrated suite of business intelligence tools won’t have all the bells and whistles of the best of breed, and the initial dashboard development may take a quite a bit more time and expertise. Regardless, these suites of products are all based on the same underlying metadata platform, so that drilling from a dashboard to an operational report is seamless and leverages reusable components.
Said another way, best-of-breed solutions provide value quickly, but as scope increases and more functionality is demanded, there is more and more custom development and the return on investment decreases. The integrated suite solution requires a lot of investment up front, making it very slow to provide initial value, but that value accelerates over time as the infrastructure tying the various products in the suite together is completed, so the return on investment increases over time.
Either approach may be correct under different circumstances. Ideally, the executives shouldn’t be drilling through to detail. They should be glancing at the dashboard for a second and returning their eyes to the road. If you have executives who can avoid the temptation to mine the data, a best-of-breed solution is far faster and cheaper to implement and yields prettier results. If you’re offering the dashboards to a captive audience in a business intelligence solution that you can control, best-of-breed makes sense. However, if your target audience has the curiosity and power to demand drill-through into detail, you’re probably better off going with an integrated suite of BI tools.
Unfortunately, that’s seldom how we actually make the choice between these two approaches. Typically, if the business is in charge of making the decision or is frustrated with the service they are getting from IT and decide to build out their own solution, they will go with the best-of-breed. It’s fast, simple, cheap, and pretty. The business typically isn’t focused on the long-term strategy for the software infrastructure. They just want a business solution.
On the other hand, if IT is in charge, they will typically choose the suite of products, due to the ease of integration and support. While the integrated suites take more time and IT expertise to initially set up, that’s usually not the problem. The problem, more often than not, is that IT sets up these suites without involving the business. The solution becomes an internal IT science project rather than a business solution. In my experience, the reason for the poor track record of the integrated reporting solution approach has nothing to do with the tool itself, and everything to do with the way the project was managed.
Best-of-breed solutions succeed because they are designed by the business to meet the business needs. Integrated suite solutions often fail because they’re designed by IT and do not meet the business need. Using a best-of-breed approach carries the risk that you’ll be asked to grow the solution in ways that the infrastructure does not support. Using an integrated suite approach carries the risk that you’ll spend a lot of time and a lot of money and end up with something that doesn’t meet the business need because the business wasn’t integrated into the project from the beginning.
Middle management data discovery and mining
This is the kind of reporting where we use data discovery. Executives don’t have the time or the job role to be playing with the data all day long. Front line managers need to run their operational reports and get back to their assigned jobs. It’s the middle managers whose job role it is to have their finger on the heartbeat of the data, looking for trends and anomalies, mining the information to discover things we don’t already know.
Typically, the toolset used for this uses a hierarchical, slice-and-dice, pivot-table reporting technique called cube viewing. These are typically built over dimensional models, with the ability to swap different dimensions in and out, drill up and down dimensional hierarchies, and look at different measures all on the fly, all without writing new reports. These tools are generally referred to as ROLAP if they store their data in relational database tables, and MOLAP if they build an external, proprietary file called a micro-cube (R for relational, M for micro-cube; ROLAP and MOLAP). There are other forms of data discover tools, but these MOLAP and ROLAP cube-viewing tools are by far the most widespread.
Whatever your reporting solution is, at least 80 percent of new report development requests should be self-serve25. If every new report has to go through IT for development, then IT will always be a bottleneck to the business. The point of this book is to manage IT complexity on behalf of the business. The business needs a self-serve solution. A self-service solution still requires support – it is not self-sufficient. But that support is decoupled from the end user. Most of the effort is supporting the solution, and very little effort is needed to support the actual business user.
One of the easiest ways to provide self-serve is to create one or more vetted ROLAP or MOLAP cubes where the business can slice and dice all the most common measures on all the common grouping attributes such as customer, location, product, and time. Then create a handful of general-purpose detail reports for middle managers, allowing them to drill through from anywhere in the cube. Using a cube helps ensure correct assembly of data. Using a handful of detailed drill-through reports on top of this is a great substitution for writing hundreds of separate reports. If you think about it, most business reports are either aggregate counts and amounts against various combinations of filters and groupings, or are detailed rows that meet certain filtering conditions. With the cube, you can pre-create all the allowable filters and hierarchies as dimensions and show the aggregate sums and counts (measures) at any level and combination. Then, using this result as a filter, allow a drill through to pull the associated customer detail, product detail, and sales detail. Typically, the cube is in the access tier, and the detail reports run against the distribution tier. A good initial list of detailed drill-through reports is a one-line-per-item and a one-page-per-item report for the major concept in each subject area.
This is where the value of having an integrated suite of products really shines. In an integrated suite of tools, you don’t have to put all the detail in your cube-viewing solution. That would make extremely large, poor performing cubes that contain a great deal of information unrelated to slicing and dicing. Are you really ever going to slice and dice on a person’s middle initial? Likewise, using this approach, if you need to add more detail, you have to redesign and rebuild your entire reporting solution. The cube should only include the measures you’re aggregating and the dimensional attributes you’re using to sort and filter. Everything else is poor architecture, slowing down your performance.
An integrated solution will allow you to dynamically slice and dice your counts and amounts in the cube using any combination of filters and hierarchies you have built into the solution, until you discover something interesting, then, without writing all the filters down, signing out of that tool, and signing on to an operational reporting tool, you can just right click, select one of any number of detail operational reports, and “drill through” to that report, carrying all the current filtering with you automatically. The detail report runs with the same filter that you were using at the point you left the cube. Both the cube viewing tool and the operational reporting tool all use the same metadata infrastructure, and drill seamlessly back and forth. Even the dashboarding tool runs on this same infrastructure, and can drill through to operational reports or cubes.
Consider this example: An executive glances at their dashboard of KPIs, and notices that the sales metric is now in yellow, frowny-face status. They right-click on the graphic, and drill through to a cube view that shows, perhaps, sales by date and channel. This view clearly shows lower than expected numbers for this month for the direct sales channel. The executive drills down (expands) the direct sales channel and finds that the problem is in the corporate agent channel, and another drill down reveals that the particular problem lies with Bob Smith. The executive can then right click on this month’s numbers for Bob, and select to drill through to a detail listing report showing detail information about Bob’s sales for this month. On that screen, the executive sees a massive return of products originally sold to ACME corp. The integrated suite of tools allows you to connect the dots between many applications, seamlessly integrating them into one business solution.
Not all enterprise reporting tool suites have this level of integration. Virtually every vendor in this space has built part of their portfolio through acquisitions; the application integration may not be smooth. You’ll need to check carefully whether the vendors you’re looking at support drill through. Not drill up and down a hierarchy, but actually drill through to another report, passing the filters along automatically.
One of the nice features of the cube-viewing products is that you don’t actually have to start at the top of the cube every time you enter. If you slice and dice and drill down to, say, a location in the cube showing some rolling year-over-year product sales by region and state on the left, and product line across the top, with color coding for significant gains and losses, you can save that combination as an entry-point, giving it a “report” name. Next month, instead of starting at the top of the cube and performing that slice and dice again, you can just “enter” the cube at the position you saved, viewing the same information with updated data.
This is a very powerful technique that can be used to provide self-service reporting to middle management, who are typically the largest segment of new report requests. You don’t expect an executive to be writing reports or dashboards. The front-line managers would love to play with the data, but you want to prevent that and keep them focused on their assigned task, giving them just the information they need to perform their job. Power users only need a reporting tool – they’ll write their own reports without your help. Those internal and external middle managers are the users who most need a self-serve reporting solution. If you want to serve your business well, don’t design an infrastructure where IT is going to be a bottleneck. Your strategic vision for information delivery should include self-serve reporting solutions.
Front line operational reporting
The front-line resources would love to have pretty dashboards, and would spend all day playing with reporting cubes, but you don’t want them doing that. You want to provide them the information they need to do their jobs; a list of loans to process, a list of high-risk patients to call, a list of sales targets they need to meet. Give them exactly what they need in a canned report to keep them focused on their daily assignment, without providing overhead or distractions. Analysis doesn’t fall to these front-line managers; they perform the detailed tasks that keep the company running.
Most front line operational reports don’t differ too much from the fan-fold green-bar printouts of my early years. These reports tend to contain detailed, rather than summary information. The data is quite often served from operational systems, or an operationally-modeled distribution tier of an analytical system, rather than from analytically-modeled data. Audit and compliance reports are often generated as detailed, row-oriented reports.
It’s very important, of course, that the different business intelligence solutions, the dashboards, cubes, and operational reports, are all based on the same underlying data, giving the same answers, no matter which tool is used. This is especially important for calculated fields such as net sales. Does that include rentals? Does it include replacements for damaged equipment? By building your entire reporting suite over one consistent infrastructure level, you can ensure that everyone is interpreting business requests consistently throughout the enterprise.
Power user ad-hoc query
In every company, you’re going to have those special few power users who just need to get in, get their hands on the raw data, and do what needs to be done. You want to provide a solution that removes any impediment to them doing their work. These information assets belong to the business, not to IT; don’t put up unnecessary walls between the business and their information.
I once installed a data warehouse product at a company whose internal departments were set up on a cost center model, where each business unit charged for its services and was required to demonstrate profitability. The enterprise data warehouse department, in an effort to remain profitable, required all other departments to submit report requests to them, rather than access the data directly. While the technological solution was very impressive, the business model made the unit very ineffective at meeting business needs, especially the needs of the power users who needed direct access to the data.
For these power users, the work will be unpredictable; different every day. Some days they’ll be doing research for legal, other days they’ll be working on a special project for the VP, and other times they will be researching a data anomaly. If their work is the same every day, they aren’t a power user; they are a front line operational resource.
These power users typically have very broad security access and know the data better than anyone else in the company, including you. You know who these people are, and you know that if the workforce were ever cut drastically, these would be the last people standing. They are that valuable to the business. Make sure that your data delivery functions include the tools these special people need to do their jobs. Remember how valuable they are to the business. If one of you has to go, it’s not going to be them!
Application extracts
Make sure your data delivery strategy contains the infrastructure necessary to deliver file extracts to both internal and external destinations. The data model, service level agreements, and security concerns are just as important for these extracts as for traditional reports, even though applications rather than people will probably consume these files.
Typically, extracts are at a detail level, not summary information. Usually, detail information is best served by an operational or normalized model rather than an analytical one. However, there are reasons why you might want to create a data mart for application extracts anyway:
- The extracts may need to be point in time, periodic data, such as monthly snapshots after each month’s books are closed. Unless you can guarantee all your extracts will run before the first transaction in the next period occurs, you may want to create a static area from which to extract data.
- You may wish to stage your extracts into tables that reflect the extract format in your repository, so that you have them readily available for query and analysis. If there is a problem with a file you generate, you don’t have to load it; you already have it in a table.
- Ideally, you will be able to mandate “standard” extracts rather than dozens of similar, but different extracts. If you can manage this, then you may want to dump the data into a generic extract area first, so that you can reuse it many times, pulling the subset of records needed for each specific extract. This way, you really only manage one set of extract logic. Corrections and enhancements are much less complicated with this infrastructure.
The approach just described uses a modeling technique of simply building the data for each extract in table form for retention, reuse, and extract analysis. You may be asked to build some more general tables that are not extracts themselves, but sources from which extracts can be taken. This is normally a poor idea, because extracts are at a detail level and are best served by an operational model. It doesn’t make much sense to take data from one operational model and put it in another operational model just for the extracts. That second model may be a small subset at first, but it will inevitably grow over time, and become essentially a copy of the first operational model. End users will begin using it for purposes other than extracting data, and will begin asking for modifications and enhancements to suit their needs. Just say no.
If you do create a data mart specifically for file extracts, you should limit it to file extract functions. Other kinds of data delivery are better served with different modeling techniques.
Data as a Service (DaaS)
One objective of the information domain is to define a system of record for every data element, and to access that source whenever possible. You do not serve the business well by making multiple copies of the data and sending them all over the company. This practice:
- Ties up the network bandwidth
- Consumes Direct-Access Storage Device (DASD) and other resources
- Makes it inevitable that different copies will be out of sync and yield different results to the same questions
- Requires many different developers in many different departments to write many different access interfaces, inevitably with different logic
- Exposes dramatically increased risk of security breaches
Instead, your data delivery solution needs to include the capability to expose its Data as a Service (DaaS). This eliminates the need for permanent copies of the data instantiated throughout the company, with all the issues described above. We previously discussed DaaS services as part of the enterprise service bus in the exchange layer of your corporate information model (page 113).
Each repository should only expose the data for which it is the system of record. When taken as a whole, there is only one system of record for each data element, though they may be spread out across the company infrastructure. In some cases, there will be multiple applications containing similar, but unique information, two different loan systems at a financial institution, or three different billing systems at an insurance company. In this case, the same service may actually be instantiated more than once, but for different subsets of the enterprise data. For any detail data value the business may need, there should be only one, well-defined system of record where you will go to look it up.
Even analytical systems can be the system of record for certain kinds of data. An analytical system might be where the master customer index is created, uniquely identifying a customer across all your systems. It might be the system of record for profitability scores, risk scores, or propensity scores. It might be the system of record for customer segmentation. Any of these might be exposed to the infrastructure as a service from an analytical repository.
That said, any component that exposes services is operational, and will inevitably require much higher availability than is currently architected into most analytical systems, complete with failover and redundancy. As the wall between analytical and operational systems continues to fall, this distinction may one day disappear. For now, you will probably need to build a downstream, high-availability DaaS data mart under your analytical repository. It’s here where the information necessary to support the DaaS services is housed. A separate physical machine should host that data mart, if possible. This analytical information DaaS data mart isn’t the system of record, but it is the system of access. This is still a much better solution than bulk copying the analytical data all over the company infrastructure. If you must have a separate system of access than the system of record, then have only one system of access. In effect, the DaaS server is an operational data store (ODS) for your analytical repository.
Decision support (delivering decisions)
Collecting, cleansing, and delivering data and knowledge in the form of business intelligence solutions is the low hanging fruit of the information delivery function. With BI tools, it’s still up to the end user to interpret the knowledge and decide on an action. However, there’s a growing class of products that automate the decision-making process, thereby delivering actionable information directly to the business. Recent advancements in artificial intelligence make this an especially exciting area to be working in these days.
Of course, you have to have valuable information to make good decisions. The data needs to be complete, accurate, timely, and accessible. You can’t jump very far into decision support until you’ve done a good deal of grunt work to build quality data.
However, once you have good data and good context, the possibilities are endless! If you aren’t involved in delivering decisions, you’ve built a Cadillac to drive to the mailbox. You need to get that machine out on the road and open her up.
Today, almost all decision support is model-based. Mathematical modeling has been around long before computers, but the number-crunching capability of the computer has certainly made widespread decisions support possible.
There are basically three types of models: descriptive, predictive, and prescriptive.
Descriptive models
Descriptive models don’t assign predictive scores, but instead summarize what has happened in the past. They are useful for summarizing and categorizing complex data in order to make it understandable by human beings.
There is an endless array of descriptive analytics available. One example is a process known as segmentation. Customer segmentation separates your customer base into groups that have exhibited similar behaviors, since they can generally be treated similarly. It’s easy to talk about a segment of one (i.e. customized treatment for every customer, not groups of customers), but most business processes are still designed around groups of people. In a sense, segmentation is also predictive, because you are segmenting things based on your assumption that they will behave similarly to the rest of their assigned segment in the future. Although the end purpose is predictive, the analysis itself only looks at what has already happened in the past.
I once worked for a large company during a major customer segmentation initiative. After the segmentation was complete, everyone on the team eagerly looked up their own records to see how we’d been bucketed. Of all the people on the team, I was the only one to be bucketed in the Active Gray segment. I was in my early 30’s at the time, but age wasn’t actually part of the model – only behavior. According to this model, I exhibited behaviors that put me in a marketing segment with healthy retired people who were technology-adverse but traveled around a lot. I guess my entertainment preference of reading, combined with my hobbies of blacksmithing and woodworking makes me a throwback from another era.
A descriptive model is contextual knowledge, not a decision. In theory, someone still has to use that knowledge to make a decision. In my example above, my segmentation resulted in me automatically receiving many product offers designed for my active gray customer segment.
Predictive models
Predictive models assign a rank or score to data based on the likelihood of some future event. Predictive models are just scores, not decisions, but they are very effective tools for driving decisions. A marketing department might use predictive models to assign a “likelihood to buy” score to each customer for each product, which can be used to automate marketing decisions.
A heath management organization may use predictive models to generate disease risk scores or compliance risk scores in order to automate treatment and outreach decisions. I was once discussing predictive modeling with a peer at another health insurance company. He told me that they had found in their market that there was a strong negative correlation between boat ownership and dental insurance purchases. In his marketing area, people who fish don’t buy dental insurance. I’m not sure how to explain that, but that’s exactly the power of predictive models. They wouldn’t be terribly useful if all they predicted was the obvious, common sense stuff. It’s the non-intuitive predictions that are really valuable.
Years ago, a statistical analysis software vendor advertised their product with a picture of a grown man in a grocery store, wearing nothing but a large diaper, carrying a case of beer. Apparently, they had found that beer was much more of an impulse purchase to someone entering the store to buy diapers. That’s why they always put the milk in the back of the store, because you “have” to buy milk, and putting it in the back forces you to walk past display after display of likely impulse purchases. Anyway, they found that placing beer and diapers close together dramatically increased the purchase of beer. I checked this week in my local grocery store, and yes, the diapers are one row over from the beer. The power of predictive modeling.26
Prescriptive models
Prescriptive models take the next step and generate decisions. This is a bit misleading, because most “decision” models are really just one or more predictive models with another layer added to convert the score to a decision.
A predictive model for customer churn (i.e. a rate of leaving the company) may be automatically fed into a discount or upgrade offer, converting the prediction into a decision. Modern decision models will start with the prediction, plus a large number of known operational data, contextual data and derived knowledge information attributes, and model the effectiveness of many different potential actions. Some customers might react more favorably to a bill discount, while other customers might be much more inclined to stay if offered a free upgrade.
A likelihood-to-buy predictive model may give a customer scores for many products, but the most likely product to buy may have a far lower profit than the second most likely product. The prescriptive model must balance the likelihood to buy scores with factors like product profitability, and then recommend which score to act upon.
Decision models help predict which action on the company’s part will give the desired reaction. Regardless of model type, every new model must first be created and validated. Once that is achieved, they can be made operational.
The initial development of a model is a very resource intensive operation. With rare exceptions,27 models are not developed on the fly during the operational process. The data scientists who work with these statistical tools are very valuable, highly-compensated resources, often with advanced degrees. You don’t want them spending large amounts of time extracting and massaging data before they even begin analyzing it. Provide an area where data is pre-built for these resources, in a model appropriate for the work they need to perform. See Statistical models on page 125 for more information about modeling for statistical analysis.
The operationalizing of the models, or scoring, typically takes place in your operational model and doesn’t usually require the statistical analysis tool to execute. It takes very powerful statistical analysis software to come up with a linear regression model, but once the formula is produced, almost any software can be used to calculate the model output . A few modeling techniques such as neural networks require more specialized tools, but for that very reason, neural networks are seldom the first choice if other modeling techniques can be found to give similar results.
Campaign management
Campaign management is a classic form of delivering decisions. This has been around forever. I imagine accountants in Dickens’ day using quill pens to add up numbers in ledger books to generate campaign lists. Sales force automation is a form of campaign management, generating lists of likely candidate leads for a specific action.
Campaign management is a complex practice, involving segmentation, predictive modeling, control groups, and some way of tying back the campaign response into the model for revision. One of the hardest parts of campaign management, believe it or not, is tracking the response to an offer, and getting that response, positive or negative, back into the campaign model as feedback to adjust future models.
All the deep statistical stuff is hard, but there are really smart people and really good statistical software packages that handle that part. If you can’t get the responses back to the campaign, though, you’re cutting those smart people and their software off at the knees. You’re asking them to fly blind.
To some degree, you can assume responses, but that isn’t very accurate. You can generate an email campaign for a product purchase, and assume that if anyone on the campaign list buys the product, it was because of your wonderful email – but they may have never opened it. After all, the campaign list was probably people who were very likely to buy the product anyway. However, if you give some kind of tracking number in your offer (for instance, “enter discount code CAMPAIGN123 at checkout for free shipping”), then you can be much more certain about the effectiveness of your campaign.
It’s up to your information architects, working with the business and application architects, to design an infrastructure that will allow campaign responses to be tracked and fed back to the campaign management statisticians and software. Closing the loop on campaign management function requires an enterprise effort across all architectural domains.
I once read an inspiring little book called 212° the Extra Degree,28 which talked about the difference between water at 211 degrees (Fahrenheit) and water at 212. At 211, it’s just hot water, but at 212 it boils, producing power than can drive a locomotive across the country. One degree extra makes all the difference. Putting the architecture in place to track and return campaign responses to the campaign management system is that one extra degree that makes all the difference.
Real time decisions
Real time decisions are essentially a very fast campaign cycle, combining real-time information with information you already knew to generate on-the-fly decisions. Earlier (page 96), I gave an example of a real-time decision proof of concept developed by a single developer in less than two weeks that saved the company 6 million dollars in expenses in its first two months of operations. That’s powerful stuff! That’s IT supporting the business in a powerful way.
The hard part about managing the data for real-time decisioning is that analytical data hasn’t traditionally been integrated back into the operational world. In fact, that separation has been, in the past, considered best practice. Very high walls existed to keep the analytical processes from impacting the operational world. You never wanted your operational processes to be dependent on intermediate analytical steps.
But the world is changing. The wall between operational and analytical is falling (page 96). One of the first breaches is real-time decisions.
In order to provide the IT infrastructure to support this function, the analytical data has to rise to the availability (failover and redundancy) and performance necessary to integrate with the operational world. There are techniques to bring your entire analytical infrastructure up to this standard. Companies like Amazon, eBay, and Google are delivering operational analytics on a mind-numbing scale.
Most of us aren’t quite prepared for that. Even if we had the expertise, our business models wouldn’t support the accompanying expense. Setting up a real-time analytics platform on the scale of Amazon would be a fantastic project, but you most likely don’t work for Amazon.
For most of us, the best answer is a hybrid environment. You have very traditional operational applications designed for high performance and high availability transactions, and you have very traditional analytical applications designed for batch processing. You can build a downstream enterprise data mart as an operational platform to expose analytically derived knowledge as operational services. With this platform in place, you can implement real-time models that combine real-time operational information with batch-generated analytical information, scoring them using a pre-generated model, and make a decision.
There are commercial software packages that will host this real-time scoring for you, and even adjust the model dynamically over time based on responses. You can also choose, as we did, to dip your toes in the water with a POC and some hard-coded rules until the value of this functionality is more widely recognized. From an information standpoint, you’ll need to be able to support transactional access to all the necessary data, even if the system of record is an analytical system. You don’t want to send extracts of all your analytical data to be loaded locally by these systems. You always want to access the data at the system of record if possible, rather than proliferating copies of data all over the place in order to give the necessary performance.
Ensuring the quality of information
The next IT function in the information lifecycle is data quality. Data quality should be an enterprise initiative, not a departmental one. The business case for cleansing data could be negligible within the scope of the application that initially collects data. But the value of the data is the value to the enterprise, not the value to one application. The application owner will not have insight or incentive to care much about the downstream consumers of the data they create. This is why it’s so important to have an influential executive sponsor who will support the functional framework at the enterprise level.
Dimensions of data quality
The dimensions of data quality are all the different functions necessary to ensure the quality of your data. I use the term data rather than information because the quality of your information pyramid is largely dependent on the quality of the raw and contextual data information tiers. Knowledge is derived from raw and contextual data. Decisions are built on all three.
If you run an internet search on the phrase “dimensions of data quality,” odds are that on the first page of results, you’ll get at least four or five different lists, each with a different number of data quality dimensions. I’ve seen lists as small as three, and as large as twenty-three. I think this is due both to the level of detail the lists go into, and to differences of opinion regarding whether functions like performance and security are data quality dimensions. Clearly, there’s no universally accepted definitive list of data quality dimensions.
The base premise of this book is that you have to organize your functions into something that’s conceptually simple to grasp. If you can’t visualize the concept, you can’t manage it. In keeping with that line of thought, you’re going to need to create order out of the chaos of these data quality functions.
You can do this any way that works for you, provided it is easily manageable. I certainly can’t fit 23 top-level data quality dimensions in my head at once. You can’t manage that many peer functions without imposing some higher-level organization to reduce the number of items on the top-level list. I don’t believe it’s useful to have more than five data quality functions under the data quality functional area. You can break those down into as many sublevels as you want, but I would try to group them into no more than five top-level functions
When I look at the various lists out there, some of the data quality dimensions in them are ambiguous and overlapping, and some aren’t what I would consider data quality functions at all. In an enterprise-level functional framework, I don’t think it’s wise to bury functions like security underneath the data quality heading. Honestly, many of the lists appear to be arbitrary. Other lists are championed by vendors, and are based on the tools they are trying to sell. The proliferation of different lists doesn’t make me confident that I’ve got all the bases covered. I need some kind of intuitive organization that makes the gaps obvious.
I think most of those data quality functions are useful, but I prefer to impose the following organization structure to them:
- Collection Quality. All the things we do to make sure we captured the data accurately and completely from the source.
- Validation Quality. All the things we do to make sure that the data is reasonable for what it is supposed to represent in the real world.
- Verification Quality. All the things we do to make sure that the data is correct for what it is actually represents in the real world.
- Integration Quality. All the things we do to make sure we integrate the data into our repository in a way that is meaningful.
- Delivery Quality. All the things we do to make sure the data is accessible by the right people at the right time.
This structure makes sense to me because it represents the flow of the data: we collect it, clean it up, integrate it, and deliver it. This is, if you will, a data quality lifecycle. All the detail data quality functions on all those lists seem to me to belong under one of these headings, or they don’t belong under data quality at all. This organization makes it easy to grasp and manage data quality at a high level without being bogged down in details. If I have a new data quality function I want to add, it should be pretty clear which of these top-level data quality functions it will fall under.
This organization applies to both operational and analytical repositories. One may collect data from a user interface or service call, and the other from a batch file, but data quality is data quality. Some data quality functions, such as latency, aren’t as relevant to operational apps, but even that is changing as our user interfaces spread out into a distributed internet of things.
Here’s an attempt to file many of the common data quality dimensions under this organization structure:
- Collection
- Integrity/Accuracy/Fidelity. The data values we brought in, right or wrong, match the source.
- Completeness. The data we brought in represents all the data on the source.
- Validation. The data is valid for the field, mostly done at the field or row level.
- Data type validation. Does a date field contain alpha characters?
- Pattern matching. US individual social security numbers follow the pattern “NNN-NN-NNNN” and cannot begin with “000” or “666”.
- Verification. Is the data correct? This isn’t about whether the captured email address is formatted correctly (i.e. with one “@” sign and no spaces), but whether it is actually the correct and still valid email address for the correct person in the real world today. This is much more difficult than validation and often requires specialized tools.
- Integration. Mostly done across multiple rows or tables.
- Consistency. Is there a way to identify all the information for one customer, account, and product across all tables and rows for consistent reporting?
- Conformed. Are all source-specific values conformed/transformed into a common set of codes?
- Balancing. Do the sales numbers received from the customer account system match the numbers posted to the general ledger?
- Uniqueness. Do two different people share the same SSN?
- Referential Integrity. All codes used on the business tables must exist in the reference tables. All business child table rows (i.e. order lines) must have business parent table rows (i.e. order headers). Years ago, we enforced referential integrity only in development environments due to performance impact, but now it’s common practice to do so in production as well. The overhead of referential integrity in most major databases is quite small.
- Cardinality. Every purchase order header record must have one or more purchase order line records. Very few lists contain cardinality, because it is often considered the other half of referential integrity, saying, for example, that a parent row must have one or more child rows; that an order header must have at least one order line.
- Delivery
- Latency/Timeliness. Is the information available to the end users when they need it, before it becomes too old to be relevant?
- Accessibility/Ease-of-use. Can the end user get to the data easily, or are there walls between the information and the business that needs it?
- Availability. Is the data actually available when the user needs it, or are there large windows of unavailability?
Undoubtedly, you’ll find that some of your sacred data quality functions are missing from this list. Perhaps you’re right. Quality is, to a large degree, in the eye of the beholder. Data quality doesn’t mean perfect data, it means data that is fit for use. That definition will vary from business to business and from data element to data element within your data model. That said, I intentionally omitted a few functions that appear on many lists:
- Relevance and Utility. Everything IT does should provide business value. That’s true of data, but is just as true of software and hardware. I absolutely agree that data should be useful, but I don’t consider that primarily a data quality issue. I consider it instead to be the core purpose of IT – to support the business. You should identify irrelevant data elements during the business requirements function of the software development lifecycle. They should never make it into the model in order to become a data quality issue. If a data element becomes irrelevant over time, then that data element is ready for the information end-of-life function, not a data quality function.
- Compliance. Like relevance, I consider compliance critically important, but I don’t consider it to belong under data quality. Information compliance mandates are usually covered by information security functions and information retention/end-of-life functions.
- Time Stamped. If the business would be best supported by including a time stamp, that’s a business requirements and modeling issue – not a data quality issue.
- Fit for use. Data quality is relative. There’s no such thing, on any large scale, as “perfect” data. For every single one of your data quality functions, you will need to develop a way to measure the quality. You can’t manage what you don’t measure. Your measurement must define what’s acceptable and what isn’t. Fitness isn’t a separate data quality function; it’s part of the definition and measurement of every data quality function, and something that’s subject to change over time as various pieces of information become more or less critical to the business. It shouldn’t be necessary to say that the acceptable level of data quality in any of the data quality functions is determined by the business, not by IT. Any effort IT spends doing more than is useful to the business detracts from the value IT is providing. This is a business, not a science project!
You’re free to disagree with me. Judging by that internet search mentioned earlier, I think everyone disagrees with everyone else about data quality functions, so I won’t be offended. The point of a functional framework is that it’s a framework upon which to hang your functions. It is not a mandated list of functions to which you must rigidly adhere. You should consider the ideas proposed here, but you should also consider your unique environment and adapt the functional framework as necessary to help you effectively manage your IT on behalf of your business.
Profiling/discovery
Data profiling is most often thought of in terms of a data quality tool, but an enterprise data profiling solution should serve many purposes:
- Data Quality. Data profiling can be an enormously helpful aid to data quality. There are commercial tools available what will analyze any given data set for patterns, outlier values, and value min and max range. This is especially useful when bringing in new data, to determine the types of quality issues the data contains. With the current state of technology, this deep scan is typically done when the data is initially introduced, and only periodically thereafter. Other edits and processing checks are usually developed based on the findings to execute on an ongoing basis whenever this data is modified or appended. Like predictive models, data quality tools are resource-intensive tools that can suggest an algorithm you may want to consider implementing. Of course, if you want to make that algorithm operational, you’ll probably have to look outside the tool despite the vendor’s claims.
- Data Modeling. Profiling tools should build a data model and data dictionary for the new source that can feed the data modeling function (page 102). Does the data contain nulls? What is the longest value? What is the precision and scale of a currency amount or percentage? What is the complete list of code values? This information can then be mapped to the enterprise logical data model, so that the data and its relationship to other information within the enterprise can be documented, tracked, and researched.
- Data Security. Profiling tools should identify the presence of sensitive data that can feed the information security function (page 159). The data security function will have identified labels and categories of sensitive data and decided how that information needs to be protected. Of course, the information cannot be protected unless it is first recognized. A tool that scans existing files and repositories should be able to identify “special” data. A profiling tool can, for example, figure out that the data in a field labeled CLIENT_ID actually looks suspiciously like social security numbers.
Choose a data profiling solution at the enterprise level. It should be able to scan all data sources and physical repositories from different database vendors, as well as flat files and social media feeds. The solution should analyze both structured and unstructured data, and should produce output that can be consumed by all the information lifecycle functions listed above.
Metadata
Ask any data architect what metadata is, and you will almost certainly hear the definition data about data. Maybe it’s just me, but I don’t find that to be a very helpful definition. I’m going to briefly discuss four types of metadata, certainly not an exhaustive list, to try to give some sense of its importance in an increasingly information-centric business.
- Reference tables
- Data glossary
- Data dictionary
- Genealogy
Reference tables
Reference tables are tables containing lists of valid values for codes and keys used in business data, often listed as name/value pairs. A business table might contain a state code populated with the two-character state abbreviations (e.g. AL, AK, AZ). A state reference table would contain a row for each of those two-character codes, with additional information such as the full state name and the FIPS code. Not everyone agrees that reference tables are technically metadata, but those that do justify that stance by saying that the reference tables are data about the codes and keys used in the business table data.
These tables are useful for several purposes.
- Enforcing referential integrity. From a data quality standpoint, the references tables allow the data modeler to create referential integrity constraints. In the state code example above, the modeler can create a constraint on the business table specifying that no value can be inserted into the state abbreviation field on the business table unless that value exists on the reference table. With this constraint defined and enabled, the database will reject bad data with a referential integrity constraint violation error. You don’t have to depend on the source to send only valid values, or for the user interface application developer to cleanse the data. This is a great way to ensure data quality. Years ago, the practice would be to enforce referential integrity in the development and test environments, but not the production environment. In the last decade, the major database vendors have made great improvements in their products, and referential integrity performance is seldom an issue for most business processes.
- Improving query accuracy and performance. If the database did not enforce referential integrity from the business tables to the reference tables, it would be possible for rows in the business table to contain state abbreviations that did not exist in the reference table. If you wrote a query to join the business table with the reference table, perhaps to provide the full state name for reporting, you would have to write the query using the more complicated outer join in order to prevent business table rows that have no corresponding reference table value from dropping out of the result set, giving misleading results. Not only are you taking a risk that the end user will remember to use an outer join, but in many databases an outer join performs much more poorly than an inner join. If referential integrity is enforced, and you can guarantee that every business table row only contains codes that exist in the reference table, then you avoid the risk of improperly written queries and improve query performance. This improves the data quality, performance, and delivery functions.
- Internal documentation. Reference tables serve as internal documentation of the codes and keys used on business tables. In most production information system repositories, there are hundreds or thousands of different business codes and keys. If there were no reference tables, a business user would have difficulty remembering what all the codes meant. The reference tables serve as documentation to your internal users who are exploring the database directly.
- Configure business logic. The reference tables often contain much more than name-value pairs. They may contain processing indicators, such as “this subscriber type can make payments but can’t change contract information,” or “this diagnosis is PHI sensitive.” These flags help business analysts better understand the business information. The application business logic can be coded to use these flags, rather than hardcoded values, allowing business users with the correct authorization to configure the data and alter the way the application logic processes information.
- End user reporting. In end user reporting, the reference tables allow the codes on the business tables to be expanded into human-readable names and descriptions.
These tables are usually maintained internally by a QA team. Even if reference table values are received from an external source (i.e. a USPS zip code list), the reference tables themselves are usually managed by the data quality resources. If the governance processes and roles document this operational responsibility, then the approving role for the reference data maintenance function is, by definition, the data steward of the reference table data .
You should try to create standards at as high an organization level as possible, to ensure consistency and minimize the effort of creating rules for each information system. Reference tables aren’t new. You aren’t the first company to ever use them. There are well-defined best practices for a number of common reference table needs:
- Ralph Kimball’s The Data Warehouse Toolkit is the source for the best practice approaches to handling reference data that changes over time, known as slowly changing dimensions.
- There are also recognized best practice for data that is always received in the enterprise-standard code set (global reference tables) and data that is received from various sources with source-specific codes that must be translated to an enterprise standard (translate reference tables).
- There are classic approaches to gracefully handling data that can come in with invalid or unknown values that are not in the reference table and would violate referential integrity.
And so forth. There is nothing new under the sun, so they say. You aren’t the first person to encounter these problems. Use industry accepted best practices, document them as enterprise standards, and model them in your Enterprise Logical Data Model (ELDM).
Reference data that is managed at the enterprise level can be classified as a simple form of master data management . Ideally, any reference tables which are used by multiple applications are managed at the enterprise level, not as duplicated effort within each application area.
Data glossary
It’s important that the business terms are consistent across the enterprise. I once worked for a company that invested a significant amount of time, money, and resources implementing a data warehouse for the first time, not because they saw a particular need for enterprise analytics, but because they suspected internal fraud. The sales numbers from each manager didn’t add up to the accounting system’s total numbers. We spun up a data warehouse primarily so that the executives could see which divisional managers were embezzling from the company.
Fortunately, we found that no one was stealing money. It turned out that the entire misunderstanding was due to inconsistencies in how different managers interpreted various business terms. What was included in net sales? Were leased units counted as units sold? If a product was sold now for future delivery, when would the units be counted? Once we had all the divisional managers reporting out of a single source with consistent business logic, all of the numbers magically added up just fine, and the executives were able to make much better decisions.
I’ve witnessed mind-boggling loss of productivity and insight due to an insurance company having eleven different definitions of “large group” versus “small group.” I’ve wasted many hours because nearly every department uses key terms such as “line of business” to mean something completely different. These are the problems that a glossary tool is designed to resolve.
I once had a sales rep for a very large software company keep hounding me about purchasing their glossary product. It didn’t matter what business need you described, the answer was “glossary.” Want to end world hunger? “You need the glossary!” Unfortunately, I developed a very adverse reaction to all products in that space. To this day, I can’t hear the word “glossary” without looking for a way to escape the room. But I have to admit, having well documented, consistent business definitions is an extremely important, often overlooked service that IT needs to provide the business – one that can make or break your information management solution.
A business glossary isn’t just a nice little thing to provide for the education of your end users. Like many IT functions, a business glossary is part of a complicated network of interwoven IT functional dependencies across the enterprise. Consistent terminology can impact integration efforts, can impact your data modeling, data delivery, and data quality. Security regulations often include very specific business term definitions that must be mapped to internal data concepts. Ideally, the enterprise definition would be tied to the ELDM, which is mapped to physical instantiations throughout the enterprise.
Data dictionary
Building a complete and accurate data dictionary is an important part of managing data assets. Both the business and IT need to be able to agree on what’s being discussed. Ideally, this would be an enterprise effort.
If you build and maintain an enterprise logical data model with all your physical data repositories and services mapped to it, then you can capture the data dictionary in a single place. Implementation-specific information need only document the deviations from the enterprise definition or code set.
Genealogy
Data genealogy describes how data flows from table to table, from information system to information system, including transformations that happen along the way.
Data genealogy is built into some development tools but is seldom an enterprise-wide concept. Ideally, from an enterprise information management standpoint, you should be able to trace all of your information assets using a single data genealogy tool or repository. This capability is important to support the need to analyze the impact of potential changes, to retrace data back to its source for root cause analysis, and for meeting regulatory requirements for things like analyzing the scope of security breaches. Protecting sensitive data assets involves protecting them throughout the chain of custody. If you protect ninety-nine links in the chain, but leave one link exposed, the data is not protected.
In May of 2017, the WannaCry ransomware attack was activated on over 300,000 computers spanning 150 countries across the world. In a ransomware attack, the data is not stolen but encrypted; any user access is met with a request for payment. The National Health Service (NHS) in the UK was one of many institutions affected. Many non-urgent appointments were cancelled, and some systems had to be shut down entirely. Not all of those systems were actually impacted, but the NHS did not have any enterprise-level genealogy information to tell them how their own data flowed through their systems. Therefore, they did not know which systems depended on which other systems and had to shut them all down to avoid failures and further spread of the ransomware.
An ELDM maps all the various data instantiations, both repositories and services, to a single data model. Ideally, this repository will also show how data flows from one instantiation to another.
Some regulatory bodies have explicit requirements to document data genealogy. Drug trials, for example, are only valid if analysts can maintain the chain of custody of the information, and can prove that the blind study remained blind. In other cases, regulatory bodies contain privacy and security requirements that carry an implicit requirement for data genealogy in order to prove compliance to the standard during an audit.
Securing information
Information security becomes more critical every year, primarily because data becomes more valuable and more powerful every year. This information lifecycle function is often the driving justification for initially spinning up an EAG program at many institutions.
When Social Security Numbers (SSN) were first introduced in 1935 as part of the New Deal, there was no thought to making them private. It was only the social security program that would use the number, so it was of little use to anyone but the cardholder. However, over the years it has become convenient to use the SSN as a de facto national ID number. Today it’s difficult to conduct legitimate business without one. The SSN is used in bank accounts, employment contracts, medical records, and utility contracts. I can remember when my state assigned driver’s license numbers using the driver’s SSN! But as the SSN data became more widely used, its value increased, both to the cardholder and to criminals. This trend isn’t limited to SSNs; many of your corporate information assets are becoming more valuable, and hence more sensitive, over time.
These days, information security impacts nearly every IT function in your enterprise framework. Data should be secure by design and by default. I have to admit to lengthy arguments regarding whether security should be a vertical function column in the functional framework, or whether it should be a horizontal row within architecture or governance. Security specialists within IT tend to think of security as a pervasive part of every function we perform.
I can see their argument, but I’m going to insist that security is indeed a function – an IT job we perform on behalf of the business. Security isn’t a governance-task like policies, standards, processes, and roles; security is something we do – a function that has policies, standards, processes, and roles. It has a strategic vision and a tactical roadmap.
You should select, at the corporate level, which of the many different security compliance programs you will pursue, and design your functional framework to comply with those practices across every aspect of the business.
I don’t recommend trying to develop your own security program. Pick one of the national standards: NIST, HITRUST, ISO/IE 27001, or GDPR. Odds are that your industry is already mandating your compliance with one or more of these standards. That compliance often comes with a rigid deadline, and noncompliance is penalized by large fines and even jail time. More often than not, security regulations are the driver behind the initial adoption of an enterprise-wide architecture and governance initiative.
Unfortunately, many companies see security as a technology domain initiative, not an initiative that crosses all domains of IT. Even at the highest level of abstraction, I prefer to break security down into lifecycle-specific functions within each of the information, hardware, and software domains. A functional framework that crosses all domains is a great way to set up and manage your security initiative across the enterprise in the most efficient manner.
Regardless of which regulatory standard you choose, they all lay out requirements that fall naturally to the different domains. Here are a few of the more common security requirements.
Information domain security
This information domain is mainly concerned with the security-related attributes in the information itself, not the processes or platforms supporting that information.
- Security Labels. These are the various types of sensitive data, such as Personally Identifying Information (PII) or Payment Card Industry (PCI) information. Security labels apply to individual data elements and are the foundation upon which all security is built. How can you build a security program without understanding what information is being secured? It’s information, after all, that you’re securing, not hardware or software. These labels and the data they apply to are usually documented in the ELDM as part of the data modeling and data dictionary processes. Most security labels are associated with columns of data. Some particular columns, such as social security numbers, are quite sensitive. Never expose these without business justification. Alternatively, some sensitivity labels are associated with rows of data. Those rows could be masked but are usually just hidden. More on this in a minute.
- Audit Trail. When production data is changed, most security regulations require that you have an audit trail of who changed it, and when. Not only must you have security policies, standards, and processes documented, but normally you are also required to have an audit log to prove that the processes were followed. This includes regular transactions, batch updates, and emergency patches.
- Genealogy or chain of custody. Many security regulations now require you to document how data flows through your information systems, both the data at rest in repositories and the data in motion in web services and flat files.
Application domain security
The application domain is mainly concerned with security processes.
- Security Classifications. It’s sometimes hard to explain the difference between security labels and security classifications. The best way to explain it is to think of paper-based information at a military intelligence installation before the days of computers. In a filing cabinet full of folders, some folders will contain PUBLIC information anyone will be allowed to see, provided they have some business reason. Other folders will be classified, clearly stamped on the front with the appropriate security class, perhaps SECRET or even TOP SECRET. The file clerk has a process they must follow for each of those classifications of data. Secret information should only be accessed in a special room; after using, it should be returned to the file clerk. Top secret may require a security observer to be present at all times. There are different types of top-secret information: advanced weapons research, troop deployments, foreign intelligence, and so forth. Different folders will be labeled with the identification appropriate to the data. When the file clerk receives a request, they must compare the security label of the data with the security clearance of the person requesting access. If that matches, then access is granted. The same process is followed for all the labels that are top-secret. The security label identifies what kind of data is appropriate for different roles to access, the security classification identifies what processes must be followed when that data is accessed. Many labels can fall under the same classification. Every security regulation will require you to define your security classifications. Many of them actually define the classification system you are required to use. You will have to put processes in place for each classification, document those processes thoroughly, and audit them to make sure they are followed. While data labeling is typically an information domain function, data classifications are an application domain function because they are the processes which must be followed for secure data access, including authentication, authorization, logging, etc.
- Security provisioning and de-provisioning. The processes involved in granting and removing security access to people. Typically, security roles will be aligned with the information domain security labels. Consider how you add people to security roles, and regularly verify with their supervisors that access is still needed. Also consider how you might de-provision access when the person leaves or transfers.
Technology domain security
This technology domain is responsible for the security of physical assets.
- Physical Security. Mainly providing physical security of physical assets, including computers, network, and the building site itself.
- Appliance Solutions. With today’s technology, many hardware platforms come with embedded software (i.e. network routers). While technically an application, the technology domain usually assumes responsibility for the software that runs on appliance solutions.
In short, security is complicated. You knew that already. Security is one of those functions that really can’t be performed department by department, or project by project. You need a comprehensive enterprise initiative involving coordinated functions that span all EAG domains.
In keeping with the purpose of this book, I want to talk a little bit about some of the more challenging areas of such a coordinated enterprise-level security initiative; the areas where many companies seem to struggle.
Like all other IT functions, the security functions should begin with data, but instead is often managed by technology domain resources. Those resources seldom have much experience with information management principles, and struggle with things like security labels and classifications.
Data security labels
It’s critical that you create consistent, enterprise-level definitions of all your security labels. Your labels are generally determined based on two factors:
- What regulatory mandated labels are you required to support? Some security frameworks such as HITRUST give you a good deal of leeway in the definition of your security labels, but are quite rigid on the subject of security classifications. Other security standards such as HIPAA are much more rigid on the definitions of your security labels (i.e. PHI) than your security classifications. When defining your security labels, there may be some labels you are required by law to support.
- Other security labels may be created internally based on blocks of data for which you wish to enable and disable access as a unit. You probably have a corporate policy that you hide employee accounts from most users. In this case, in addition to PII and PCI, you may also want an EMP label.
Information security should not be vertical silos of data elements, where each new project results in a project-specific security role. Security roles should relate to data security labels, not projects. Project-oriented security is easier on the developer in the short term, but much harder to manage in the long run.
Instead, you should think of your data in terms of which elements are “base,” no risk elements, and which are sensitive. There are several universally accepted forms of data sensitivity, such as personally identifying information or personal health information, which may or may not apply to your particular industry. When you classify data as sensitive, you will be using the specific sensitivity types that apply to your business. These are your security labels.
When you use these data sensitivity labels rather than project scope to set up security roles, the result will be a general-use base access that includes all the fields that are not sensitive, to which can be added supplemental roles for allowing access to each sensitivity label. Users with the base role only are usually set up to be able to see sensitive fields, but the data in those fields will be hidden, masked, de-identified, or encrypted. For example, they will see a column called SSN, but all the data in that column will be masked in some way. Users with business justification can be granted the additional “add-on” supplementary roles for each of the sensitivity labels they require. A PII label security role can be granted to view unmasked personally identifying information, and a PHI label security role can be granted to view unmasked personal health information.
Every user will be able to run the same SQL queries and reports, but, depending on the set of security roles each user has been granted, different users will see different variations of masked and unmasked data.
The following sections describe common implementations of security data sensitivity labels. These descriptions should not be considered compliant with every company’s interpretation of every industry’s regulations. Rather, they are merely examples of how you might define your own choice of sensitivity labels.
Personally Identifying Information (PII)
Personally Identifying Information (PII) is any information that might be used to identify an individual in the real world. There are dozens of regulations and guidelines that require a business to take every reasonable precaution to reduce the risk of data being used to identify real people. The trouble is, those regulations are not very helpful when it comes to defining actual implementation rules. They don’t define a list of elements, or how to treat them. They don’t define what is “reasonable” and what level of “risk” is acceptable. They don’t define these things for the same reason that I’m not: there are always exceptions and weighing work effort and business impact versus risk is a judgment call that will be different at every company.
Several factors contribute to making PII labeling more complicated than you might assume. It’s straightforward to decide on a field-by-field basis which information uniquely identifies a single person. A social security number, of course, is a unique identifier. That’s a rather simple exercise, taken one field at a time.
However, data isn’t dispensed one field at a time; it’s dispensed in combinations. Several fields that cannot be used individually to uniquely identify a person might be able to identify a person when used in combination. One study recently found that zip code combined with date of birth and gender could uniquely identify 87% of the people in the United States.29 How do you decide which fields can be used in what combinations? Even if you do somehow figure that out, how do you enforce that during information delivery?
Typically, you simply can’t. Instead, the approach taken by most companies is to recognize that some fields limit the candidate population more than others do. For American domestic businesses, a field containing country of residence doesn’t narrow down the candidate population much. State information still isn’t personally identifying. However, when you get down to county or zip code, there are some values that represent a small population.


At most companies, the legal department will mandate that the acceptable threshold of risk for any single field is a specific number – say 5000 individuals – and that proven need is required above this threshold. For instance, you can’t expose a field that can be used to narrow down the list of people to fewer than 5000. In theory, by not revealing the fields that seriously narrow down the population, you dramatically limit your risk of uniquely identifying a single person even using combinations of fields. This isn’t perfect, but is considered due diligence by many companies.
Using this threshold of 5000, state information would not be PII, but county and zip code, would. Table 4 and Table 5 show that some counties and zip codes are quite small indeed.
People with the special PII label security role will see the raw data for fields identified as PII sensitive, and people without the PII role will see only masked data. For PII data elements, if a field could contain PII, all values in the field are masked. There may be many zip codes with more than 5000 people, but if even one zip code contains less than 5000 people, then all values for the zip code field are considered sensitive. You don’t typically mask just the tiny zip codes – you mask all of them.
Typically, you can’t be held accountable for special knowledge that people have in their heads, especially your internal employees who know the data very well. “If I see a bank account with a balance of $100 million dollars, I know who that account belongs to, even if the accountholder name is masked.”
You have to make sure that you don’t expose data which explicitly connects the dots, certainly, but how far beyond that does your obligation go? Most companies decide that if information is widely available from public sources, then you have to assume that everyone knows it. However, you really can’t be held accountable for obscure information that some external user might know. Perhaps your de-identified medical records include blood type. Some blood types are quite rare. Are you responsible for masking the blood type field because of a handful of end users who might have unusual and specific information about the people who have rare blood types in your customer area? If you believe so, then you need to treat the blood type field as you treat county and zip code, masking all values if any value could narrow the population below your risk threshold. Most companies would not go that far. As long as the data that you provide does not contain the information to connect all the dots and uniquely identify an individual, most companies take the position that you are not responsible for what other information people can add to yours.
The scope of your due diligence is usually considered to end at what information you are actually exposing that, in itself, can be used to connect the dots and identify people within your acceptable level of risk.
PII sensitive data must be de-identified in a way that cannot reasonably be expected to tie the information to a unique person in the real world. Some of the possible techniques for “de-identification” include:
- Hiding. When used to de-identify fields, this technique simply replaces the data with a constant. Usually blanks, but quite possibly hard coded values like “NOT REPORTABLE.”
- Encrypting. Encryption doesn’t necessarily have to involve special cryptographic algorithms. It can be as simple as replacing the actual ID that is seen by the end user with the surrogate key that’s used in the database. That surrogate key is meaningless outside the database, and cannot be used in the real world the way a social security number could. The difference between encrypting and other de-identification techniques is that the sender should be able to use the encrypted value to restore the missing information.
- Obfuscating. This is the practice of generating values that may look real, but are not. It includes practices like looking up values in a list and swapping values between rows.
- Masking. Masking is the practice of revealing part of the data, but not all of it. A common example would be revealing only the last four digits of the social security number. Another good case for masking is replacing the month and day of the date of birth with 01-01. This allows age-related processes to perform reasonably, without revealing as much personal information.
Most major database vendors allow implementation of any of these techniques at the database level, driven by security roles.
Users should first request access to the BASE role, which does not have sensitive information, then request to have PII added to it. The higher levels of access require increasing scrutiny of the underlying business justification for exposing the data. Users who don’t have access to the PII role will still see the fields, but all values in the fields will be de-identified in an appropriate matter.
Personal Health Information (PHI)
Not every company stores Personal Health Information (PHI), but if you do, it is extremely sensitive. According to Reuters,30 medical information is now worth ten times as much to hackers as credit card information.
Technically, the definition of PHI includes PII. That said, I find that most businesses who deal in both have business needs to be able to manage them independently. A user in human resources may need to see employee PII name and address information, but would have no business need to view the employee’s health-related PHI information. A user in actuarial may need the PHI health information for all customers in order to calculate group insurance rates, but would have no business need to see the individual PII name and address information. Therefore, access to the PII and PHI information needs to be able to be granted and revoked independently. For that reason, I usually implement them as two separate security labels.
Some elements of personal health information, such as a diagnosis of a broken arm or a prescription for Tylenol, are not sensitive. They are PHI, but not sensitive PHI. This distinction is made in several regulatory documents, and is, therefore, subject to interpretation by your legal team. Sometimes the regulations themselves give you some guidelines in this area. HITRUST says that, “Care shall be given to ensure patient information subject to special handling, e.g. HIV test results and mental health and substance abuse related records, is identified and appropriate labeling and handling requirements are expressly defined”31 (emphasis mine). According to HITRUST, any information that could indicate one of the following is sensitive PHI, with a higher standard of custody than normal PHI:
- Substance abuse treatment records
- HIV/AIDS status, testing, diagnosis
- Mental health status, counseling, or treatment
One could find this kind of information in many different databases. HITRUST lists those as examples only, not as an exhaustive list. Your legal department will need to examine all the relevant regulatory policy verbiage, as well as state law, court decisions, and case studies related to compliance. This is not a decision for the IT security team.
Your legal team may also want to consider:
- Abortion services
- Rape or sexual abuse treatment, counseling, or services
- Sexually-transmitted diseases treatment, counseling, or services
- Pregnancy testing or results
- Gender transition treatment, counseling, or services
You need to protect both regular PHI information (e.g. broken arm) and sensitive PHI information (e.g. mental health), but the standard for needing access to sensitive PHI is much higher.
As with PII, the scope of your due diligence only includes the information held within your corporate repositories. If an end user happens to know that Dr. X is a psychiatrist or that the clinic with address Y only performs abortions, they are bringing in knowledge from outside your repositories to their query. Most companies consider their responsibility to be met if they do not provide the information necessary to connect all the dots for the end user, and do not consider possible knowledge that end user may bring. But again, that will be a decision that your legal team needs to make.
Like PII, users should first need to get BASE access to the fields that are not subject to any sensitive security label, and then add the PHI and sensitive PHI security label roles to that base, provided they can show business justification. Unlike PII, which de-identifies all values if a column is considered to contain sensitive information, the sensitive PHI usually only de-identifies the values that are actually sensitive. For PII, only a few counties may contain fewer than 5000 people, but since at least one does, you de-identify all county names. For PHI, only a few diagnoses indicate one of the sensitive conditions, and only those sensitive values are de-identified, usually by returning something like “NOT REPORTABLE” instead. The rest of the regular, not sensitive PHI fields are available to people who have access to the regular PHI information, but not access to sensitive PHI.
This usually required the maintenance of a PHI sensitive indicator on a reference table. If the reference table is an industry standard, such as ICD10 Diagnosis Codes, then the code itself, as well as the description, must be de-identified. This means that the reference table must be assigned a surrogate key, so that the natural key (the ICD10 code) won’t be propagated to the business tables where there is no PHI sensitive indicator available for the database to de-identify it without forcing a join to the reference table. You must implement the processes and roles to maintain these sensitivity flags. You must also decide the default value for these flags when receiving new data. Should new values be considered sensitive by default, or not sensitive by default until they are reviewed? Again, this is a decision for the business and legal, not for IT.
All of these decisions should be made at the corporate level and documented in your EAG artifacts, including the ELDM. You don’t want to have inconsistent implementations across the enterprise, nor do you want project resources spending time trying to figure this out on their own. Make it clear; make it easy.
Payment Card Industry Information (PCI)
Payment Card Industry (PCI) information includes card numbers, expiration dates, and card verification numbers (CVN). Companies that process credit card payments are subject to a number of regulatory requirements surrounding this information. Non-compliance can result in expensive fines and loss of customer trust.
Because PCI deals with the account identification information rather than account balances, many companies elect to subject banking routing and transit and account numbers to the same security requirements, placing them under the same security label. This isn’t required by PCI regulations, but isn’t a bad approach. After all, if people have no need to see your credit card account numbers, why would they need to see your checking account numbers? With EFT, a routing and checking account number have much the same fraud risk as a credit card number.
Like PHI and PII, access to PCI data is a role that is added on top of BASE access. Without PCI access, the contents of the fields are de-identified to the end user, typically by hiding the data and returning blanks instead.
Other security labels
There are many other potential security labels:
- Financial. The PCI label only covers financial account numbers. This label would cover salaries, family income, sales commissions, and other wealth-related information.
- Employee. At most companies, there are many people who have a business reason to see customer records. However, there is usually a caveat that stipulates that only a few highly trusted employees can view the customer records of employees.
- VIP. At many companies, some records will relate to VIP customers: prominent politicians, sports figures, and celebrities. To reduce the temptation to view these records, they may be given a special security label, and require special justification to access.
- Personal harm. In cases of real or potential domestic abuse, you may be required to provide extra protection for the information related to person in danger, especially place of residence.
Data security classifications
Once you have your data sensitivity labels precisely defined, you will also need to define classifications of data treatment. Each classification is based on the risk to the company if the data is exposed. Typical data sensitivity classifications might include:
- Publically available information. You may not intend for the data to be exposed, but there is no risk to the company if this data is exposed, because it is generally available elsewhere. For example, information about the company’s publically traded stock price or the publically available financial statement.
- Internal information. Data which isn’t publically available, but which has no real risk to the company if exposed. For example, a log of the times you ran an internal job.
- Restricted information. Information that is sensitive in nature, and can adversely affect the company if exposed, but is often shared as part of regular business operations with well-defined access control structures in place. This might include PII, PHI, and PCI information.
- Confidential information. Information that could seriously affect the company, and is never exposed in the normal course of business, such as strategic marketing plans, planned mergers and acquisitions, and new product development.
Another way of looking at this is:

These are, of course, just examples of classifications. Your own data classifications will be much more formal, or mandated by the regulatory body you are using for compliance. HITRUST, for example, has specific verbiage that you must use for your data classifications as well as specific disclosures and handling treatments for each.
Once you’ve defined these classifications, you need to map your data labels to your classifications, showing how each type of sensitive data is treated. Many labels will share the same classification.
An approach to data security compliance
We’ve discussed briefly how security is integrated into many different IT functions, such as data modeling, a business glossary, data lineage, data profiling, data quality, data masking, and archiving. It’s worth taking a moment to discuss the order in which each of those functions must be implemented when initially spinning up an information security compliance program:
- Data label and classification definition. Before you can go looking for data and implementing security roles, you first need to study the regulatory requirements, making sure you document all the relevant terminology and business rules. Many of the regulatory bodies are more than a little vague. You’ll need to work with your business and legal areas to clarify any gray areas. These definitions should be incorporated into your corporate glossary and EAG artifacts.
- Data discovery. Once you understand what you’re looking for, you have to…, well…, go look for it. You need to find all the locations where sensitive information is physically stored, including relational databases, flat files on shared drives, and unstructured data sources. This discovery needs to be an ongoing and recurring automated process which updates a central repository. The discovery process needs to have a documented owner responsible for its operation. The data discovery process needs to document:
- What label or labels the data falls under
- Where you found it (the repository location, and the location within the repository)
- What processes create, read, update or delete the data
- Who is responsible for the data, the data steward who owns it
- The access controls that are in place for the data
- Data dictionary. It’s unlikely that every data element in every physical repository in your organization will be mapped to your enterprise logical data model (ELDM). However, you should definitely map the sensitive subsets of those repositories. At this point, your concerned more with security labels than with classifications.
- Data lineage/genealogy. It is unlikely that every sensitive data element was created within the repository where you found it. Like most of your operational data, sensitive information flows from one location to another throughout your integrated suite of applications. Once you have identified all the sensitive data, you should document how this data flows from repository to repository. Likely this will lead to the discovery of even more locations where the sensitive data resides. This is the chain of custody of the sensitive information. The entire lifecycle of sensitive data, from creation to its end-of-life must be documented and secured.
- Implement and enforce. Put the data access controls in place, the technical details and the EAG policies, standards, processes and roles. This includes working with the other IT domains to ensure the information security function integrates smoothly with application and technology security functions. This is the point where the classifications become important, as different controls will be defined for the different security classifications.
- Monitoring and control. Like any IT function, you can’t manage what you don’t measure. Refer back to the section on page 62 for more information about how measurements are required part of any a mature process. If you’re audited, you must provide evidence that you have consistently adhered to your security function governance policies and processes over time. Even if you consistently followed your policies and processes to the letter, if you can’t easily provide that evidence, you will fail the audit and be subject to penalties. The audit requirements should be built into your policies and processes, so that they are well-defined requirements, known throughout the enterprise. Audit by design and by default.
- Reporting and event notification. Although this might be considered a natural part of monitoring, I’m calling it out for specific attention. Audit data is irrelevant and a waste of time unless there is some way to communicate it and some role assigned the responsibility of looking at it. If serious events occur, the information should automatically be pushed to a data steward for security compliance review and to any others who might need to know. Ideally, this reporting mechanism is the means by which you will provide the evidence of your compliance to the auditors, and the feedback with allows you to improve your processes over time. These audit logs can also be mined analytically, identifying risky behaviors such as a valid ID accessing from a remote IP address, and outliers such as off-hour access by resources who normally don’t work those shifts.
Aging and archiving information
The last function in the information management lifecycle of the framework is aging and archiving – data end-of-life. You can perform end-of-life functions for data either alongside software end-of life functions (migrating or simply terminating and application) or as a standalone process. The two key data end-of-life functions are archiving and aging.
- Archiving involves making a copy of some portion of the repository’s data somewhere else. This is not the same as regular data backups for disaster recovery purposes. Those have nothing to do with end-of-life. Nor has it anything to do with tiered storage, which relegates lesser-used data to lower cost storage, while still keeping it actively available to the source application. Archiving is not an IT-centric application continuity function. It’s a business-centric retention of data that may be needed later for business purposes. The archive target is usually some less-expensive platform, possibly even offsite storage, though that is less common with archives than with backups.
- Aging involves deleting data from a repository. This can be either an operational or an analytical repository, and is usually preceded by first archiving the data to be deleted.
From an enterprise perspective, it’s important to have an information end-of-life solution in place. A recent storage assessment survey conducted by NTP Software32 revealed that 61.6% of file data stored on primary storage systems had not been accessed in more than six months, 49% had not been accessed in over a year, and 19.1% of physical storage is consumed by duplicate files. Gartner estimates that the average annual growth for physical data storage is 30% to 60%,33 and that a well-designed archiving strategy can prevent 67% of that annual growth. Those cost savings, they claim, include the full operating cost, not just the cost of archiving.
Clearly, while aging and archiving functions don’t have the flash and sizzle of something like predictive modeling, there’s real business value in an enterprise aging and archiving solution. Eliminating unused data from operational and analytical information systems makes the resulting repositories smaller and faster, and makes the backups take less time and less storage. Ideally, you’ll leverage one corporate data archiving solution to serve many different application repositories. Such an enterprise solution, however, requires vision, planning, and effective oversight. It takes a holistic enterprise architecture and governance program. A functional framework ensures that this valuable function isn’t overlooked.
Don’t consider the archive a permanent retention. You will eventually want to age data out of the archiving solution when it has outlived its usefulness. This suggestion isn’t universally popular with all business users, but it’s a very good idea to have policies to that effect in place at the corporate level. An aging solution is critical to reduce overall litigation risk. It is perfectly acceptable to reply to a legal inquiry with words to the effect that “our regular retention policies, documented here, deleted that information over a year ago…” Once the data is requested, if that data still exists somewhere, even on one data-hoarding senior business analyst’s local workstation drive, you are legally obligated to turn the information over and retain it indefinitely until the legal hold is released. Yes, there is value to old data, but there’s also risk, and the acceptable risk-reward balance needs to be determined and policies created at a corporate level. Retention risk isn’t a department-by-department decision. You need an enterprise aging and archiving policy.
How long should you retain data, then? There is no way I’m going to give you an answer to that. Many agencies compare the declining utility of old data to the continuing risk of retaining it, and incorporate this into regulatory requirements. Patient health information must be retained by healthcare providers for the life of the patient plus ten years. Financial industry transaction history must be retained for seven years. You need to have a conversation that involves your business users, your security compliance office, and your legal department. Between the three of those groups, a consensus must be reached. The resulting enterprise policy is sometimes known as a Records Retention Schedule (RRS). Retention periods are not an IT decision.
Also, keep in mind that there are many different types of data. There is customer information, product information, and network information. There is transaction “flow” data, and point-in-time “state” data. There is core operationally modeled tables and copies of the information stored in other repositories. Your legal retention requirements don’t necessarily include all of this information. You may need sales history including product name and sales price, but not need the history of the product pricing changes over time. You may need daily account balances for one year, monthly back to three years, and only year-end balanced back to seven years. Make sure and work out with the subject matter experts mentioned earlier the details of the retention requirements, and document and enforce that decision at the enterprise level. Your corporate record retention policy should specify what data is retained, what kind of access is required, and what encryption, if any, is necessary.
There are many commercial data archiving solutions, with many different approaches and feature/function. One way of grouping them is by dividing them into two broad categories:
- Those that offload data into less-expensive application-specific archive repositories while retaining the same data structures and values. Unfortunately, few business analysts will be comfortable accessing raw application data without going through the application screens, and you’ll need some level of operational staff to administrate this platform and the regular archiving process. Even if the archiving software is managed at the corporate level, the repository and feeds are application-specific. Still, as noted above, you can easily make a business case for this approach. This is especially true if the archive implementation is an offline solution such as tape backups. A Clipper group study found that the total cost of ownership of a disk-based solution was 26 times that of a tape-based solution.34
- Those that integrate the application data into an enterprise analytical repository like a data warehouse. Don’t forget about your enterprise data warehouse when considering application archives. They often contain most of the key business information already integrated with other data from applications across the enterprise, in a centrally managed, active repository with reporting and analytical tools already in place, and a body of analysts already trained in accessing it. Moreover, the data feeds to this “archive” repository are probably already in place. It may be much less expensive overall to add the few extra fields you need archived to the warehouse than to stand up an independent application-specific archiving solution.
Traditionally a data warehouse isn’t the system of record for operational data, but in many cases, where the legal retention requirements are being held in the warehouse rather than the source applications, the warehouse can actually be designated as the system of record for legal inquiries that span the enterprise or exceed the retention of the operational applications.
More and more archiving solutions use big data repositories as the archiving target, which has a lower initial cost than integrating into a formally managed schema such as a warehouse. However, dropping the source system data structures and values into these repositories still produces application-specific archive repositories. This is an inexpensive single-application archiving solution, but any cross-application mining will require each end user to perform the types of integration that would have been necessary to put the data in a warehouse.
Don’t confuse backup/recovery functionality with archiving/retrieval. According to one survey, 57% of respondents say they use their regular backup solution to provide archiving functionality.35 Backup solutions provide short-term operational recovery functionality, not long-term retention and retrieval functionality. Backups don’t integrate history across time, are typically not immediately accessible, require more overall storage to store the same amount of retention, and cannot be used for cross-application analysis.
Note that the process of archiving irrelevant production information is often leveraged as part of a practice of reducing the amount of data in lower environments (development and test). If your production retention is five years, you might use the same basic logic to produce two-year retention in your development environment, and perhaps three-year retention in your test environment. This will reduce the data storage costs and job execution time in development and test.
Information services functions
You may have a specific need to add information services as a standalone functional area outside of the information lifecycle functional area. It’s generally a bad idea to complicate your functional framework by spelling out individual services unless there is something so unique about them that they cannot be said to fall under the same architecture and governance as other information. Is the security for this service significantly different? Is the aging and archiving different? Don’t create an information services functional area just because you have information services. Only create one if you really must manage those functions differently than other information.
Master Data Management (MDM)
One of the few areas that might be a candidate for consideration as its own function in your framework is Master Data Management, or MDM. Consider master data management the practice of managing the master version of data that is used across the enterprise in many applications. This can include many different types of information, but the two most common are customer information and reference tables.
Typically, your operational systems will treat your customers as account relationships, not as globally unique individuals. Since the globally unique individual identifier needs to span all your operational systems, the process needs to happen outside of those systems. At the enterprise level, you need a way to identify a single person across all account relationships.
In the early days of this technology, the term “customer” caused some confusion. What is a customer? These software applications left some ambiguity regarding the line between the people and their account relationships. The term party was coined to address this problem. A “party” is a person, not an account. The party concept includes both biological and legal entities (buildings and belly-buttons). A corporation, after all, is a legal person. If you own your own business as a sole proprietorship and someone sues you and wins, they can lay claim to your “company truck,” but they can also take your comic book collection and game console. When you incorporate, you are creating a new legal entity. If someone sues the company and wins, they can lay claim to assets that belong to the company, but your comic books and game console are safe. You are just an employee of the company. Both you and the corporation have names, addresses, phone numbers, and tax ID numbers. You are both “parties.” The downside of incorporating is that both parties, the biological party and the corporate party, pay taxes.
In healthcare, a provider can be a physician or a hospital. Your supplier may be a person or a manufacturer. You may sell telephone service to a homeowner or to a business. A legal entity and a biological person are interchangeable in so many aspects of our business operations that customer data hubs generally work with both kinds of data. There are two overlapping technologies in this space:
- Customer Data Integration (CDI) is the process of managing the shared customer information across the enterprise. It includes the customer’s name and address, but can also include the customer’s account information and products.
- Master Data Management (MDM) is broader in scope, including managing the master customer information, but also including all the other data assets that need to be managed and shared at the corporate level such as product inventory, network information, and supplier information.
Customer data integration products can act as an analytical hub, collecting information from operational source systems in a one-way flow of information, or they can work bi-directionally and push the “golden copy” information back into the source systems as updates, or, in the most advanced implementations, can actually replace the customer component of the source systems.
The master customer number, also called the master customer index or the party key, can transform a business. It gives you the ability to tell that two different customer accounts are really the same person. It can tell you which vendors are also customers. It can stitch together information for the same person across multiple source systems that use different customer identification numbers. It can allow your internal data to be supplemented with external contextual data such as retail demographics. It can let you easily track the customer lifecycle as prospects are converted to members. Your call center applications can use the customer data hub to look up customer accounts by name and address across all applications. Your billing systems can use the customer data hub to make sure address changes in one system are propagated to all relevant applications or to perform consolidated billing.
At the health insurance company where I currently work, both the providers and the insured members were assigned party keys. One side effect of this assignment was that it allowed us to easily tell when a provider was filing a claim for treating themselves, or writing prescriptions to themselves. It actually isn’t illegal for a doctor to prescribe medicine to themselves, but it is illegal to file a claim and ask an insurance company to pay for it. This information is being fed to our fraud department. Oddly enough, the most commonly self-prescribed drugs weren’t the narcotics or mood altering drugs you might expect. They were anabolic steroids, by quite a large margin.
In the age of competing with information, you must know your customer base. This is a vital function that IT must provide to the business. There are several different levels of complexity available in the implementations of these solutions. Typically, a company will start with the simplest implementation, and gradually evolve into the more mature technologies.
A batch solution for analytics is usually the first kind of customer data integration (CDI) that a company takes on. The operational systems continue doing what they do, and the enterprise data warehouse will implement a solution on the analytics side to scrub, match, and merge names and addresses. In the beginning, this data is only produced via batch processes, and only used by analytical processes. The assignment logic will keep a reference “pointer” to all the source system variations that were assigned to each golden copy key, but that is only for reference purposes.
Over time the operational systems will inevitably recognize the value of a master party key. They’ll want this analytical information made operational. They’ll want it on a high-availability server, exposed via services to the operational world. The data may be assigned in batch processes, but can be read on a transactional basis. Those reference pointers will become very important, as they are the entry points from the source systems.
The operational systems will eventually come to rely on this information so heavily that they require the ability to assign, not just read, party keys in real time. The assignment logic must be made operational. As the processes are hardened and the information becomes increasingly trusted, the source systems will want the data integration to become bi-directional, so that, when an address is changed in the CDI/MDM tool, it is automatically updated on the source systems as well, using those reference pointers. Finally, the CDI/MDM will take over responsibility as the system of record for the information it integrates. The source systems will no longer update local copies of information, but will look directly to the CDI/MDM solution for the data in real time throughout its processing.
I don’t know of any company that goes through all of these stages of CDI/MDM solutions evolution, but most progress through at least two or three. You will probably need to start with a simpler solution, but keep in mind what your long-term strategy will eventually look like, minimizing the need for redesign as you evolve. Earlier, in the modeling function, we discussed the use of APIs to isolate one subject area from another in analytical systems. Later in the data delivery function, we discussed separating data from business logic in operational systems using Data as a Service (DaaS). Both of these techniques have many advantages, one of which is that it decouples the data implementation from the rest of your systems, allowing you to snap in a new solution with far less effort. It is possible to design a home-grown solution in such a way that it can easily be unplugged and replaced with a commercial product at a later date. This strategic design is the responsibility of the EAG architects.
The other common implementation of master data management is the management of the master version of reference data. Many global and internal code/descriptions are used throughout the enterprise. These code sets change over time and must be maintained. Master data management tools detect when unknown values appear in various local repositories, and include tools to research and cleanse the data, maintaining a single version of the truth for master data.
Managing reference data is a large chunk of the work performed by a typical QA team. The MDM tools help manage this data in a single location using automated workflow management tools.
Mastered customer and reference information is an extremely valuable corporate asset, critically integral to so many data repositories, applications, and business processes. It’s possible that you’ll want to develop a specific strategy plan and roadmap, specific policies, standards, processes, and roles at the enterprise level in order to manage customer information effectively on behalf of the business. The functional framework gives you the tools to do this.