
Measurement and Verification Models for Cost-Effective Energy-Efficient Retrofitting
E. Burman and D. Mumovic, University College London (UCL), London, United Kingdom
Abstract
This chapter provides a review of the main protocols and standards used in the construction industry for measurement and verification (M&V) of retrofit projects. Various M&V options have been reviewed. Key drivers for and barriers against M&V are also discussed. Improving energy efficiency of the existing building stock and energy performance contracting are among the key drivers for M&V. On the other hand, poor energy performance data, technical risks associated with longitudinal changes in building context, and the cost and complexity of M&V are key barriers that must be addressed. It is suggested that advanced wireless monitoring platforms for energy, the Indoor Environmental Quality, and behavioral parameters along with integrated software platforms are required to facilitate effective implementation of M&V.
Keywords
Buildings; retrofit; measurement and verification; IPMVP; energy performance contracts
Nomenclature for Measurement and Verification Terms
CVRMSE Coefficient of variation of the root mean square error
ECM Energy conservation measure
F Approximate percentage of the baseline energy use saved
FEMP Federal Energy Management Program
IPMVP International Performance Measurement and Verification Protocol
M Number of data points (periods) in postretrofit analysis
M&V Measurement and verification
N Number of data points (periods) in the baseline period
n Number of data points used for calibration (n = 8760 for hourly calibration, n = 12 for monthly calibration)
NMBE Normalized mean bias error
SEP Superior Energy Performance protocol
t t-statistic; a ratio that shows the size of the error relative to the variation in sample data
U Uncertainty in estimated energy saving expressed as a percentage of the estimated saving
![]() Average hourly or monthly energy use for the measurement period
Average hourly or monthly energy use for the measurement period
7.1 Introduction
Measurement and verification (M&V) of the operational savings achieved from retrofit projects is a key process that can increase the confidence of customers and investors in energy efficiency improvements of building stock and perpetuate a cycle of continuous improvement. This is crucially important as the success of the governments in developed countries, and increasingly in fast-growing economies such as BRICS countries (Brazil, Russia, India, China, and South Africa), in meeting their energy and carbon targets in the building sector depends on large-scale adoption of retrofit projects for existing buildings.
This chapter explains the fundamental principles of M&V and provides a brief review of the main M&V protocols and standards used in the industry. It also identifies the key drivers for and barriers against M&V and explores how the technical barriers may be tackled by using advanced monitoring platforms that can reduce the complexity and costs associated with M&V.
The aim of the chapter is to provide the foundations and set the scene for the next chapters, which explore M&V further and include a number of case studies.
7.2 Fundamental Principles of Measurement and Verification
It is generally important to ensure the energy and environmental improvements expected from energy conservation measures (ECMs) are delivered in practice. The aim of M&V is to verify these improvements based on actual performance of buildings after system installation and construction work is completed. M&V usually takes place after the building has reached stable operation. For new buildings and major renovations, this is usually after the first year of operation. It is often necessary to fine-tune and optimize systems and building performance during the first year. For simple ECM measures that do not affect whole-building performance and can be assessed in isolation, it may be possible to achieve steady mode of operation sooner. In either case, it is important to draw up an M&V plan in advance, and carry out the preparation work before the building performance is stabilized. An M&V plan must clearly define the following:
![]() the boundary for the M&V activities
the boundary for the M&V activities
![]() the baseline performance and how this is calculated
the baseline performance and how this is calculated
![]() the methods used to establish the performance after implementation of the ECMs
the methods used to establish the performance after implementation of the ECMs
![]() the associated risks and mitigation measures
the associated risks and mitigation measures
The M&V plan may be drawn up to verify actual performance and savings once, or be used for frequent verification in regular time intervals to assess the long-term performance. Long-term and regular M&V often take place in performance-based contracts.
The following general equation is used to determine the energy savings achieved from ECMs in retrofit projects:
(7.1)
It is necessary to adjust the baseline or actual performance to allow for differences in weather conditions and changes in the building context before and after retrofit. These changes may include changes in occupancy pattern, schedules of operation, control settings, and so on. M&V protocols and standards define methods that can be used for these adjustments. However, depending on the building specific context, it may be necessary to make adjustments that are not covered in the existing guidelines. It is therefore important to define the adjustments applied to building performance along with the supportive evidence and justifications in the M&V plan. All parties involved should review and agree upon these adjustments in advance to minimize the risk of potential disputes after M&V activities are completed.
Finally, an important component of M&V is to define the monitoring points required to establish baseline and postretrofit performance along with the respective measurement methods. Where M&V is not exclusive to an isolated system and covers the whole building, the number of monitoring points and measurement equipment may significantly add to the project costs and complexity. This is a major challenge facing M&V projects. Best practice is to integrate M&V into the plan of works from the outset of a construction or retrofit project. For example, the monitoring points can be carefully defined in the building management system (BMS) to be used for both building control and M&V. This can significantly reduce the number of additional monitoring points required exclusively for M&V. It is also useful to balance the costs of M&V against the performance risk associated with a project. The performance risk associated with a retrofit project can be defined as follows:
(7.2)
Consequently, if the estimated saving and the associated uncertainty are high, there is a strong case for an extensive M&V that involves a lot of measurements. More simplified and isolated M&V plans that do not consider whole-building performance may be deemed acceptable when the retrofit measures are simple, the savings are not significant compared to the baseline performance, and the uncertainty of savings is relatively low. Details of the M&V plan must be reviewed and agreed upon by all parties involved in a project to make sure the balance between project costs and the required accuracy is reasonable.
7.3 Measurement and Verification Protocols & Standards
This section provides a brief overview of the main M&V protocols and standards that are used in the industry.
7.3.1 International Performance Measurement and Verification Protocol
The International Performance Measurement and Verification Protocol (IPMVP) is the single-most recognized M&V protocol in the industry, and is used in more than 40 countries. This protocol sets out a framework to determine energy and water savings achieved compared to baselines defined for new buildings or retrofit projects. It was originally instigated by the U.S. Department of Energy (DOE) and developed by a coalition of international organizations to respond to the calls for a standardized protocol to verify the savings achieved from energy conservation measures. The IPMVP is currently maintained by the Efficiency Valuation Organization (EVO), a nonprofit organization that promotes energy and water efficiency. The EVO also promotes the implementation of M&V by qualified experts that have achieved the status of Certified Measurement and Verification Professional (CMVP) awarded by the Association of Energy Engineers (AEE) (EVO, 2016).
Volume I of the IPMVP defines the principal concepts of M&V and available options for determining energy and water savings. It also provides examples of various applications of M&V (EVO, 2012). Volume II provides the concepts and practices for improved indoor environmental quality (IEQ) in the context of energy efficiency projects (DOE, 2002). There are concerns about unintended consequences of improving energy efficiency and de-carbonization of building stock (Shrubsole et al., 2014). For example, improving the airtightness of a building may increase the risk of overheating in summer. It is important that the operational energy performance targets are not achieved by compromising the occupants’ thermal comfort or the indoor air quality. Volume II of the IPMVP follows a holistic approach to energy efficiency and the IEQ to make sure the pursuit of energy efficiency does not compromise the IEQ performance. Finally, Volume III of the IPMVP provides the concepts and practices for determining energy saving in new constructions (Part I), and in the applications that involve renewable energy technologies (Part II), (EVO, 2006; IPMVP Inc., 2003).
7.3.2 Federal Energy Management Program
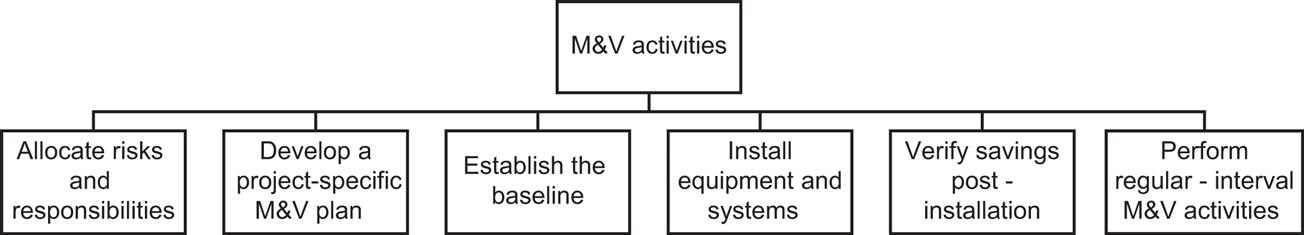
The U.S. Federal Energy Management Program (FEMP) promotes energy efficiency and the use of renewable energy resources in federal buildings, which constitute a large component of energy consumption in the United States. The M&V guidelines issued by the U.S. DOE are used for this program (DOE, 2015). These guidelines provide a structured framework to determine and verify energy savings. This M&V framework includes the activities shown in Fig. 7.1. A major focus of the FEMP is performance-based contracts and therefore it takes a long-term view about performance of ECMs and requires regular M&V activities after the initial verification.
The M&V guidelines for FEMP also include guidance and examples for specific ECMs related to building envelope, heating, ventilation and air conditioning (HVAC) systems, and renewable technologies. The FEMP M&V guidelines contain detailed producers for applying the IPMVP concepts to federal buildings. The principal M&V methods used in the FEMP are therefore underpinned by the IPMVP.
7.3.3 ASHRAE (American Society of Heating, Refrigerating, and Air-Conditioning Engineers) Guideline 14
ASHRAE Guideline 14 defines the requirements for instrumentations, data management, measurement methods, and building performance simulations used to determine energy and demand savings (ASHRAE, 2002). It also describes methods to analyze the uncertainties associated with measurements and modeling. The overall uncertainty of the estimated savings must be below the thresholds defined in this guideline. ASHRAE Guideline 14 covers the technical foundations of M&V and does not deal with the wider aspects of M&V such as M&V framework and plans, risks, costs, and third-party verification. There is a significant overlap between the methods described in ASHRAE Guideline 14 and the M&V options defined in the IPMVP. This will be subsequently explained in this chapter.
7.3.4 ISO (International Standards Organization) 50015
ISO 50015 (2014) follows the introduction of ISO 50001 (2011) for energy management systems. ISO 50015 specifically covers measurement and verification of energy performance of organizations. This international standard defines the terms of reference and sets out general principles for M&V in several organizational contexts. It can be used for the M&V of energy performance or energy performance improvement for all or part of an organization. Energy performance improvement in the context of this standard can be achieved through technological, managerial or operational, behavioral, economical, or other changes. The scope of ISO 50015 is thus broader than the abovementioned M&V protocols. It does not provide specific methods for M&V at the building level. Organizations that follow the IPMVP guidelines to verify the savings achieved as a result of implementing ECMs in their buildings can satisfy most of the requirements of this standard. There are private companies accredited to provide certification to this standard.
7.3.5 Superior Energy Performance Protocol
The Superior Energy Performance (SEP) protocol was developed by several members of the U.S. Council for Energy-Efficient Manufacturing (CEEM) in 2012 and is administered by the U.S. DOE (DOE, 2012). It is meant to help organizations that conform to the ISO 50001 standard and have an energy management system in place to verify the savings achieved as a result of implementing this standard. It is currently used in the United States and Canada, and verification bodies accredited by the American National Standards Institute (ANSI) can perform audits on facilities to confirm compliance with the SEP requirements. Although the SEP protocol was primarily developed for industrial facilities, it can also be used for commercial buildings.
7.4 Measurement and Verification Options
This section provides a brief overview of the most commonly used M&V options defined by the IPMVP. The methods explained in ASHRAE Guideline 14 are also closely related to the IPMVP options and support them, except the IPMVP option for retrofit isolation based on key parameter measurement.
7.4.1 Retrofit Isolation: Key Parameter Measurement
This option deals with simple ECMs that can be isolated from the rest of the building and assessed individually. The key performance parameters that define the energy use of the system are measured while a number of other parameters may be estimated. A typical example of a retrofit measure that can be isolated from other systems is replacement of lighting installations with more efficient lights. This can increase the heating demand and reduce cooling loads. These interactive effects that are related to the impact of the ECM on other systems within the building can also be estimated. Estimations can be made by using historical data, manufacturer’s specification, or engineering judgment agreed upon by all parties involved in the contract. The saving error related to estimations must also be evaluated.
7.4.2 Retrofit Isolation: All-Parameter Measurement
In this option, energy performance of the system affected by the ECM is either directly measured or calculated based on measurements of proxies used for energy performance. All determinants of energy use will be measured. Measurements can be carried out on a short-term or continuous basis, depending on the expected variations in savings and the length of the monitoring period allowed in the contract.
7.4.3 Whole Facility
Where the performance of a building is fundamentally affected by the retrofit, as in deep renovation, or where a number of interrelated ECMs are implemented, it is reasonable to take into account the whole building to determine savings. In this option, energy use of the whole facility is measured before implementing the ECM(s) and after the implementation during the monitoring period allowed in the contract. It is important to ensure comparison between baseline and postretrofit performance is carried out under consistent operating conditions. Consequently, simple adjustments or regressions analysis may be required to adjust the baseline performance. A simple example is the changes in weather conditions before and after retrofit. Heating and cooling degree-days may be used to adjust measured energy. However, if the building context and operating conditions are significantly different before and after retrofit it may be difficult to follow this option. Calibrated energy performance simulation offers more flexibility in such circumstances.
7.4.4 Calibrated Simulation
Similar to the whole facility option, this option takes into account the whole building. However, it utilizes building energy performance simulation (BEPS) to determine savings.
The computer model developed for simulation must be calibrated with the actual performance of the building. Calibration is achieved by adjusting the computer model of a building to reflect the as-built status (e.g., as-built fabric U-values, pressure-test results, and commissioning results of HVAC systems) and actual operating conditions (e.g., occupancy pattern, operational schedules of HVAC systems, temperature set points, and actual weather conditions). The outputs of the adjusted computer model are then compared against the measured performance to check if the model can reasonably reflect actual operation of the building. Once calibration is achieved, the effect of implementing the ECM(s) can be calculated by the computer model.
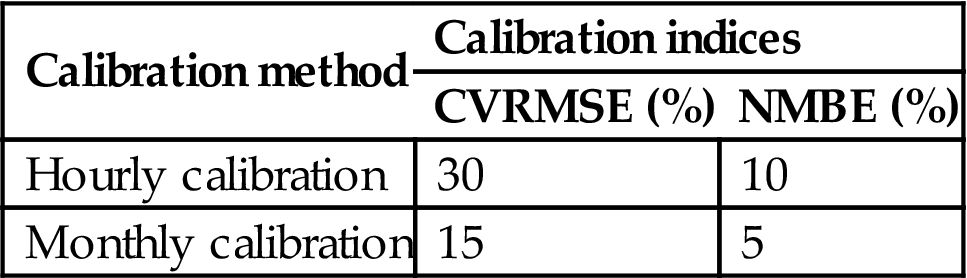
The calibration process is based on hourly or monthly energy data and is determined by the coefficient of variation of the root mean square error (CVRMSE) and normalized mean bias error (NMBE). Table 7.1 provides the calibration criteria used for hourly and monthly calibration of a computer model.
Table 7.1
The IPMVP criteria for calibrated simulation
| Calibration method | Calibration indices | |
| CVRMSE (%) | NMBE (%) | |
| Hourly calibration | 30 | 10 |
| Monthly calibration | 15 | 5 |
The calibration indices are defined as follows:
(7.3)
(7.4)
 (7.4)
(7.4)
The CVRMSE criterion ensures that hourly or monthly energy errors do not cancel out and are all taken into account in the calibration process. The NMBE criterion, on the other hand, looks for systematic bias in the model. Both criteria must therefore be satisfied for calibration. These calibration indices represent how well a mathematical model describes the variability in measured data.
The calibrated simulation option of the IPMVP is underpinned by ASHRAE Guideline 14. ASHRAE Guideline 14 provides the following equation to link the modeling error to the uncertainty associated with the projected saving:
(7.5)
The t-statistic used in Eq. (7.5) would be generally determined, for a given confidence level, by the number of data points in the baseline period and the number of parameters in the baseline model. ASHRAE Guideline 14 (2002, p. 14) provides a table that could be used to infer the t-statistic. For 68% confidence, t = 1 could be used for all numbers of data points and baseline periods. The uncertainty calculated using Eq. (7.5) must not be greater than 50% of annual projected savings at 68% confidence level (ASHRAE, 2002).
7.4.5 Examples for M&V Options
Table 7.2 includes examples for various M&V options reviewed in this chapter. IPMVP Options A and B are simpler and more cost effective. However, if the significance of some determinants of energy use is not clear, Option A must be avoided. Furthermore, if the interactive effects of ECMs are significant or unmeasurable, Options A and B must be avoided. Generally, as the number, complexity, and interaction of ECMs increase, whole-building options (IPMVP Options C and D) become more relevant.
Table 7.2
Examples of M&V options and how the associated savings can be determined
| M&V option | Example | Verification of saving |
| Retrofit isolation: key parameter measurement (IPMVP Option A) | Replacement of existing lighting and magnetic ballasts with more efficient lights and electronic ballasts: lighting circuit powers are measured before and after replacement; operating hours are estimated based on observational studies. The interactive effects of reduction in lighting load on heating and cooling loads are also estimated | Lighting energy before and after retrofit is estimated from measured powers and estimations for hours used. Estimated savings in lighting energy will be adjusted by the estimations of the interactive effects on heating and cooling energy to work out the net savings. The basis of all estimations must be agreed between parties in the contract |
| Retrofit isolation: all-parameter measurement (IPMVP Option B) | Installing renewable energy systems that produce electrical power such as photovoltaics and wind turbines | The energy output of these systems can be directly metered and savings calculated based on utility rates |
| Whole facility (IPMVP Option C) | A number of retrofit and intervention measures implemented including fabric insulation, increasing the efficiency of HVAC equipment, and user training | Saving is verified by measurement of total energy use before and after the retrofit/intervention measures subject to adjustments for changes in weather conditions (it is assumed there is no major change in the number of occupants and building context in this example.) |
| Calibrated simulation (IPMVP Option D) | Deep renovation including fabric improvements, HVAC system replacement, and installation of renewable energy systems | A computer model calibrated with the measured performance is used to calculate the savings. Changes in weather conditions and building context before and after retrofit work can be reflected in the computer model |
7.5 Drivers for and Barriers Against M&V
The rate of new construction in developed countries is around 1% of the total building stock per year (BPIE, 2011). This means that most buildings that are targeted for energy saving and reducing greenhouse gas (GHG) emissions, to mitigate the risks associated with anthropogenic climate change, are existing buildings. Energy performance contracting can play a significant role in saving energy from these buildings. Energy service companies (ESCOs) can help increase energy efficiency by providing information, installing energy-efficient or renewable technologies, and operating and maintaining buildings under long-term contracts. The upfront capital cost required for energy efficiency improvements could be provided by ESCOs or third-party financing arrangements and recouped through savings achieved on energy bills. Energy performance contracting is a fast-growing market in North America. In the European Union, the Energy Efficiency Directive and the recast of the Energy Performance of Buildings Directive (EPBD recast) encourage and facilitate the adoption of performance contracting (The European Parliament and the Council of the EU, 2012; The European Parliament and the Council of the EU, 2010). Performance contracting can also be used as a strong instrument to close the performance gap between actual operation of new constructions and their design baselines, a phenomenon that creates a credibility problem across the construction sector and may have adverse effects on the confidence of investors in energy efficiency improvements (Bordass et al., 2004). M&V is an indispensable component of performance contracts to ensure expected savings are achieved.
However, lack of reliable energy consumption data and technical risks involved in energy performance contracts are perceived to be among the key barriers against these contracts (Basar, 2013). Cost and complexity of M&V is another barrier for most projects especially in the nondomestic sector. Isolating the ECMs from other systems within a building, or adjusting the performance levels to reflect changes in the building context, can be challenging in most projects. Traditionally, regression analysis techniques developed for the whole-facility option (IPMVP Option C) were used to adjust the savings. While accumulation of operational data collated by BMS and advances in data analytics can strengthen this option, there are inherent limitations that may prevent adjustment for some parameters in complex situations. Calibrated simulation (IPMVP Option D) offers more flexibility for adjustments than the whole-facility option. However, achieving calibration in computer models can be a resource-intensive task and requires experienced modelers supported by field investigators who provide reliable data for BEPS. It is essential to develop and utilize advanced platforms for identification of building pathologies, data collection, and seamless transfer of data from buildings to software programs to facilitate the calibration process and reduce the costs associated with M&V.
7.6 Innovative Methods for Cost-Effective M&V: An Overview
This section provides examples of the innovative methods developed to facilitate the M&V process.
7.6.1 Energy Monitoring
Most new buildings have advanced metering strategies that allow for disaggregation of total energy use to specific end-uses such as heating, domestic hot water, cooling, auxiliary energy (energy used for fans, pumps, and control), lighting, and equipment. For example, the metering strategies designed and installed for new nondomestic buildings in the United Kingdom should be able to assign at least 90% of the estimated annual energy consumption of each fuel to end-use categories. Metering provisions should also facilitate benchmarking of energy performance; new buildings with total useful floor area greater than 1000 m2 should have automatic reading and data-collection facilities (HM Government, 2006). The Leadership in Energy and Environmental Design (LEED) sustainability rating system that is used in North America and internationally also sets out stringent requirements for the metering strategies of new buildings and major renovations that facilitate disaggregation and benchmarking (USGBC, 2013). However, existing buildings that are subject to retrofit measures do not necessarily have advanced metering strategies. Total energy use of each fuel is often available through utility bills. However, it is sometimes difficult to get reliable data for end-use categories. This is a major challenge for energy benchmarking and identification of problem areas. Furthermore, verification of savings would be difficult in the absence of a detailed metering strategy. Information about energy end-uses is also necessary to calibrate the computer models, where the calibrated simulation method is pursued for M&V.
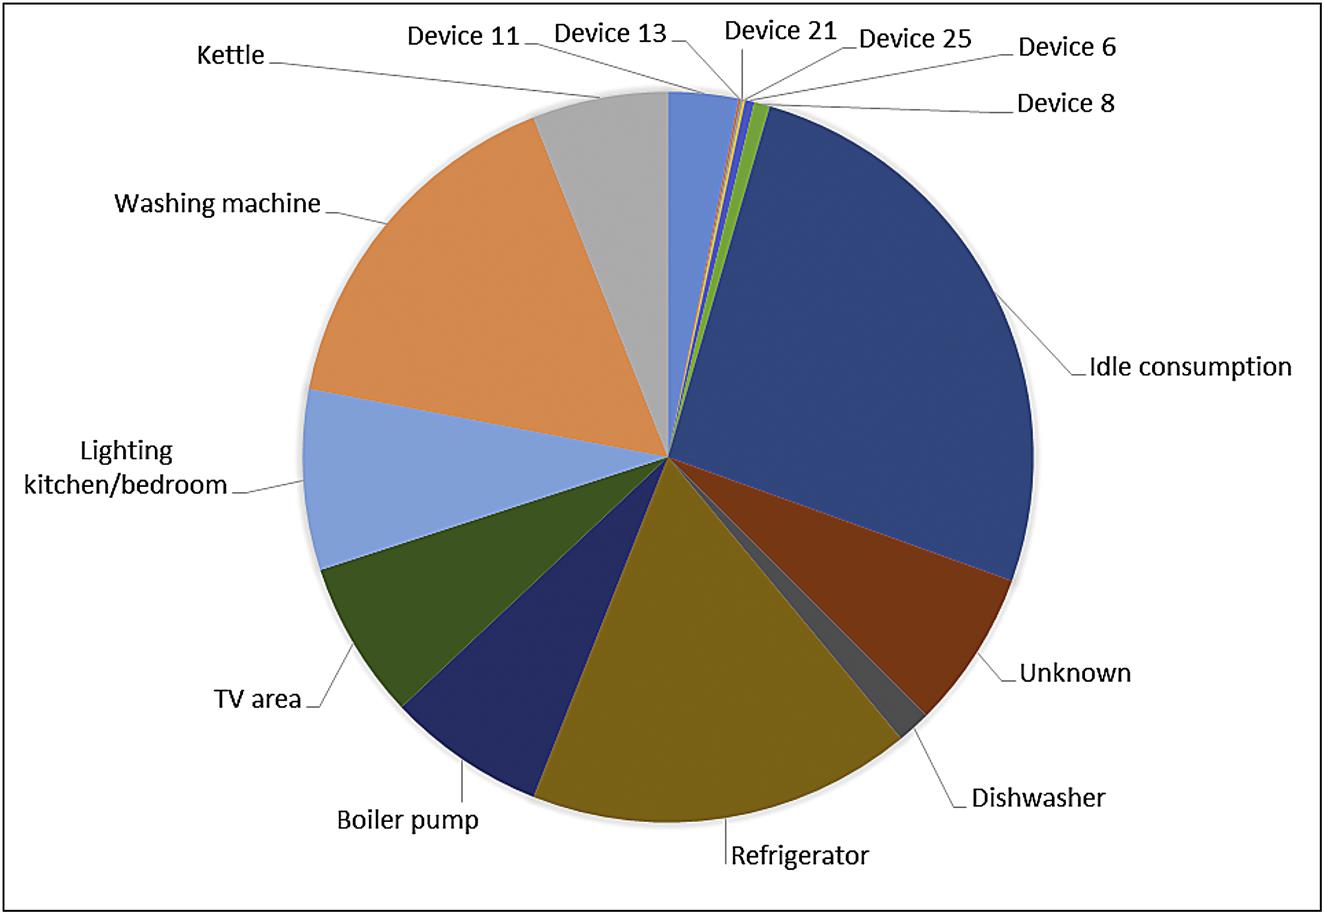
It is sometimes reasonable to install submeters to measure the energy use of key determinants of energy performance (e.g., the chiller’s energy supply in an air-conditioned office building). Clamp meters or portable electricity profilers, used at the distribution board for short period of time during typical operation of the building in accordance with relevant health and safety regulations, can provide useful insights about distribution of energy. More innovative approaches are being explored for energy data disaggregation. Fig. 7.2 shows the result of a disaggregation algorithm that is based on detailed monitoring of mains electrical supply (single-point measurement) to figure out and separate key energy loads based on a learning process. The learning process takes into account the effects of the loads on the mains supply and the timing and frequency of the effect. This approach can significantly reduce the metering requirements while providing useful information about energy use of the key loads within a building.
7.6.2 Monitoring of the Indoor Environmental Quality
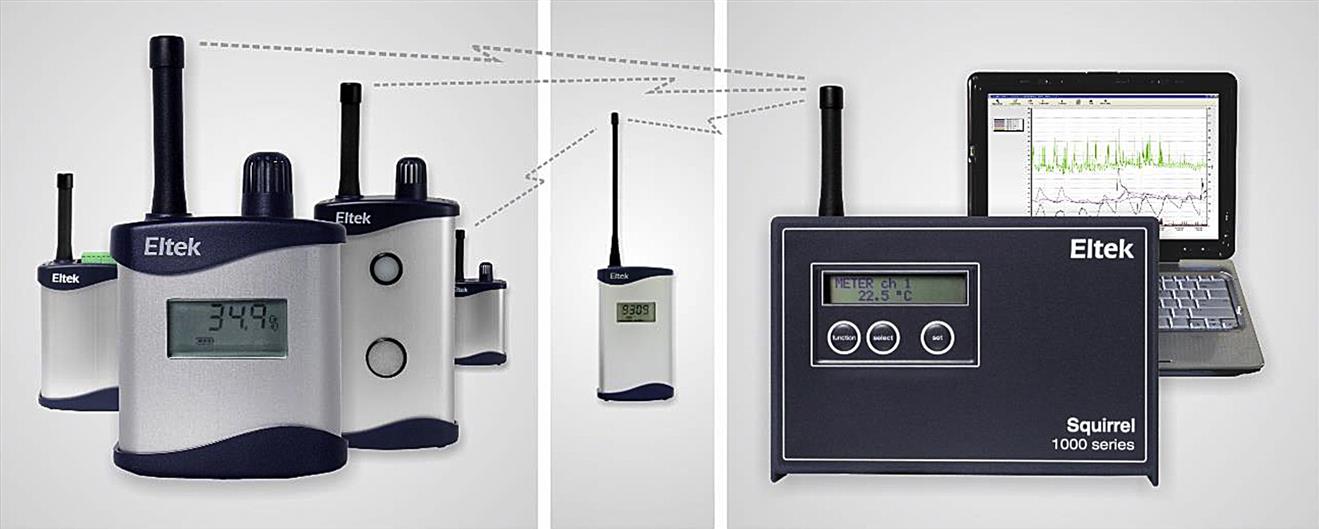
Monitoring of the indoor environmental quality (IEQ) is important to ensure that improvement in energy performance has not been achieved at the expense of the IEQ. Trend logging of the IEQ parameters is also necessary to account for changes in operating conditions when the postretrofit performance is compared with the baseline to verify savings. Monitoring of indoor temperatures and relative humidity can establish thermal comfort conditions. Carbon dioxide concentrations are often used as proxy for the indoor air quality. If the occupancy details are known, CO2 concentrations may also be used to infer the ventilation rates (CIBSE, 2005). Illuminance levels can be recorded and used to assess the performance of the lighting system. The operation of electrical lights can also provide information about occupancy patterns. The IEQ data can be used to calibrate the computer models where the calibrated simulation method is used for a project. The data can be collated via BMS or separate sensors installed for M&V. Fig. 7.3 shows an example of a wireless data-logging and alarm generation system based on ultrahigh frequencies (UHF) that was used by the authors in previous research (Burman et al., 2014). The transmitters are located at the monitoring points while the repeater and the receiver/data logger can be far from the monitoring points. A central receiver can record the data received from multiple transmitters. This data is remotely accessible via a GSM modem integrated into the receiver. The alarm generation system will let users know if there is any problem with the transmitters and data communication. Only the central receiver needs to be plugged into a power socket. It can be located in the facility manager’s office or the central plantroom. This system is not reliant on the local WiFi network and can provide a self-sufficient solution for wireless IEQ monitoring.
There is also a recognition among software developers for BEPS that it is necessary to facilitate transfer of data from monitoring platforms to BEPS platforms. For example, the IES software has recently developed a new module to link together various sources of operational data (from smart meters, BMS, and environmental sensors) and feed them back to the design models. This information can be used for model calibration and building diagnostics (IES, 2012). Another example is Apidae, a cloud-based platform to perform EnergyPlus simulations. It provides a calibrator module that facilitates transfer of operational data to BEPS. The calibrator module also uses the CVRMSE between the measured data and the simulation outputs as a fitness function, and its algorithms attempt to modify the parameter setting to minimize the CVRMSE (Apidae Labs, 2016).
7.6.3 Occupancy Monitoring
Investigations into the effects of occupant behavior on building energy use have found that behavioral parameters significantly influence energy use in both domestic and nondomestic sectors and vary according to the building type, size, and climate (Sunikka-Blank and Galvin, 2012; Azar and Menassa, 2012; Dasgupta et al., 2012). Longitudinal changes in behavioral parameters are also important in the context of retrofit projects and adjustments made to M&V calculations to determine savings. Occupant behavior can change the IEQ settings that can be captured by the sensory equipment. Determination of the number of occupants, occupancy pattern, and the small power used by occupants is also a major challenge. Depending on the context, proxies such as carbon dioxide concentrations and illuminance levels might be used to infer information about building occupancy. Records of WiFi connections in office-type buildings can also be used to infer occupancy (Martani et al., 2012). Fusion of data from several simple and cost-effective methods can lead to a better understanding of occupant behavior and energy use. For example, the following methods were tested in an office building to collate information about occupancy (Lam et al., 2014):
![]() clip-based pedometers with Bluetooth dongle to infer occupancy levels
clip-based pedometers with Bluetooth dongle to infer occupancy levels
![]() computer idle-time logging program to record the time that neither keyboard nor mouse is used within 5 min
computer idle-time logging program to record the time that neither keyboard nor mouse is used within 5 min
![]() wireless smart meters to collect data about energy use of each occupant’s office appliances.
wireless smart meters to collect data about energy use of each occupant’s office appliances.
This information along with other energy and IEQ data enabled computer model calibration with NMBE of 1.27% and CVRMSE of 6.01%, significantly lower than the IPMVP limits (Table 7.1).
This level of monitoring may not be always practical for the whole building, especially in large nondomestic buildings. Nonetheless, these methods could be used in sample zones that are representatively chosen to provide feedback for model calibration and M&V.
7.7 Summary
There are major drivers for retrofitting of existing buildings. These include the national and regional energy policies that target existing buildings, and the calls for energy performance contracting. Measurement and Verification (M&V) of the savings achieved after retrofit is a necessary step to ensure the environmental and economic targets have been achieved. This chapter provided a review of the main M&V protocols and standards. The International Performance Measurement and Verification Protocol (IPMVP) underpins most M&V frameworks that are used in the industry. This protocol provides four options for M&V: Retrofit isolation (key parameter measurement), retrofit isolation (all-parameter measurement), whole facility, and calibrated simulation. These options were briefly reviewed in this chapter.
It was explained that lack of reliable energy data and information about changes in building context before and after retrofit may jeopardize measurement and verification of savings. This can in turn reduce the confidence of building owners and third-party finance providers to invest in retrofit projects.
Option D of the IPMVP (calibrated simulation) provides the flexibility to make adjustments for longitudinal changes in weather conditions and building context, and to carry out a comparison between preretrofit and postretrofit performance under consistent operating conditions. However, calibration of BEPS can be resource intensive and may add to project cost and complexity. It is therefore important to strike the right balance between project costs and the accuracy targeted for M&V.
There is also a trend towards development of cost-effective wireless data-collection facilities and seamless transfer of operational data to computer models used at design stages to update these models for M&V. Using advanced monitoring techniques and software platforms that facilitate the calibration process can support effective implementation of M&V.