
2
Scaling Up
2.1. As societies choose
The most common situation is to have a local innovation whose area of distribution needs to be expanded. The various approaches for doing this will be examined here, with an aim for maximum potential, i.e. global expansion.
David Edgerton’s work progresses with the following conclusion based on historical analysis of innovations; “the greater part of change takes place through transfer from one location to another” [EDG 13, p. 274]. A situation of “techno-globalism” is rather exceptional, with respect to “techno-nationalist” demands, e.g. in attributing the invention of the assembly line to the United States; they are not generally recognized by historic criticism. These are quite often rather old techniques that contribute the most significant increase to well-being. The number of major therapies invented in the period 2000–2015 is average for the previous periods; however, life expectancy has increased more for people all over the planet than in any other period in human history: it is therefore more widespread uses of known therapies that give rise to these good results.
Let us give two examples mentioned by Edgerton, indicating the long period in which major innovations were involved: the “taxi-bike” and the naval shell [EDG 13]. Living in Nicaragua in 2010, he saw the development of taxi-bikes, popularized by Colombian soap operas. The local name given to this means of transport is that of one of the heroes from these television series who drives a taxi-bike. The historian of technology places the invention of the rickshaw in Japan in 1869. A French resident of Shanghai brought it to China in 1873. The transport of people with these ultra-light vehicles would give rise to the bajaj in Indonesia, the tuk-tuk in Thailand, the rickshaw in India, etc., even the caponnera in Guatemala in 2010. The rickshaw disappeared in Japan around 1920, with better service from public means of transport. A narrow spread for the network of public transport is one factor that explains the expansion of taxi-bikes carrying travelers from their starting point to the train station.
In 1824, in Brest harbor, Henri-Joseph Paixhans experimented with the launch of a flat-trajectory missile, sinking a downgraded warship, the Pacificateur. Sea battles were fought at that time with short-distance cannons, with cannonballs that caused relatively little damage. The new shell penetrated wooden hulls and exploded, bringing a quick end to these multideck warships, an easy target due to their height out of the water. The 1824 experiment put an end to a technological era of the sail, the wooden hull and parallel ship warfare with cannons on several superposed decks. This was a radical innovation, adopted first by the French navy, then by the British and American navies. However, the complete transformation of naval forces was only completed in the early 20th Century with armored squadrons. The cycle was then repeated with the introduction of aircraft carriers in the 1920s, leaving the flotsam and jetsam of the battleship to sink to the depths of the ocean. The first steel battleship did not arrive until 1876, after entire fleets had been sunk, like the Turkish fleet in Sinop in 1853, greatly validating the 1824 experiment.
The times for innovation cycles can be short in fashion, organizational innovation, incremental innovation, and rather long in radical innovation, nearly a century in the appearance of the naval shell and the arrival of a new cycle with aircraft carriers. Every sector has seen incremental and radical innovations, but in different proportions. The sector of terrestrial road transport vehicles is in a median position for all sectors, with prior activities including both Design and Research & Development (R&D). A sector like textiles is not as subject to radical innovations, unlike that of medications.
We will develop here the example of Carbon Transport, which mobilizes both incremental and radical innovations. There are carbon emissions specific to energy production, whereas the scenarios for reducing Carbon Transport emissions build on the electrification of vehicle fleets. Access to electric vehicles on the mass market continues to have uncertain significance. The International Energy Agency proposes two scenarios: a Business as Usual scenario where the quantities of electric vehicles remain so modest that they bear no influence on reducing carbon emissions. The other scenario is that of the very large-scale spread of the electric vehicle. This electrification of road transport would then lead to a major reduction in greenhouse gas emissions, all while proving complementary to other measures with the same goal. European nations and automobile manufacturers have announced early dates, between 2020 and 2040, for an offer fully limited to hybrid hydrogen and electric vehicles. Norway has been successful, with half of all new vehicles sold belonging to this new category in 2017, whereas China has set a goal for 2018 of 10% of all sales belonging to these vehicles.
Work by technological historians indicates the persistence of old technologies. Availability and better efficiency does not guarantee the quick adoption of new technologies, because local and cultural dynamics must also be taken into consideration. These works lead to conservative projections concerning the realization of the goals set for energy transition. The example of the electric vehicle has been explained here with an aim to contribute to the improvement of a general framework of analyzing a sociotechnical system or a global innovation system, where the problem is particularly that of large-scale transition, and enlargement.
2.2. The sociotechnical system of the electric vehicle
Three sociotechnical systems in the field of transport can be compared and linked to the intellectual landscape of globalization. Kenichi Ohmae introduced the concept of globalization in a simple opposition to the industrial policy embodied by the Japanese Ministry of Industry. A second intellectual family takes a position of defending national policies. A third approach has good qualities in terms of the empirical description of interactions between actor and dynamics, but does not have the simplicity of a position “for” (industrial policy) or “against” (globalization, according to Ohmae).
This ternary schema can be found in sociotechnical transport systems. For rail transport, the innovation system is “in transition”, as concluded in a recent study [RAI 17]. The innovation system for the railroad has a national foundation and depends, above all else, on public action. The policy of competition, e.g. in Europe, pulls the railway’s innovation system out of this position of “industrial policy”, without truly stabilizing a new configuration [RAI 17]. For roads, the innovation system is the global interlacing of automobile manufacturers and their primary providers. There are three locations of clusters of terrestrial road vehicles: the United States, Europe and Asia-Pacific. Globally, these are based on companies and present a strong spatial hierarchy: this situation is closer to the one defended by Ohmae. For roads, collective learning is always repeating: the sudden rise in road disasters during globalization indicates a lack of risk control when a new country increases its circulating vehicle fleet (see Figure 1.4). For air, better global coordination leads to risk control being shared across the entire planet, which also gives us an example of a third kind of sociotechnical system of innovation.
2.2.1. Light vehicle design
The so-called “conventional” design of the automobile dates back to a technological choice of hybridizing two technologies, one electric and the other based on the combustion engine using liquid fossil fuels, proposed by an engineer from the company Delco in 1913. This engineer advanced the idea of combining the good start-up properties of electric motorization fed by a lead battery and gasoline engines.
The electric vehicle comes from an older design, the so-called BEV. In 1900, a third of all light vehicles worldwide were electric. They avoided the arduous work of self-starter combustion engines. A contemporary high-luxury electric sedan, and “Jamais Contente”, the electric vehicle to hold the world speed record above 100 km/h, was based on the same design, i.e. four tires, an electric motor and a 750 kg battery.
The current situation is that of successful massification for one type of electric vehicle, the HEV, whereas other types (PHEV, BEV and FCEV) have only started to be commercialized very recently on large emerging and renewal markets. HEVs are hybrid vehicles that do not have a significant energy storage unit. The other kinds of vehicles can be recharged using an electric network or a hydrogendistribution network. For BEVs, all energy used comes solely from batteries. Some vehicles have an energy production model to extend their autonomy. BEVs are “zero-emission” and belong to the highest level of demand for environmental matters; the carbon footprint of the hydrogen vehicle also belongs to this category, but it also depends on hydrogen manufacturing. It depends on the hydrogen-production industry, just as the BEV’s overall footprint depends on the availability of electricity produced without coal. In the case of inappropriate industrial production, the performance of these vehicles in terms of their carbon footprint is close to that of non-plug-in electric vehicles.
A battery is heavy and cumbersome. The major handicap of the combustion engine, i.e. the difficulty starting, was lifted by the technical compromise of 1913: a small electric motor functioning for a short time starts the primary motor. The hydrogen battery was invented by a chemist from the University of Basel, Christian Schönbein, in 1838. Energy storage was a recurring problem, and it was on the occasion of NASA’s first manned space voyages that the use of a fuel cell came about.
Two breakthroughs emerged through an old design, that of the battery vehicle. The first radical innovation is the recovery of kinetic energy. These hybrid solutions can be applied to all vehicles so long as they display a certain weight and a certain speed. They are not pertinent for extra light and particularly slow vehicles like the electric rickshaw. The second radical innovation is energy storage in the form of hydrogen, which leads to multiple applications, and not only in the field of electric mobility.
Abernathy and Utterback [UTT 75] proposed a three-phase schema for the innovation cycle. The three phrases present coordination problems of a different type.
The first phase is called the fluid phase. The uncertainties concerning the technology and the market are significant. There is no clear idea of the potential applications of the innovation, so its importance remains difficult to evaluate. The direction that markets will take is not fixed. The most aggressive competitors are those that represent the “old” technology threatened by innovation. Innovations are brought about, in turn, by small companies. There is a race to determine the dominant design, during which companies use diverse strategies (agreement with distribution, takeovers by other companies) to introduce a coordinating schema of the new products or services.
The second phase is known as segmentation. Initial coordination around technological applications is acquired. Markets open up. The dominant design plays its role as a coordinator and the actors share the different segments with one another. In this stage, companies have to use strategies to consolidate the position of their products on the market and prepare a production capacity. This stimulates process innovation and introduces a new era for organizational, intracompany and coordination problems in this second phase.
The third stage is a specific approach that is found on the side of details and precision. Product differentiation takes place through adaptation to the specificities of the consumers in each segment. The competition is very intense. The situation is favorable to concentration. Oligopolistic companies ensure their positions through subcontracting relationships, distribution canals, and other complementary active parties. This creates barriers for new entrants. The search for quality encourages incremental innovation. Radical innovation is then a major threat. The different designs of electric vehicles can be found in Abernathy and Utterback’s second phase, whereas the conventional design is found in the third.
2.2.2. Decisive factors in the electric vehicle’s acceptability
We can break down the light terrestrial transport vehicle market into three types:
- – pioneering markets : these are countries where there are few road infrastructures and where the size of the circulating fleet is limited. There is currently no manufacturer offer specifically for electric vehicles in these markets;
- – emerging markets : these are markets where the consumers’ preferences are more favorable to the electric vehicle: there is a strong contrast, for example, in Europe, between Turkey and Russia, where consumers are very favorable, and other European countries. Likewise, there is a strong contrast between consumers in Japan, who in surveys are the most reticent worldwide toward electric vehicles (due to the responsibility of the electric producer in the Fukushima nuclear accident) and those in China, who are much more favorable. For China, the existence of a very large two-wheel fleet with electric motors is mentioned for the formation of these preferences in favor of the electric vehicle. Electric vehicle sales in China have increased greatly since 2014;
- – renewal markets : the manufacturer offer is the largest here, and this is where the most significant sales are made.
The primary decisive factors in the electric vehicle’s acceptability are known. The decisive factors for the sale are: the sale price, the density of the recharge network, the price gap for different kinds of energies for transportation (electricity vs. fossil fuel). The intention to purchase electric vehicles according to the prices posted “on the pump” is better documented than the effects tied to the density of the services offered.
For pioneering markets, the “large manufacturer” offer is not present. We also have no knowledge of the financial support policy for the electric vehicle by the local authorities of these nations. For a consumer, the only financial bonus comes from the spread, the price gap between electricity and fossil fuels, as a result of which there are small local manufacturers of electric vehicles. For example, the “205 electric” is still offered to the consumer by local transformers in the Occupied Palestinian Territories. This offer arises from material that was declassified due to European environmental legislation (the “205 electric” has been banned in the European Union since 2005 due to out-of-date batteries).
In emerging markets, the States’ involvement concerning the promotion of the electric vehicle is seen by consumers as being credible. Local manufacturers provide a zero-emissions offer, great in number but with a mediocre quality due to the use of old battery types (e.g. in Manila).
For renewable markets, the comparison between Germany and the United Kingdom is the most significant. In Germany, financial motivations are limited due to the higher cost of electricity. However, electric vehicle sales still reach a noteworthy level, whereas the signal for the consumer with a strong preference for what is already there is much more limited. In the United Kingdom, the price signals for “short-sighted” and “far-sighted” consumers are among the best in the world, but electric vehicle sales there are disappointing. The United States, China and continental Europe have a local history of the electric vehicle, whereas a historic singularity in the United Kingdom lies in a lack of local electric vehicle production, except for HEVs. This historic factor is thus advanced as playing a role in the spread of the electric vehicle. Renewal markets seem more sensitive to non-monetary aspects, introducing the history of technological sectors as an explaining factor. A combustion engine vehicle owner will potentially quit buying combustion engine vehicles and will only be receptive to an alternative offer that is a hybrid electric and combustion engine.
State involvement is limited. Only two European states, Denmark and Norway, have adopted regulations with a positive financial motivation to have an electric vehicle (the consumer has financial interests in adopting an electric vehicle) [KWD 12]. Norway is the only country in the world where electric vehicle sales exceeded 50% in 2017; however, on average, 40% of consumers around the world state that they are interested in purchasing an electric vehicle.
Consent to pay in favor of the environment is growing with the wealth of the individual [FRA 13]. The lifestyle that is most favorable to acquiring an electric or hybrid vehicle is one marked by active pro-environmental engagement; the least favorable are those showing indifference toward environmental matters – including lovers of new technologies, who are often pioneers in adopting innovations [AXS 12]. Few public policies eliminate the extra cost linked to buying an electric vehicle, which reinforces the aspect of militant buying for this benefit. The price of the vehicle and the gap between electricity and gas–oil prices remain major decisive factors for the long-term evolution of the electric vehicle. A behavioral economy diagnosis for all markets allows the list of decisive factors for acquiring an electric vehicle to be completed [CAL 13]. For pioneering markets, the most captivating perceptive bias is intertemporal shortsightedness. In pioneering and emerging markets, there is a lack of low credit cost offers for consumption. A planned purchasing strategy allows this difficulty to be bypassed by consumers in emerging nations. For BEV vehicles, a fear of running out of fuel can be seen at an equal level in emerging and renewal markets. For renewal markets, technological conservatism is the most captivating bias. The fact of having an up-to-date use of a technology leads to a preference structure. Buyers of BEV vehicles often already have a hybrid vehicle, and thus confirm sector conservatism after a change brought about with the hybrid vehicle.
2.3. Inglehart’s postmaterialist values
The postmaterialist theory was originally developed by Inglehart [ING 71, ING 77]. It is the most influential theory in explaining the change in values [DAL 08]. According to this theory, individuals and nations differ in their degree of aversion to materialism, also known as consumerism, understood as the belief that the massive acquisition of material goods or possessions is decisive for the well-being and happiness of every individual. Two large groups emerge: materialists who believe that society should concentrate on having a healthy economy, and postmaterialists, who think that ideas are worth more than money. These values differ from one nation to another and evolve over time [ING 83]. However, postmaterialist values can be associated with the level of economic development in a country, in the sense that when it reaches a sufficient level of development, its inhabitants will be more concerned with matters relative to social well-being and the environment [ING 95b, ING 99]. Thus, industrialized countries will be more postmaterialist than developing nations. This theory does not find approval with all audiences, however; some believe that the citizens of industrialized or developing nations all display pro-environmental intentions [ROB 96]. Inglehart then introduced the concept of an “objective environmental problem” and “subjective environmental values” as a form of justification. In particular, he concludes that the pro-environmental intentions that individuals display in developing nations are linked to the first serious environmental problems that they encountered. Research shows the relationship between Inglehart’s postmaterialist values and the proenvironmental intentions between different nations and within a single nation [KIL 08, MOS 07, GOK 02, OLL 01, DUN 00, KIM 99, DIE 99]. For example, a positive correlation has been established between postmaterialist values and the intentions to adopt pro-environmental behaviors [ING 95a]. The more postmaterialist a country or an individual is, the greater their intention to adopt pro-environmental behaviors would be. This relationship is contested, however, based on the universality of pro-environmental values around the world [MOS 13]. This entire discussion gives rise to the following hypotheses, which can be discussed in the case of the electric vehicle:
- – H1: The wealth of a nation (GDP/inhabitant) positively influences the adoption of an environmental innovation.
- – H2: The postmaterialist values of a country positively influence the adoption of an environment al innovation.
- – H3: Objective environmental problems positively influence the adoption of an environmental innovation.
2.3.1. Cultural values and the electric vehicle
The data collected in the sixth wave of the World Value Survey (WVS) were set against those of electric vehicle sales in 54 nations covered by the survey. The data concerns the period 2010–2013. These 54 nations represent two-thirds of the greenhouse gas emissions originating from transport.
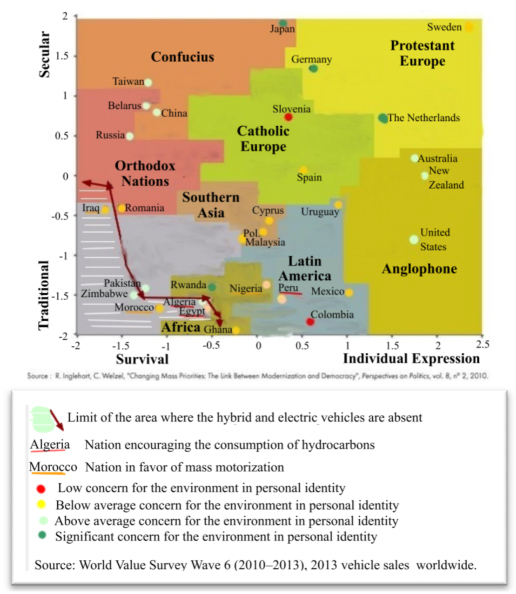
Figure 2.1. Spread of the electric vehicle around the world in 2013
Table 2.1. Division of sales according to markets and types of electric vehicles
(source: sample of 54 nations)
| EV Sales 2013 | HEV (%) | PEV (%) | FCEV (%) |
| Pioneering market | 0 | 0 | 0 |
| Emerging market | 21 | 10 | 0 |
| Renewal market | 79 | 90 | 100 |
The FCEV industry remains the least developed. Its development involves the installation of hydrogen pump networks. PEV industries (all of the vehicles that can be linked to the electric network: BEV, EREV and PHEV) have seen major growth recently. The hybrid industries were introduced around 15 years ago and represent a major part of the six million electric vehicles in circulation around the world in the reference year of our study (2013) (see Table 2.1). On December 31, 2013, there were 100 times more charge stations for electric vehicles (PEV) than for fuel cell electric vehicles (FCEV), whereas there were 15 times more hybrid vehicles sold than “fully electric” BEVs. Service stations for hydrogen vehicles are very expensive in comparison with charge stations for plug-in vehicles.
Electric vehicles are distributed from renewal markets. The oldest industry makes 21% of its sales in emerging markets; the most recent, 0%. On December 31, 2013, rechargeable electric vehicles only represented 7% of the global fleet of electric vehicles. In fact, the global fleet of PEVs is estimated at 405,000 vehicles, and the total fleet of electric and hybrid vehicles at 6 million vehicles. The distribution networks for FCEVs were 208 stations around the world and more than 20,000 stations for PEVs. Three geographic regions are favored in the sale of PEVs: North American, Northern Europe, and three East Asian nations (Japan, China and Korea). These areas concentrate the users, the most developed networks and the production sites. On Ingelhart’s map of world cultures, this represents the most secular cultures and the ones most oriented toward individual expression of lifestyle. The few countries where the electric vehicle has not been introduced are the intermediate nations in terms of care for the environment in individual identity, but often with public subsidy policies for gas.
An initial composite image emerges. The pioneering markets can be distinguished, together presenting the largest lack of control of environmental consequences of transport and the highest levels of environmental engagement in the population. Then come the emerging markets, which are correlated with the lowest values of environmental engagement. Renewal markets are intermediate in terms of environmental engagement, but the only ones with a significant portion of the market for the electric vehicle and the only ones to exceed a reversal point in the chronological series of carbon emissions for transport.
Two forms of environmental engagement can be contrasted:
- – the one in renewal markets, with mild adhesion to ecological organizations, which is reflected particularly in financial contribution. This profile corresponds to that of people acquiring electric vehicles combining financial capacity and environmental values;
- – the one in pioneering markets, with more pronounced active and militant participation, but also priority given to economic growth.
The situation least oriented toward civic and environmental engagement is that of emerging markets. In the record of carbon emissions for transport, the degradation of results comes from these emerging markets in 59% of cases (calculated since 1990). Renewal markets have, by definition, low growth in volume. A stabilization of annual emissions has been obtained there recently, but this does not yet compensate for the increase in emissions in the early 1990s.
Table 2.2. Environmental engagement and market type
(source: World Value Survey 2014)
| Average by group of nations | Ecological finance (%) | Active in an ecological organization (%) | Participate in ecological rallies (%) | Trust in ecological organizations (%) | Pollution is problem no. 1 (%) | Growth first and foremost (%) | ||
| Strong | Moderate | Strong or moderate | ||||||
| Pioneering | 13.5 | 5.4 | 8.4 | 21.1 | 42.6 | 63.7 | 6.2 | 47.3 |
| Emerging | 8.6 | 1.9 | 7.6 | 15.2 | 36.1 | 51.3 | 11.8 | 42.5 |
| Renewal | 18.6 | 2.9 | 5.4 | 10.4 | 45.7 | 56.1 | 14.8 | 43 |
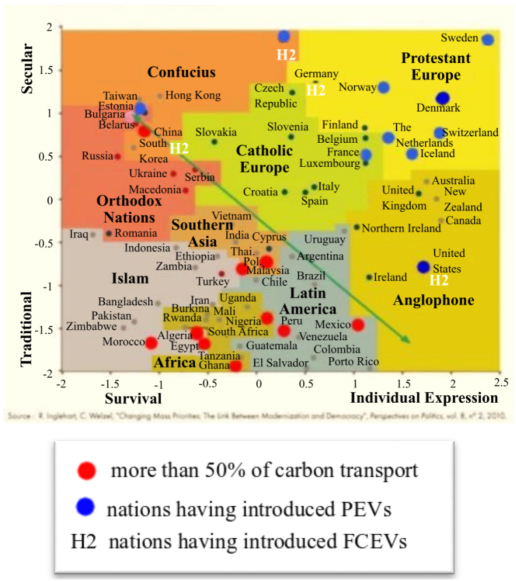
In 2013, 10 countries with the most significant portion of the market for PEVs were renewal markets (Norway, the Netherlands, Iceland, Japan, France, Estonia, Sweden, the United States, Switzerland, Denmark). These 10 countries are situated above the NW-SE division on Inglehart’s cultural map of the world, they belong to five of Inglhart’s eight cultural areas and to three large geographic regions: North America, East Asia and Europe.
Among the sample of 54 nations from the WVS, 20 nations have seen a growth above 50% in carbon transport emissions between 1998 and 2011: Trinidad and Tobago, Peru, Malaysia, Poland, Jordan, Tunisia, Qatar, Armenia, China, Kyrgyzstan, Ecuador, Azerbaijan, Kazakhstan, Nigeria, Mexico, Egypt, Algeria, Kuwait, Ghana and Morocco. These countries are situated below the NW-SE division on Ingelhart’s cultural map of the world.
The electric or hybrid vehicle is generally introduced onto the market at a high price, and in countries where the first buyers enjoy a high standard of living. As it is nations with earnings above 45,000 dollars that have the most electric vehicle owners, the “relative speed of adoption” for the electric vehicle depends on the level of wealth. The H1 hypothesis is verified as a general rule, but can be discussed in greater detail.
The electric vehicle presents a higher sale price than an equivalent “conventional” vehicle. It is advantageous for intense use based on the price of fossil fuels. For the most recent sector (FCEV), the location of the first users responds only to determinations of “proximity to the factory” in the precommercialization phase. It is industrial groups that invest in the new sector and launch preproduction models. In this case, the connection to “wealth” is not the most important: it is not the richest countries who first adopt these, but nations that have research and development services for automobile construction. The announced prices for FCEVs are those of a luxury sedan.
This connection to wealth is more distinct for the BEV sector, with the commercialization of high-luxury vehicles. These small “fully electric” urban vehicles are also introduced in nations with average earnings above 45,000 dollars.
Hybrid vehicles were introduced earlier. They are sought after on the second-hand market by professionals, e.g. Pakistani taxi drivers seeking a simple, robust vehicle made for extensive use. The connection with wealth is thus tenuous in the case of the hybrid sector.
The positive influence of wealth on the acquisition of an electric vehicle ceases in cases where a significant part of this wealth comes from returns on gas or oil. The orientation of public policies not in favor of reducing carbon transport emissions are seen in the low values of returns on gas and oil in the GDP (between 2 and 3%) and the changes in buying behaviors toward a slightly higher value (10%).
A country with “more” postmaterialist values will be faster to adopt; thus hypothesis H2 is confirmed. The speed of adoption is read according to the SW-NE on Inglehart’s cultural map. The upper corner is on the side of rapid adoption and postmaterialist values. The lower corner is where countries have not yet introduced the electric vehicle.
This representation with two factors provides clearer results than with one single factor, built, for example, with either question 80 (five items) or 81 (two items) from the questionnaire from wave 6 of the WVS. Question 81 sets “growth” against “environmental protection”, and the number of people adopting an electric vehicle reduces with the percentage of those claiming to privilege environmental protection in all cases.
When question 80 is used, where respondents are asked what their priority is, the indicator is built by adding together two rather “materialist” items: “the fight against poverty” and “improvement of living standards”. A synthetic indicator of materialism with the numeric value 63 corresponds to the average of the first adopting nations, a value above 79 to the lack of sales. Associated with views that are not overly dogmatic and with an individual expression of lifestyle, purchasing behavior concerning the electric vehicle is a good indicator of postmaterialist values.
In a context of climate change, the acquisition of an electric vehicle cannot be interpreted systematically as a self-protection behavior. The example of the Netherlands, with exposure to the risk of submersion and a high level of electric vehicle acquisition, does not provide a simple relation between these variables over the entire sample of 54 nations. This disproves hypothesis H3.
The purchasing behavior concerning the electric vehicle has an individual ethical basis due to the diffuse nature of the threat of climate change and due to possibilities of opportunistic behavior for a good that does not present the characteristics of self-protection equipment. The percentage of environmental activists in the population has no apparent connection to the purchasing behaviors concerning the electric vehicle.
2.3.2. Discussions and implications
On a global scale, very contrasting results are observed between electric vehicle sectors; no-emissions sectors from the gas tank to the road, BEV, hydrogen (FCEV), the struggle to commercialize, while “step-by-step” sectors, HEV/PHEV (hybrid vehicles) and Slow Lights show total success in diffusion on a large scale. “Fully electric” vehicles are also being mass marketed in the field of small, slow vehicles.
The data gathered contributes arguments for a universalist vision, indicating environmental concerns that are largely expressed and shared around the world, and culturalist arguments, indicating a differentiated manifestation of these concerns. These results do not lead us to lean one way or the other; instead, they form a synthesis between the two visions advanced. The indicators of materialism in China are limited (value of the synthetic materialism indicator: 51), near those of the Republic of Korea, in accordance with Inglehart [ING 83, ING 95a]. The preferences of consumers in emerging nations are more environmental than the policies followed, be this deliberate or due to difficulties specific to implementing the organizations necessary to achieve a reduction in pollution levels, in accordance with the literature [MOS 13, ROB 96].
The spread of an innovation like the electric vehicle varies according to the wealth of each country. It will be faster in nations where wealth is greater, with the exception of countries whose economies are based largely on the sale of gas and oil. These heterogeneous adoptions are in agreement with the literature [MOS 13, ING 95b]. Culturally different markets grant differing degrees of importance to ecological problems, as we can see in the literature [MOS 13, KIL 08, DUN 00, KIM 99, NOR 97].
The electric vehicle is part of the affirmation of a civic culture, both individual and collective. This common culture of sustainable development is largely expressed around the world and takes the form of a renaissance of the technological sector explored in the early days of the automobile (the BEV, 30% of the vehicle fleet in 1900) and in new sectors (hybrid, hydrogen). Rousseau placed Wheat before Iron: technological shocks modify established beliefs, and the invention of the sickle changed lifestyles. However, Wheat is before Iron: equipment moves little, and it is essentially changes in lifestyle and reference values that bring about technological revolution. Here, we would be dealing with a textbook case: the good, “electric vehicle” equipment, manifests itself in the form of a positive and original creation of shared values on a large scale.
2.4. Deployment of the electric vehicle and power relations
For all countries, the question of decentralization and the organization of different levels of power is an important and complex question in reaching low carbon emission goals.
Three distinct schemata are proposed in the literature on globalization. The first two schemata are in complete opposition on this question of organizing different levels of power. Ohmae’s strategy is to only play on the low level of the global power scales: the company and the territorial collective. Critical consumerism, on the other hand, plays on the high level of this global scale of powers: states and large international organizations. The low has powers of execution, and the high has powers of norm creation. It would be best to coordinate the two, which opens the way for a third trend in the literature. This is particularly true for sectors that require good coordination between the high and the low, like BEVs or FCEVs, with the need to create a network of service stations for these sectors.
The data collected have been set against an analysis schema advanced by Ulrich Beck, one of “emancipatory catastrophe”, a positive cultural catalyst for sustainability. To reduce carbon transport, the most common form of this emancipatory catastrophe is an episode of smog. A succession of large catastrophes simply maintains a culture of immediate survival, as indicated by the example of Port-au-Prince.
The overly long period of Utopia bears witness to the existence of coordinated and planned activity, though generally disappointing in its ability to effectively reduce carbon transport. These are voluntary government processes aiming at taking control of their fossil fuel supply bill or the domestic energy monopoly. The main obstacle is the distance from the consumer, who, in the case of emerging markets, is the most reticent in assuming action to reduce climate change.
The overly short period of the Apocalypse keeps it short of the organization, below a start-up of operational capabilities. Pioneering markets have a hard time converting very strongly expressed environmental values into effective solutions against pollution.
With the “emancipatory catastrophe”, Beck provides a theory of coordinated operational capability training in the face of climate change. Individuals today have several affiliations. Reducing this number for consumers in a “materialist” mass culture of emerging markets is part of the diagnosis for the present and expected decrease in carbon transport emissions. The respective roles of the center and the suburbs must be emphasized. They are based on a complementarity and not a hierarchy providing utopic configurations. “The emancipatory catastrophe must produce normative horizons for common goods”, says Beck [BEC 13]. The center plays a positive role, as in most spatial theories; however, the important thing is its ability to make vague evils tangible through their concentration. The suburbs also have a positive role in entrepreneurial realizations, which, materially, cannot and must not be placed in the downtown area, particularly due to the industrial nature of fuel and energy production.
2.4.1. The role of territorial collectives
Territorial collectives could play an essential role in the fight against climate risk [BER 14, KAL 13]. However, it is difficult to define their capacities in this matter precisely, as indicated by the current debates on defining the capacities of the territorial collectives in France. Even if the legal context generally grants territorial collectives the right to manage distribution networks, there is no clear schema of governance associated with this devolution. For example, European law requires a separation between the production, transport, distribution and provision of energy; the institutional landscape nevertheless remains contrasted in Europe between highly centralized or effectively decentralized situations. The same dilemmas can be found all across the world.
Actions in favor of clean transport remain oriented toward the urban areas concerned by poor air quality. What about rural or noncentral areas? Sixty percent of electric vehicles are sold in rural or periurban areas, poorly served by public transport (source: AVERE), but also less involved in concerned initiatives in favor of the electric vehicle.
The question asked is that of “good” decentralization for energy and transport. One of the limits of the prospective studies is that it is likely necessary to keep in mind that an electric fleet and local management watching out for energy efficiency are synergies [OSH 14]. Spectacularly reducing carbon transport involves “good” local governance of distribution networks and most likely goes hand-in-hand with better results for the energy mix. The skills that need to be defined for local managers of distribution networks create a twodimensional problem:
- – first dimension: locally coordinating and dynamizing the energy transition. The definition of powers for the management of distribution networks still need to be outlined;
- – second dimension: foreseeing potential conflicts of interest.
The mission of territorial collectives today is focused on energy economies. This is not necessarily a producer’s goal. A lack of de facto separation between production and distribution leads to situations that are unfavorable to promoting energy efficiency.
2.4.2. Ulrich Beck’s “cosmopolitan communities of climate risk”
Ulrich Beck introduced a conceptual framework for studying the local responses to global risks, particularly climate change. Where and how do cosmopolitan communities of climate risk emerge? [BEC 13]. He underlines the methodological questions specific to the study of phenomena linked to globalization. Decentralized action is the kind most often studied in a national framework, which is ill adapted to the global nature of this risk.
According to Beck, cultures of sustainability oscillate between two primary schools of thought: utopia (a tradition in Hegel’s idealist line of thinking) and the apocalypse (generally mentioned to demand a state of emergency, regulation with an iron fist). In practice, believers in the apocalypse play on the intensification of local conflicts and push for a policy of tension and legislation of exception. Territories that today have the ability to reproduce global conflicts on a small scale are led along by these large-scale policies. Utopists offer technical solutions that fail to become true, widely used innovations.
Beck develops a vision of the “emancipatory catastrophe”, producing a social norm and public welfare. Beck’s idea is also methodological for the study of political forms appropriate for global problems like climate change. He sets “methodological cosmopolitanism” against sociologists’ “methodological nationalism”. The nationalism of communities was introduced during the era of European migration to the New World by a creole imaginary, where colonial residents find themselves between a metropolis that decides and new arrivers or new competitors. For a global question like climate change, the situation is different. Some collectives transmit this global issue locally, and it is with regard to these people that Beck can say that the climate risk has created cosmopolitan communities [BEC 13].
The positive culture of climate change, that of the “emancipatory catastrophe” according to Beck, presents the following characteristics (see Table 2.3):
- – it claims limited knowledge and is not apocalyptic;
- – it places itself in an intermediate timeframe between utopic cultures, generally technical in nature, that are atemporal or have very long timeframes, and cultures of political urgency, with such short horizons that there is no day after tomorrow. This intermediate timeframe is a short intergenerational one, belonging to our children and grandchildren.
Table 2.3. Cultures of sustainability
(source: according to [BEC 13].)
| Apocalypse | “Emancipatory catastrophe” | Utopist |
| Urban planning Example: Sustainable city groups |
||
| Consortium of entrepreneurs Example: Hydrogen sector of Fukuoka |
Pro “green technology” | |
| Radical groups advocating self-sufficiency | “Generalist” environmental associations |
Beck provides three examples of actors in the positive culture of climate change:
- – sustainable city groups, territorial planning; e.g. ICLEI1, an association of 1,200 large cities around the world. However, ICLEI is rather elitist – New York, Paris, etc. – large metropolises are also members;
- – consortiums of innovation networks, the entrepreneurs of new “green” sectors;
- – environmental associations that play the role of green consumerism.
These three types form what Beck calls “cosmopolitan communities of climate risk”. By gradually adding empirical elements, the grid of local sustainable cultures can be filled in. Beck’s methodology is descriptive-normative: a new conceptual framework is put in place based on research strongly tied to contemporary realities.
2.4.3. Individuality with multiple affiliations (Beck)
Questionnaires from the WVS allow us to distinguish regions of the world according to the kind of affiliation their population has (questions V 212-216 from wave 6):
- – little local affiliation: Russia, Belarus, Kazakhstan;
- – strong affiliation of personal autonomy: East Asia;
- – those with the strongest feeling of being “world citizens”: Philippines; the least: Russia, Egypt.
Out of five affiliations proposed in the WVS questionnaire, the average affiliation rate is 3.7 around the world. Poly-affiliation is the rule, as predicted by the cosmopolitan identity model proposed by Ulrich Beck. Beck indicates that the world is transformed by the appearance of “multiple belonging awarenesses” [BEC 02, p. 142].
Table 2.4. Multiple affiliations
(source: Global average estimated based on the WVS 2014 survey, http://www.worldvaluesurvey.org/)
| Strongly agree (%) | Agree (%) | Total of both (%) | |
| Global affiliation | 29.8 | 41.7 | 71.5 |
| Regional affiliation (e.g. European Union) | 26.8 | 39.7 | 66.5 |
| National affiliation | 53.6 | 38.9 | 92.5 |
| Local affiliation | 37.7 | 44. 9 | 82.6 |
| Individual autonomy | 29.1 | 37.4 | 66.5 |
In the 19th Century, cosmopolitanism appeared to be an ideal horizon, whereas today what is real is an alterity that is always close. Daily life is now characterized by “obvious cosmopolitanism”, although it “comes into greater and greater contradiction with the categories of understanding reality that obey national norms” [BEC 02, p. 146]. Even the same forms of resistance to globalization are expressed in “political globalization”, and therefore participate in the same dynamics of globalization.
Beck defines the present period as a new civilization process that operates on the individual level and that of each State. He thinks that this constitutes a weakness in the view of multiculturalism, which perceives no dynamics of civilization and is limited to groups within a single nation. Beck sees globalization as the end of closed societies and exclusive affiliations for individuals. Cosmopolitanism has the goal of “being internalized on a state level” [BEC 02, p. 344]. All countries must cooperate to care for individuals, all with multiple affiliations. There is a long-term trend to lower social violence, which comes to support Beck’s theory of globalization as a civilization process.
In Beck’s sociology, globalization or “cosmopolitan realism”, everyone has several affiliations, and there is no longer a Far East, but everyone has a Japanese or Lebanese restaurant next door. Likewise, climate risk provides a global impact to small daily gestures.
2.4.4. Electromobility
The large-scale introduction of different kinds of electric vehicles allows local responses to the global risk of climate change to be characterized and the forms best adapted to decentralized action to be studied.
This spread took place in three successive waves. These three waves are a recent innovation, with hybrid vehicles (HEV) being put on the market first (the most sold vehicle was introduced in Japan in 1997, then in Europe and the United States in 2000), and fuel cell vehicles (FCEV) (the most sold vehicle was introduced in Japan in December 2014). For recently introduced hydrogen vehicles (FCEV), this showcases some regions in the United States, Japan, Denmark, Germany and the United Kingdom. HEVs and PHEVs are more widely commercialized in renewal and some emerging markets. Slow, light electric vehicles are also introduced in some pioneering automobile markets (e.g. the Philippines). The map of these spreads is dynamic, and it provides an indication of a difference between territories. In relation to territory, the energy system and the experience of decentralization are factors to differentiate technological choices. Let us propose two locations: one with an energy mix, carbon/non-carbon 80/20 (world average); the other 20/80. In the ase of an energy mix favoring renewable energies, the technologies dependent on mixing better environmental performances may be recommended. In the case of an unfavorable mix, technologies that do not depend on a dedicated distribution network are available.
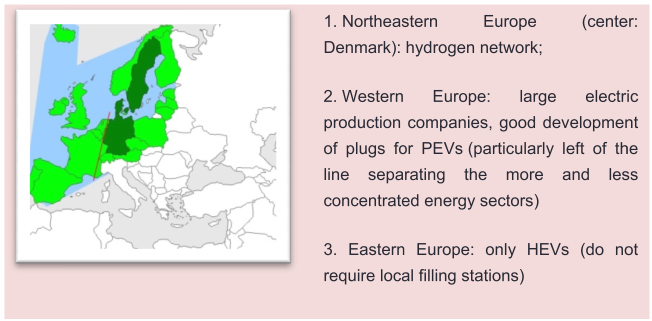
Figure 2.3. The three Europe of the electric vehicle in 2015
If the momentum of active policies is based on concentrations of atmospheric pollution, we will notice that the recorded uses of electric vehicles are located more within the peri-urban area. In fact, the spread of PEVs poses numerous problems in urban environments. In particular, these are issues with parking space, the saturation of charging stations, and a lack of places to turn into charging stations. Further more, a public transport offer allows the modal transfer to urban areas and makes the acquisition of electric vehicles less advantageous. On the contrary, the offer of collective transport is much lower, even inexistent in less denseareas. The electric vehicle sees issues of plug placement and charging stations much less often there [TRA 13].
2.4.5. Rural and urban areas in the history of electric distribution networks
The history of electricity distribution in France is a dynamic based on the problems posed by the Suburbs. In 1920, only 20% of communes had electricity, and they represented 58% of the French population. The price was managed at the commune level. French communes were the owners of the distribution network due to the 1906 law. In 1937, 96% of French people had access to electricity. Prices were managed at the regional (département) level, which played a role in coordination. Nationalization in 1945 took place by leaving approximately 5% of the network to small local distributers, at the level of an urban area or a sparsely populated département. The FNCCR represented the local representatives and defended a low electricity price. The universal fee from 1965 was a compromise between a single price scale favoring the most peripheral territories and the de facto withdrawal of collectives in electricity distribution management [POU 07]. These three stages of electrification can be seen in the current situation of access to electricity around the world (world average by country, 93%; world average of individual access in 2010: 77.6%).
Table 2.5. Access to electricity around the world compared to electrification in France
(source: according to the World Bank’s database)
| France until 1920: less than 58% with access to electricity | 64 nations in 2011: Haiti, Nigeria, Rwanda, Zimbabwe, etc. |
| France between the World Wars: between 58 and 96% with access to electricity | 54 nations: India, Pakistan, Ghana, Argentina, South Africa, the Philippines, Qatar, etc. |
| France after 1945: more than 96% with access to electricity | 94 nations: Iraq, Kazakhstan, Ukraine, Uruguay, etc. |
Electric vehicle sales today primarily take place in countries where the entire population has access to electricity, even in the case of “plug-free” hybrid vehicles (HEV).
Electromobility today is that of distributor Suburbs. The electric vehicle saw its initial development around 1900 at a time when the Suburbs were “fodder” and the Urban Center distributors (approximately 30% of all vehicles were electric in 1900, whereas rural areas did not have electricity, but they could provide towns with cheap hydroelectric energy). After approximately 1910, the lengthening of journeys killed this Urban Center distributor pattern.
2.4.6. Sustainable territorial strategies: limitations of strategies based on space rationalization
Limiting movement through relocation (businesses in rural areas, workplaces near residential areas) is an often chosen option. However, studies indicate that densifying into a rural area or improving urban installations is not enough to overcome the growth of mobility. A lowdensity area with an arrangement of nearby services experiences a transformation of movement, intensifying not only nearby exchanges, but also lengthening the distances of other relocations [HAU 13]. In areas of climatic instability, adaptation strategies are usually based on greater mobility. The demand for transport only partially results in the fact that “things are not in their place”; once things are put back in their place, this demand remains significant and supported. Planning movement has unexpected effects and does not allow the electrification of transport to be avoided.
Actions in favor of reducing climate risk are influenced by factors like the proximity of coastal regions, population density, wealth and level of education. Vehicle emissions will significantly predict the efforts of local policies concerning climate change [TAN 11].
Some geographic areas will be more active in their climate change policies. For example, in the United States, jurisdictions in San Francisco, Portland, Seattle, Los Angeles and San Diego will be more dynamic than others [TAN 11]. In France, the first studies indicate that it is urban areas that produce electric vehicles that are the most dynamic with regard to environmental action (e.g. Maubeuge and Val de Sambre). The three pilot areas for electromobility (in North America, East Asia and Europe) include major actions for spreading alternative solutions to fuels and conventional vehicles.
Studies have also shown that environmental innovation spreads more efficiently when it is introduced beforehand to an initial market and then progressively spread to other “peripheral” markets [HEN 07, BEI 04, BEI 05, KEM 98]. In the case of the electric vehicle, large urban areas are more dynamic.
The development and spread of environmental innovation can be slowed down for institutional reasons (i.e. regulatory or administrative reasons), as well as technical reasons or ones relative to a simple lack of information. Del Rio and Unruh, for example, have shown that the development of the Spanish wind sector was slowed, partially by the complexity of the administrative echelons (municipal, regional, national), and partially by a deficient electric infrastructure and an insufficient interconnection of networks [DEL 07].
Even if the sale of electric vehicles only represents a minimal part of world vehicle sales, it contributes to reducing the demand for carbon fuels. Research has shown interdependence between the challenge of reducing CO2 emissions from transport through the spread of low-emission vehicles and that of spreading intermittent renewable energies. Based on the technologies available and promoted today (PEV and FCEV), a study estimates the decrease in carbon transport at 81% by 2050 for Japan in relation to emissions in 1990 [OSH 14].
2.4.7. “Technological conservatism” versus the “emancipatory catastrophe”
Debates on the energy transition mobilize two different schemata of political economy. The existence of mining income can create local consequences in the form of subsidies for fossil fuels and conventional vehicles. This is the first schema, that of technological conservatism.
In France, lawyers in the nuclear sector [SYR 08, BEE 08] encourage conventional thermic motorization. They are very reticent to the FCEV sector and ignorant of the HEV and slow light sectors. They praise technological conservatism and do not foresee changes in the automobile fleet’s structure. In 2008, they predicted that FCEV vehicles would not be available before 2030, even 2050 – they were first commercialized in 2014. It is “very unlikely that there will be a technological breakthrough” [SYR 08], even though several million electric and hybrid vehicles had already been sold around in the world as this line was written. This obstinacy harks back to elements from academic literature and historic analysis of technological conservatism. This is defined by strategist Lidell Hart with this statement: “There is only one thing more difficult than introducing a new idea: chasing away an old one”. Technological conservatism is illustrated through an emblematic example: the preservation of the cavalry in armies between the two World Wars. Even if the decisive breakthroughs had been tanks and airplanes during World War I, it was necessary to keep cavalry and horse transport, according to all the general staff, on the grounds that the economy was primarily agricultural and guaranteed abundant fodder, whereas mechanized armies required a fuel supply chain [DEL 07c]. However, the reality even of this fossil fuel provision had already led to the disappearance of the first generation of electric vehicles. Historians’ explanation for technological conservatism combines several levels of analysis:
- – the individual level: everyone has skills on a subset of technology and will seek to valorize their acquired skills; social and symbolic valorizations are also involved, like the attachment of the cavalryman to his horse;
- – the organizational level: the dominant organization does not introduce radical innovations [UTT 75]; each organization is faced with a dilemma between exploration and exploitation activities, according to a famous article by March [MAR 91], and remains subject to a decline arising from organizational gains favoring exploitation activities to the detriment of exploration activities;
- – a political economy level: voters are not very familiar with newly introduced innovation that is still not widespread. Aids to old technologies can be supported by a majority vote process or as an authoritarian power’s justification due to a lack of popularity.
Cavalries were torn to shreds during World War I. Catastrophes are not, in and of themselves, definitive questionings of technological conservatism. Introducing a notion of an “emancipatory catastrophe” leads to questions about the elements allowing a transition between two states of a political economy, either “technological conservatism” or an “emancipatory catastrophe”.

A positive dynamic of the “emancipatory catastrophe” arises from densely populated areas with strong polluting emissions arising from vehicles. Territorial collectives are faced with a certain autonomy of technical decisions concerning movement, while a political consensus emerges to fight against atmospheric pollution. The institutional game leads to vehicle emission norms being made more rigorous. Sales of clean vehicles, appropriate distribution installations and entrepreneurial consortiums reinforce the suburbs. We are in a political economy of an “emancipatory catastrophe”, where a dimension of public welfare is asserted through the management of a collective problem, like smog.
Beck recommends a global approach. The methodology is based on an extension to global databases on territorial sustainability cultures in the case of electric mobility. The study sample includes 2013 electric vehicle sales data, data on local policies, the data gathered during the wave 6 from the WVS finished in April 2014. The sample represents the countries that, together, produce approximately twothirds of carbon transport emissions.
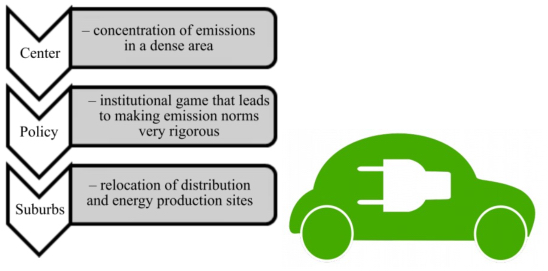
Figure 2.5. A Smog political economy, “emancipatory catastrophe”
Local maps of collective action have already been created. Tang et al. [TAN 11] have shown in their study that actions against climate change varied according to geographic regions due to three factors that they identified as education, vehicle emissions, and relative proximity of coastal regions. For example, the state of California will tend to carry out more environmental actions than regions further from the coast. A global study allows some additional details to be added to this analysis. Coastal proximity can be interpreted based on the formation of smog facilitated by the presence of coastal fog or due to a potential risk of submersion. The world map of areas that could be submersed due to climate change includes large deltas, with no real relation with the development of electromobility; whereas the cities submerged in fog form a network with thre epicenters (Asia, Europe and the United States), just like the map of electric vehicle distribution.
To characterize the cultural areas, two indices have been created. One, an HHI (Herfindhal–Hirshmann index), is used for the diversity of religious affiliations and multiculturalism. The number and respective size of these groups is what is taken into consideration. A cosmopolitanism indicator is based on the individual sum of the multiple affiliations declared.
The spread of the electric vehicle here is considered a natural experiment on a planetary scale allowing some cultural characteristics of communities with positive action in the face of climate change to be explained.
2.4.8. Where and how do climate risk communities emerge?
Consistency between the areas that have introduced the electric vehicle and those with smog explains the notion of the “emancipatory catastrophe” introduced by Beck. This consistency is found in a network like the ICLEI, with the powerful role of large metropolises. The cosmopolitan dimension is highly present, but multiculturalism is as well. The areas selling electric vehicles have cosmopolitanism and multiculturalism indicators near the global average values.
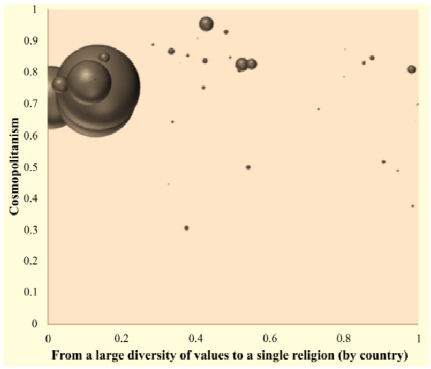
Figure 2.6. Cosmopolitanism, multiculturalism and electric vehicle sales in 2013 (in 52 countries)
(source: World Value Survey 2010-2014 and automobile manufacturers)
The regions that sell electric vehicles have a synthetic cosmopolitanism indicator between 0.72 and 0.77 for an indicator ranging from zero to one (average sample of 52 countries: 0.735). The introduction of the electric vehicle occurs through an intermediate situation, neither on the boundary of attraction to autarky nor in ate chnical universe. The countries with high earnigs from gas or oil are less receptive to electrification in the transport sector. Countriesear the average value of the cosmopolitanism index represent 59% of the world population, 95% of new vehicle sales and 97% of electric vehicle sales around the world (see Figure 2.6).
2.4.9. Efficiency of local policies
Public policies are clearly divided in the sample of the 52 nations analyzed: above a value of 5% of mining income in public revenues, official policies are neutral or contain subsidies and support for fossil energies – we see a schema of technological conservatism (see Box 2.2).
In these countries with mining interests, electric vehicle sales are very limited and are not the subject of any accompanying measure or encouragement plan. With a low value of mining income, these plans and accompanying measures for electric vehicles become frequent. We come across an “emancipatory catastrophe”, with actors who are either more specialized in regulation lobbying or an entrepreneurial consortium. The networks are rather centered on the large metropolises or on producer sectors. Most often, issues of urban pollution were the initiating phenomenon. An approach on reducing toxic emissions leads to restrictive regulations. The ICLEI is a network of large sustainable cities, world cities, and its cosmopolitan character is thus strongly confirmed. The ICLEI is based more on the development of public transport, the preferred solution in large urban centers.
The “waste” industries form a framework for the local development of a combined energy-transport approach. For example, hydrogen as an unwanted byproduct in heavy industry that must be disposed of provides a source of energy that can be used by multiple specialized companies. The hydrogen network of Fukuoka in Japan is headed by the steelworks director.
Local policies can be classified in three categories according to the trajectory of carbon transport emissions since 1990. The first group (five countries of the 52 in the sample group: Japan, South Korea, Germany, the Netherlands and Malaysia) associates a reduction or stability in carbon transport with a significant level of electric vehicle sales. The second group includes the two very large nations in the sample (China and the United States) that combine local active policy, significant level of electric vehicle sales, participation in networks like the ICLEI and a failure to control carbon transport emissions for the period 1990–2011. The third group, the other countries in the sample, has a low level of electric vehicle sales and a lack of control over carbon transport emissions.
2.4.10. The spread of the hydrogen vehicle
The hydrogen vehicle uses an energy storage system whose weight increases little with the desired performance. For a range of 650 km, with comparable performances, a BEV should weigh more than 3 tons, three times more than an equivalent FCEV [THO 09]. The FCEV requires stations that offer hydrogen fuel; this is its primary disadvantage among electric vehicles [THO 09]. The first public policy program in favor of the hydrogen industry appeared in Iceland in 1998. These public policies were focused on R&D. Programs to establish open recharge stations for the public began to appear as the large manufacturers put hydrogen vehicles in their catalogues. The regulatory situation in France on January 1, 2015 was an example of the paradoxical situation of the spread of the hydrogen vehicle: the acquisition and circulation of these vehicles was authorized, but fueling stations could only be installed privately.
Several programs to establish a hydrogen fuel distribution network are in progress. The most advanced is the one in Denmark, with a private operator for H2 service stations, a French joint venture. The European directive from October 2014 requires national plans to implement alternative fuels, but this is only voluntary for hydrogen. An experimental program concerned six European cities (Copenhagen, Bolzano, Innsbruck, London, Munich and Stuttgart) and some highway routes.
The commercialization of the hydrogen vehicle began in Japan, with progressive openings of hydrogen fuel stations. The territorial coverage was only partially based on a route that went from Tokyo to the region of Mount Aso in the south. The hydrogen fuel distribution stations had various statuses: a French–Japanese coenterprise, networks that depend on cities or even ones that are linked to a “fatal” hydrogen producer.
In France, the hydrogen industry is led by parts manufacturers (fuel tanks, fuel cells), an industrial gas distributor (Air Liquide) and laboratories at large research organizations (CEA, CNRS and universities). The industry’s ambitions are limited in France to performing captive fleets, like the one put in place for the Manche département. French manufacturer groups (Renault and PSA) are in a wait-and-see position: they can convert existing platforms (Kangoo) to hydrogen (by adding fuel tanks and fuel cells). The manufacturer groups that offer hydrogen vehicles are Japanese (Honda, Toyota), Korean (Hyundai) and German (Audi-Volkswagen).
Approximately 200 hydrogen stations existed around the world on January 1, 2015, in the three large areas for electric vehicle development: North America and Japan–South Korea–China–Europe. The growth of this fleet of new-generation vehicles must occur progressively from an initial core, that of the first distribution networks: Japan, Denmark and California.
2.5. The primary electric vehicle markets
Table 2.6. The electric vehicle markets
| Pioneering | Emerging | Renewal |
| Pioneering markets, where there is little infrastructure and a reduced fleet | Emerging markets, marked by strong growth of the road vehicle fleet | Renewal markets, where the fleet is stable and where vehicle acquirers replace existing equipment. |
| Examples: Haiti, Philippines | Examples: Jordan, China, Romania | Examples: Belgium, Denmark, France, Japan, Sweden, USA |
| Countries where electrification is in progress: possibility to act beforehand by implementing a program for all transport energy | Countries that contribute the most in emissions: approximately 60% of the growth in carbon transport for a limited number of nations. Low pro-environmental values expressed by consumers | Implementation with an opposition between countries in Western Europe where there are large electricity producers and countries in Northeastern Europe with “local” energy production |
For road vehicle markets, we distinguish three kinds of market: pioneering markets, where there is little infrastructure and a reduced fleet; emerging markets, marked by strong growth of the road vehicle fleet; and renewal markets (see Table 2.6).
The planned measures and facilities offered for electric vehicles are available in most renewal markets. The electric vehicle is present in emerging markets, whereas accompaniment measures are rather infrequent there.
Table 2.7. Sales and cosmopolitanism (% HEV = relative weight of the market type in the total 2013 HEV sales.)
(Source: Automobile manufacturers, WVS wave 6)
| Market | % HEV sales | % FCEV sales | % PEV sales | Autonomous | Local affiliation | Global affiliation | Cosmopolitanism index |
| Pioneering | 0.1 | 0 | 0.1 | 0.73 | 0.91 | 0.8 | 0.82 |
| Emerging | 21.1 | 0 | 10.3 | 0.61 | 0.78 | 0.65 | 0.68 |
| Renewal | 78.8 | 100 | 89.6 | 0.77 | 0.88 | 0.75 | 0.8 |
Many characteristics follow a U profile for the succession of the three markets. Global affiliation (considering themselves global citizens) is stronger in pioneering or renewal markets and lower for emerging markets. The emergence phase corresponds to the low values for the different affiliations, which provides the lowest composed cosmopolitanism index (see Table 2.7).
Table 2.8. Energy mix (average country according to road vehicle market)
(source: World Bank)
| Energy mix | Carbon (%) | Gas (%) | Oil (%) | Percentage of fossil fuels | Nuclear energy (%) | Hydraulic energy (%) | Renewable energy (% | Hyd. and e Renew ) (%) | Countries with mining rev. >5% (%) |
| Pioneering | 9 | 16 | 24 | 49 | 0 | 48 | 3 | 52 | 27 |
| Emerging | 33 | 15 | 69 | 3 | 25 | 3 | 28 | 36 | |
| renewal | 22 | 30 | 9 | 61 | 14 | 17 | 8 | 25 | 18 |
The energy mix declines greatly with the emergence of the road vehicle market. It is not truly reestablished with the transition to a renewal market (see Table 2.8).
Table 2.9. Dynamics of atmospheric pollution
(source: World Bank)
| Kg carbon per capita | Percentage access to electricity | Soot 1990 | Soot 2011 | Evolution of soot levels | |
| Pioneering | 67 | 45 | 55 | 51 | –3 |
| Emerging | 267 | 88 | 72 | 52 | –19 |
| Renewal | 519 | 98 | 44 | 26 | –18 |
The atmospheric pollution indicators are reduced from the pioneering phase. The questionnaires from the WVS indicate the presence of environmental activism starting in the pioneering phase with the introduction of the road vehicle. The reductions obtained by adapted policies are seen to be starting in the emerging phase (see Table 2.9).
2.5.1. Pioneering markets
We will start with a comparison of two countries: the Philippines and the Republic of Haiti. Their respective metropolises, Manila and Port-au-Prince, are among the most polluted cities in the world. The air pollution in Manila has been studied and is the subject of a specific policy. Although it is classified as the fourth most polluted city in the world, ahead of Mexico City and its smog, the air pollution in Port-au-Prince is not documented; only the international health and sanitary condition indicators have been used to evaluate these environmental performances.
Manila makes up 70% of the road traffic in the Philippines. Among the largest metropolises in the world, it has one of the lowest carbon footprint values, 1,140 kg per capita, but a 4,000 inhabitant/year mortality rate is attributed to air pollution. This results from a very concentrated environment. There is local environmental activism, and there are several domestic producers of light slow electric vehicles meant particularly to be used as taxis in the capital. 60% of the transport pollution arises from tricycles, hence measures from the local authorities encouraging electric tricycles.
Statistical data on Port-au-Prince are, as a general rule, nonexistent. The city has sparse town planning, with steep terrain. The air quality there is not considered to be bad and is not listed as a concern by the Ministry of the Environment of the Republic of Haiti. Society is largely unequal and the politics highly centralized and personalized. Deforestation is connected to agricultural activity; the major natural risks are very significant. More than 80% of infrastructure was destroyed during the last earthquake in January 2010. A rapid succession of catastrophes formed a very short time period in which practical provisions were hard to establish.
If the grid for reading sustainability cultures can be applied to the local actors in Manila, this is not the case in Port-au-Prince, where we would rather need to speak of a survival culture. A recurring phenomenon with an anthropogenic origin, local organizations working on effective decentralization in the case of Manila; an absence of intermediate bodies, very violent shocks with a natural origin in the case of Port-au-Prince; these positive indications (Manila) and negative indications (Port-au-Prince) help to explain the notion of an “emancipatory catastrophe” proposed by Ulrich Beck.
2.5.2. Emerging markets
In the case analysis of the communes and energy policy in Jordan, the introduction of a sustainable development issue comes through a reform of the energy sector, the development of planned coordination, though to the detriment of the local elected representatives [VER 11]. This projection in longer time periods is the problem found both in Port-au-Prince and Manila. A rational administration offers green, sustainable city plans, but these plans are followed by few concrete results. Cities actually find themselves distanced from development programs, e.g. in an area reserved for photovoltaic technologies [VER 11]. This technocratic idiosyncrasy partially replaces the very low operational capacity of decentralized units in the case of pioneering markets.
Emerging markets form the “crux” of environmental values, with a collective search for private happiness, the slightest autonomy and the slightest local and global affiliations. In Romania, one of the emerging markets within the European Union, consent to pay for climate change is at a minimum, 37% versus 58% as the average of the 27 countries in the European Union in 2009 [NIS 13].
For China, studies highlight a problem trusting the electric vehicle and the significance of practical provisions in relation to the installation of charge stations in urban areas [LO 13]. Although FCEV demonstrators were used in Beijing and Shanghai, and although a national, regional and local policy exists in favor of electric vehicles due to the importance of episodes of smog in Chinese cities, electric vehicle sales struggle to take off. PHEVs represent a glimmer of hope for China. With well-founded sectors for the electric vehicle, planned programming, but difficulties commercializing and real-scale operationalism, emerging markets seem to be on the side of Utopia in the schema of sustainability cultures. The transition toward a median position of positive and emancipatory culture is a major stake for controlling carbon transport emissions.
2.5.3. Renewal markets
Eastern Europe is dominated by energy giants that push for policies that are not necessarily optimal for energy efficiency. The recommended solutions in Northern and Eastern Europe may be based on better energy efficiency through the direct involvement of territorial collectives in energy production.
Center/Suburban approaches hoped to encourage concentration phenomena through local consequences favoring the center, to the detriment of the Suburbs. Here, it is not possible to construct production and distribution sites in the center, and the modal report is most intense there. Furthermore, strategies for reducing CO2 emissions have to be developed with a focus not only on the transport sector in and of itself but also on energy provision. This is a dimension that absolutely must be taken into consideration in order to remedy the problem in an efficient way for the long term [OSH 14].
Electric vehicle territories are therefore peripheral spaces: a production site, like a hydrogen production plant using waste from purification stations, can be built in a peripheral area. Likewise for a distribution station, either an autonomous production unit using local renewable energy or a distribution site provided by a distant area can be used. These peripheral spaces are integrated, however, with access to the electric grid.
A complete design of the energy and transport policy is easier to access in less densely populated environments. The recovery of “fatal” sources (resulting and generally lost energy production) can be pushed to the forefront. Two designs of energy networks arise from this:
- – either top down (from the Center to the Suburbs) with production in large units. This is less favorable to energy efficiency, but it finds support in “historic” electric monopolies and in large cities interested in basing themselves on a principle of territorial equalization;
- – or with peripheral dynamics. These are the ones observed in the spread of the electric vehicle. A configuration of interconnected local networks exploiting local resources (purification waste, etc.) seems more appropriate for fine management of emissions and energy production;
- – every analysis highlights the importance of the coherent integration of environmental and innovation policies for the emergence, consolidation and spread of radical pro-environmental innovations.