
Chapter 3
Power BI Architecture
In This Chapter
• The Power BI Architecture
• Power BI Desktop Optimizations
• Power BI Updates
• Microsoft On-Premises Data Gateway
In Chapter 1, we discussed the fact that Power BI is not a single tool but a set of tools. In that chapter, we also touched briefly on the software and services where these Power BI tools reside. In this chapter, we will take a close look at each of the various applications and websites that make up the Power BI architecture.
The Power BI Architecture
As noted previously, the capabilities that are now brought together under the name Power BI have shown up in a number of different places as parts of different tools and with different names. Microsoft rearranged the various pieces as it worked to find the right platform for business users to create self-service business intelligence. Here we examine where each of these tools has found a home within the Power BI architecture.
Power BI Desktop
Many of the Power BI parts and pieces have come together in a Microsoft Windows application called Power BI Desktop. This is the authoring environment for all things Power BI. Power BI Desktop allows a user to create their own business intelligence environment by gathering data from a variety of sources and loading it directly into a data model. Visualizations may then be created from that data model in the same workspace. The Power BI Desktop startup screen is shown in Figure 3-1.
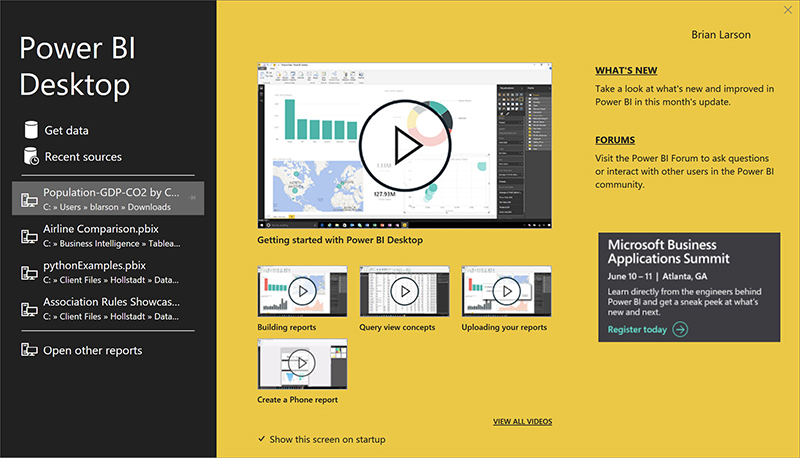
Figure 3-1 The Power BI Desktop startup screen
The tool that started life as Power Query now creates queries in Power BI Desktop. However, these queries do more than just select the data from the data sources. The queries in Power BI Desktop transform the data so it is ready to be loaded directly into a data model.
The xVelocity In-memory Analytical Engine (VertiPaq engine) stores and retrieves data within Power BI Desktop. The tool that began as Power Pivot now manages data models in Power BI Desktop. Last but not least, the tool once known as Power View now creates visualizations as part of Power BI Desktop. The visualization tool has grown and matured. Many new visualizations have been added, along with the ability to create and add your own.
Power BI Desktop brings all of these tools together in one BI creation tool. Within Power BI Desktop, the user can gather, store, model, and visualize data. Power BI Desktop does it all—almost. What Power BI Desktop doesn’t do is share content with others.

NOTE
See the section titled “Power BI Desktop Optimizations” for information on the two distinct versions of the Power BI Desktop application.
The Power BI Service
One way to share the content created in Power BI Desktop is to publish it to the Power BI Service, otherwise known as PowerBI.com. Once the content is on PowerBI.com, it can be explored online in several different ways. Users can interact with existing visualizations or use a browser-based, Power BI Desktop–like interface to manipulate the model and create new visualizations. Users can also query the data using a natural language interface called Q & A. Content from the Power BI Service can also be shared with others and embedded in your own custom applications.
Each user obtains their own login to access the Power BI Service. This access is free within certain limitations. Check the PowerBI.com site for information on the current limitations on free access. Even if you need more capacity than the free access allows, the subscription access is currently just US$9.99 per month. Again, consult the PowerBI.com website to determine the current subscription cost and terms.
An example of the Power BI Service personal home page is shown in Figure 3-2.
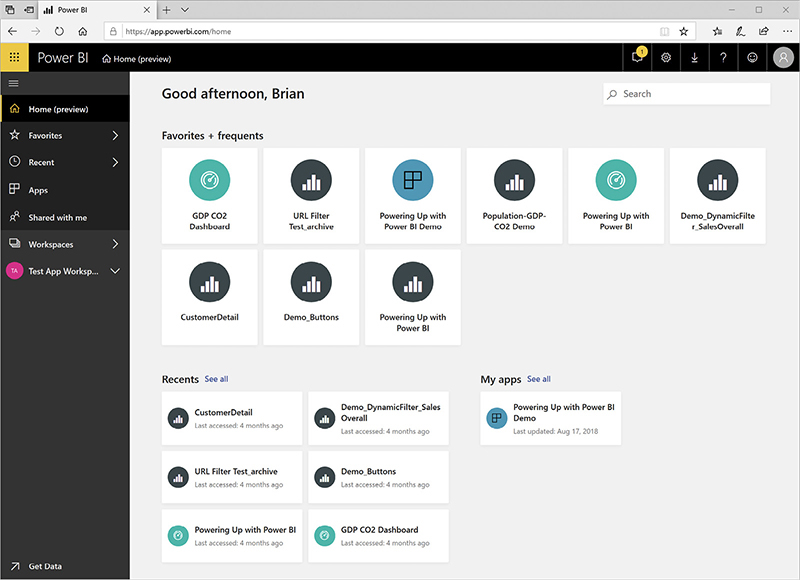
Figure 3-2 The Power BI Service personal home page
NOTE
You may notice when you enter “powerbi.com” in your browser address bar that you are actually forwarded to “powerbi.microsoft.com” with the appropriate language added on the end. For simplicity, I will refer to this site as PowerBI.com in this book.
The Power BI Report Server
In addition to publishing to PowerBI.com, you have another option when you wish to share your Power BI content with others. While PowerBI.com provides a home for your content in the cloud, there is another tool that will host Power BI content on your own servers. That tool is the Power BI Report Server. An example of the Power BI Report Server home page is shown in Figure 3-3.
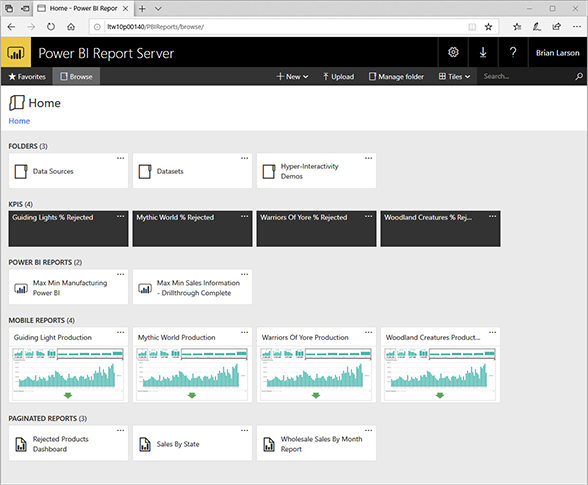
Figure 3-3 The Power BI Report Server home page
The Power BI Report Server is a customized version of the SQL Server Reporting Services (SSRS) server that can manage and render both SSRS content and Power BI reports. Users access reports on the Power BI Report Server using a version of the Reporting Services web portal. This browser-based application provides the interface for organizing, securing, and executing reports. Figure 3-3 shows an example of the Reporting Services web portal user interface. The groups of KPIs, mobile reports, and paginated reports are examples of SSRS content hosted on the Power BI Report Server.
All of the various types of content on the Power BI Report Server can be organized into folders. Categorizing reports in folders makes it easy for users to find the report they are looking for. Folders also make it easier to manage the security access rights of a group of items all at the same time.
The Power BI Report Server is licensed through Power BI Premium or through a SQL Server Enterprise Edition license as part of a Microsoft Enterprise Agreement/Software Assurance (EA/SA).
The Power BI Mobile App
Content placed on PowerBI.com or on the Power BI Report Server can be viewed and interacted with using any modern browser. Those looking for a richer experience on a mobile device can download the Power BI native mobile app for their particular phone operating environment. The mobile app allows you to interact with the data in addition to simply viewing the content.
An example of a Power BI Mobile screen on a smartphone is shown in Figure 3-4.

Figure 3-4 The Power BI Mobile app on a smartphone
Power BI Desktop Optimizations
There are two distinct Power BI Desktop optimizations. One is optimized for publishing content to PowerBI.com. We will refer to this as the “Power BI Service” optimization of Power BI Desktop. The other is optimized for saving content to the Power BI Report Server. We will refer to this as the “Report Server” optimization of Power BI Desktop. It is important to use the correct optimization when creating your content, based on how you will be sharing that content. When building content to be shared using PowerBI.com, use the Power BI Service optimization. When building content to share using an on-premises Power BI Report Server, use the Report Server optimization.
NOTE
The Report Server optimization of Power BI Desktop is also able to publish content to PowerBI.com. The Power BI Service optimization of Power BI Desktop is not able to save content to a Power BI Report Server.
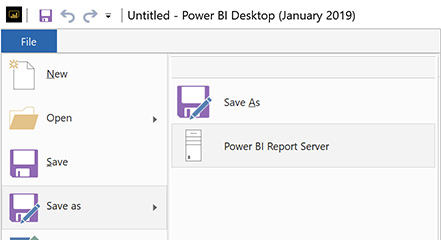
There are two ways to tell the difference between the optimizations of Power BI Desktop. The first is through the application icon, and the second is through the content of the File | Save As menu.
The Power BI Desktop application icon is a column chart within a rounded-corner rectangle. In the Power BI Service optimization of Power BI Desktop, the rectangle and column chart are black on a yellow background. In this version, there is no submenu under the File | Save As menu.
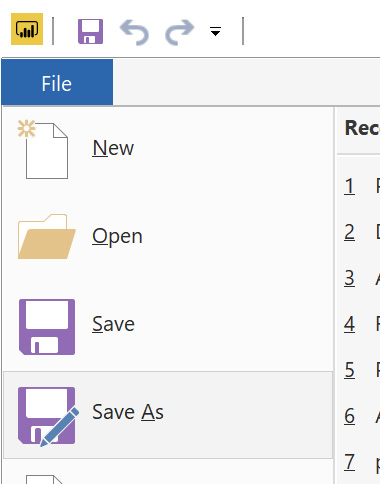
In the Report Server optimization of Power BI Desktop, the rectangle and column chart are yellow on a black background. In this version, there is a submenu under the File | Save As menu that includes an option for saving to a Power BI Report Server.
The best way to obtain a copy of the Power BI Server optimization of Power BI Desktop is from PowerBI.com. Follow the procedure described in the “Obtaining Power BI Desktop Software” section of Chapter 1. If you followed those instructions to get Power BI Desktop, that means you installed the Power BI Service optimization of Power BI Desktop to complete the exercises in this book. In reality, either the Power BI Service optimization or the Report Server optimization of Power BI Desktop can be used to complete the data gathering, modeling, and visualization exercises in this book, as long as it is the July 2019 version or later.
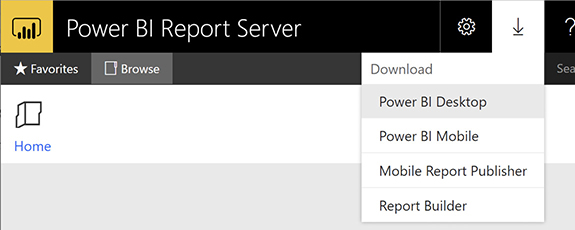
The best way to obtain the Report Server optimization of Power BI Desktop for deploying to the Power BI Report Server is from Power BI Report Server. (Was that too obvious?) More specifically, from your installation of Power BI Report Server. More on why that is important can be found in the next section. Use the Download menu (the down-arrow icon) in Power BI Report Server to initiate the download of the corresponding version of the Report Server–optimized Power BI Desktop software.
Power BI Updates
As Microsoft has embraced cloud-based computing, it has moved toward shorter and shorter delivery cycles. Power BI is one of the environments that has benefited the most from this change in philosophy. New features and visualizations, as well as any necessary bug fixes, are available on PowerBI.com, the Power BI mobile app, and the Power BI Server optimization of Power BI Desktop. If you are sharing your content through PowerBI.com, you will want to get in the habit of downloading the latest and greatest version of Power BI Desktop and the Power BI mobile app monthly to stay current and to take advantage of the latest features.
As noted in Chapter 1, as new features come out, I’ll provide updated content to supplement this book and keep explanations and examples current. That content will be available at www.teamscs.com/powerbi. That content will keep this book alive and growing as Power BI continues to grow.
Microsoft is also continuing to upgrade the Power BI Report Server and the Report Server optimization of Power BI Desktop. However, this is happening about once a quarter. Your organization will need to decide how often to upgrade your installation of Power BI Report Server to the latest version. Each time that upgrade occurs, Power BI report authors will need to use the Download menu in Power BI Report Server to obtain and install the new version of Power BI Desktop.
When you’re sharing data through Power BI Report Server, it is important to keep the versions of Power BI Report Server and Power BI Desktop in sync. If you obtain a newer version of Power BI Desktop elsewhere, you may use features in your reports that Power BI Report Server is not able to render. If you don’t upgrade Power BI Desktop to match a Power BI Report Server upgrade, you will be missing out on new features!
Microsoft On-premises Data Gateway
In Chapter 1, we discussed the various ways Power BI can be utilized. We can use Power BI as a data visualization tool against a data model that exists elsewhere. We saw that this type of Power BI connection is called Live Connection. Alternatively, we can create our own data warehouse/data mart by storing the data within Power BI. This type of Power BI connection was called Import. Using either of these methods, you can see that, as we deploy content to PowerBI.com, we are going to have problems when our data sources exist on premises.
If we use Live Connection, how can a Power BI visualization existing in the cloud access a data model on our network? If we use Import, the data goes up to the cloud when we publish our content. However, we will eventually want to refresh that data in the cloud from our on-premises sources. How do we allow data to move securely from on-premises sources to Power BI content in the cloud, as shown in Figure 3-5?
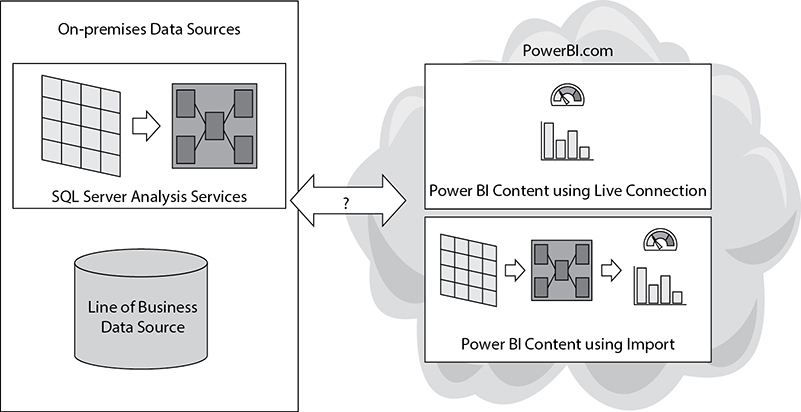
Figure 3-5 Data access from the cloud to on-premises sources
This secure data movement is achieved using the Microsoft On-premises Data Gateway shown in Figure 3-6. While not technically part of Power BI, the On-premises Data Gateway is an important piece of the Power BI architecture when sharing content via the cloud. Using the On-premises Data Gateway, we can successfully use Live Connection from the cloud as well as update imported data in the cloud.
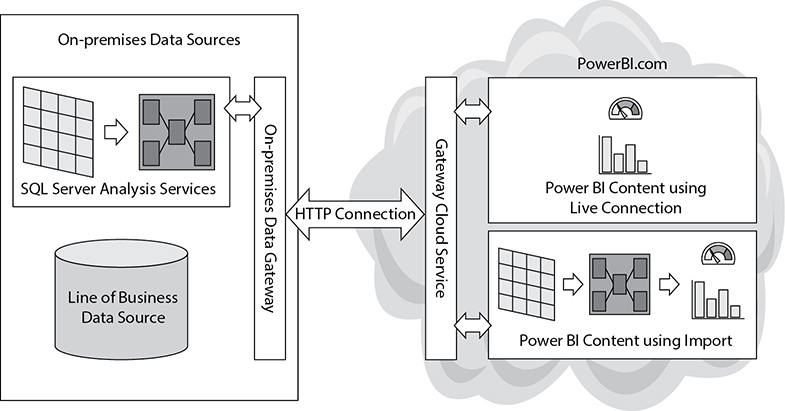
Figure 3-6 The On-premises Data Gateway
The On-premises Data Gateway runs on a server within your network. It is constantly making Hypertext Transfer Protocol (HTTP) connections to PowerBI.com. This connection takes place through a feature of the Microsoft Azure cloud infrastructure called the Gateway Cloud Service. The Gateway Cloud Service relays any requests for data coming from Power BI content to the On-premises Data Gateway, which in turn queries the appropriate data source and returns the results.
As noted, the On-premises Data Gateway uses standard, outbound HTTP requests. This is the same type of communication a browser uses when communicating with the Internet. Because of this, there is no need to make any modifications or open any holes in your organization’s network security.
We will look at the Microsoft On-premises Data Gateway again in Chapter 15.
What Does the Data Have to Say?
Enough background material. In Chapter 4, we will actually start using Power BI. You will work with real Power BI visualizations to see how they let your data speak to you. Also, you will learn how to interact with the data to ensure you properly understand what it is trying to say.