
6
Operationally Relevant Preprocessing
This chapter covers operationally relevant preprocessing, including a specialized analytical framework called Trinity Sight, which supports integrated analysis of time, space, and behavioral indicators or threats. This chapter also covers some frequently used data resources that have unique value as well as significant challenges (e.g., telephone and Internet data).
6.1 Operationally Relevant Recoding
In general, analysts should expect to spend approximately 80% of their time preparing the data and 20% of their time analyzing it.1 While this sounds like a terribly unattractive prospect, if the data preparation is done well, huge benefits in the overall quality of the analysis can be reaped. Moreover, the analysts will gain additional insight into the data, which can further refine the analysis.
It frequently is advisable to categorize and recode as much continuous information as possible. Even categorical data can be further aggregated into smaller sets or binary data, depending on the requirements and overall objectives of the analysis. For example, motive might be reduced to “drug-related” and “nondrug-related,” or “domestic” and “other.” In data mining, sets or binary data (e.g., yes/no) seem to work well and often are preferable to continuous data. Sets or binary data also tend to increase the likelihood that the generated model will be actionable. Of course, if the data logically are continuous (e.g., pursuit speed), it does not make any sense to recode them into sets this early. But if it is possible to recode continuous data into categories, this can facilitate subsequent exploration and analysis. This issue will be revisited due to its importance to operationally relevant data mining.
This is not to say that the original data should be discarded during the recoding process. Recoding generally should represent the creation of new variables that are derived from the original data rather than replacement of the data. The original data may become particularly useful when the results are being evaluated and validated. For example, it is not unusual for a large number of calls for service to be generated for the local emergency department. The ability to link those calls back to a specific location may be important to accurate interpretation of the findings. Similarly, when data have been derived from unstructured narrative, it may seem reasonable to discard the original information. It is impossible to know, however, how subsequent information or analysis may change the interpretation or meaning of the original information. Like the data mining process, data recoding also may represent an iterative process. As the data are probed and explored, different strategies for recoding and analysis might emerge. Therefore, new variables should be created and the original information retained.
6.2 Trinity Sight
Most problems or challenges in public safety and security can be reduced to an analysis of time, space, and the nature of the incident or threat. In response to the unique importance of these three factors, our team at RTI International has developed the Trinity Sight analytical model. Trinity Sight is a special application of the Actionable Mining and Predictive Analysis model presented in Chapter 4 and includes an integrated analysis of time, space, and the nature of the incident or potential threat. As always, the emphasis is on operationally meaningful, actionable output, which frequently begins with operationally relevant preprocessing.
Time
There are many ways to begin exploring data for recoding; however, there are some standard techniques that can be used to start the process. Preliminary steps include parsing the data by various temporal measures (e.g., time of day, date, day of week, month, season). For ease of use, time of day can be divided into time blocks or shifts. This is particularly useful when considering deployment issues, as it is much easier to staff from midnight to 0800 hours than 0258 hours +/–53 minutes. Four- to eight-hour time blocks work well for deployment analysis. Personnel generally do not work four-hour shifts, but using a four-hour level of analysis does afford some flexibility, as eight- or twelve-hour shifts can be overlapped to provide additional coverage for time periods associated with greater anticipated workload. Shorter than four-hour time blocks becomes cumbersome, as the number of time blocks within the day increases and it is unlikely that very brief time blocks will have any value from a deployment standpoint.
One exception to this is periods of time that are associated with specific incidents or anticipated events. For example, juvenile delinquency may spike for the relatively short period between school dismissal and when parents return home from work. In this case, establishing a time-limited deployment strategy around this relatively short yet high-risk time period makes sense. Similarly, it is not unusual to observe transient increases in aggravated assaults associated with the closing of bars and nightclubs, followed by an increase in armed robberies. In this situation, these relatively transient spikes in crime can be related to the movement of a common victim population: bar patrons. Aggravated assaults, brawls, and tussling frequently are associated with the generalized mayhem of bar closings in areas densely populated with nightclubs. As these individuals make their way back to their vehicles, they make good targets for street robberies given the low lighting associated with the time of night and the increased likelihood that the victims’ judgment has been impaired from a night of drinking. Therefore, an effective response to these related patterns could include relatively brief, targeted deployment to the specific areas in question. The nightclub area would be addressed first, with an established police presence in anticipation of bar closings and the associated crowd control issues. These same resources could then be flexed to parking lots, side streets, and other areas associated with street robberies of these same patrons. This type of fluid deployment strategy can serve as a functional force multiplier because two seemingly different crime patterns are linked and addressed with the same resources. Because a common victim population is identified, the same personnel could be used to address two, relatively brief, time-limited challenges that appear to be very different at first glance (aggravated assaults and street robberies). Strategies like these require significant domain expertise and an excellent working relationship with operational personnel to validate the interpretation of the results and associated approach. The use of creative analytical strategies and fluid deployment can optimize public safety and security resource allocation.
Time blocks longer than eight hours often yield diminishing returns, as important fluctuations in activity are diminished with the increased amount of data, which can be referred to as regression toward the mean.2 Similarly, it does not make much sense to establish time blocks, even if they are the appropriate length, that do not match the existing or desired times for shift change. For example, in the development of a strategy to reduce random gunfire on New Year’s Eve, we found that the majority of the random gunfire occurred during a four-hour period that spanned from 10:00 pm on New Year’s Eve to 2:00 am on New Year’s Day. While it might be attractive from a cost standpoint to craft a four-hour initiative to address this issue, it is not good personnel management to ask the staff assigned to the initiative to come in and work for only four hours. In that situation, it made sense to expand the time block somewhat to make it more attractive to the folks working that night. If there is not some pressing need to change existing times, it works best if the data are analyzed and the models constructed to reflect existing shift change times.
This scheduling issue can be managed at several points along the analytical process. During data entry and recoding, the analyst should consider what particular time blocks would make sense from a scheduling standpoint. Does the department use eight-hour shifts, twelve-hour shifts, or is there some opportunity for overlap during particularly busy periods throughout the day? The answer to this question will dictate to a certain degree what level of data aggregation more closely reflects the staffing preferences, and therefore be the most easy to interpret and use. This is not to suggest that everything should remain the same because “that is the way it always has been done.” This type of thinking can really squander resources, particularly personnel resources. Rather, working within or relatively close to the realistic, real-world parameters significantly increases the value of a model and the likelihood that it will be used.
Recoding specific dates into days of the week is a relatively standard practice. It is important to remember, however, that time of day can be important in the analysis of daily trends. For example, it was puzzling to discover a large number of street robberies on Sundays until the specific times were examined. This analysis almost always revealed that these robberies occurred during the early morning hours and actually reflected a continuation of activity from Saturday night. Seasonal variations also can be important, particularly if they are related to the migratory patterns of victim populations (e.g., tourists). Other temporal recoding to consider may include school hours and holidays, as the unsupervised time between school dismissal and when parents return home from work can be associated with considerable mischief. Curfew violations and truancy also are associated with unique time periods that might have value if recoded appropriately.
Recoding should be considered an iterative process. As patterns and trends are revealed, different approaches to recoding or emphasis will emerge. For example, it is not unusual to find increases in criminal activity associated with payday. Therefore, recoding the data to reflect paydays could add value to modeling efforts and related operations. Similarly, events such as concerts and sporting events may be related to public safety challenges or issues. Revealing those relationships and creating derived variables that document these events could result in the creation of more accurate or reliable models that will support better operational decisions. The ultimate question to be answered, however, will determine what time parameters are most appropriate.
Space
The advancement of GIS capacity has enabled analysts to have access to very precise spatial data. While this information can be extremely helpful for mapping tasks, it may not confer the same benefit to analysis. In fact, it might even hinder analysis if it causes the analyst to focus on specific locations rather than trying to identify general spatial patterns and trends. The criminals involved in many patterns of offending, particularly those involved in serial crimes (e.g., burglary, robbery, rape), generally do not target the same location repeatedly unless they are focusing on a common location for the identification of or access to victims. Rather, they tend to select locations that are similar in nature and/or geography. These similarities could be as simple as a series of armed robberies in the same general location or as complicated as a group of similar locations that span a broad geographic range. Therefore, a second task during preprocessing is spatial recoding.
Differences in reporting can further confound this issue. For example, a location could be reported as a specific address (401 Main Street), a hundred block (the 400 block of Main Street), an intersection (4th and Main), a specific landmark (in front of the convenience store), or even in terms of its longitude and latitude. Hierarchical organizational strategies that can be expanded or collapsed are quite useful in these situations. For example, 401 Main Street also could be recoded and analyzed as the “400 block of Main Street,” “Main Street,” and a “convenience store.” Additional variables could be created that correspond to various patrol areas, precincts, traffic zones, dispatch regions, or census tracts. Any or all of these can have value if they help to further define and characterize a trend or pattern, and if they are actionable for the end user. While apparently simple, these decisions may not be easy or initially obvious. For example, census data are rich with information that can be used to further characterize crime trends and patterns. Unfortunately, census boundaries change over time and may not be linked directly to any recognized public safety patrol boundaries. Therefore, census data and associated tract boundaries are limited in their ability to guide very specific deployment strategies or approaches.
Additional spatial attributes to consider include the functional aspects of the location or space, particularly those attributes or features that would confer some tactical or strategic value or advantage to the suspect. Factors to consider include the nature of the space or facility. Is it a park, a single family dwelling, or a multiunit apartment? Is it a business? Is there known, ongoing criminal activity such as an open-air drug market near the location of interest? Is the behavior associated with a common person or event? Are the events or incidents in question associated with occupied or unoccupied dwellings? Considerations also include the identification of spatial features or attributes that could provide cover, concealment, or easy access and/or exit for the criminal. For example, proximity to highway on-ramps may be an important qualitative feature to include as a variable. Banks that are in grocery stores also represent a unique target and tend to show up in series. The use of orthophotography images or other detailed mapping layers can provide additional value to the analyst as they try to reveal attributes.
It is important to remember that locations may not be fixed in space. The exact physical location may have little to no value in an analysis of unusual or suspicious behavior on a moving location like a commuter train or airplane. For example, several of the 9/11 highjackers were seated in first class, which presumably facilitated their access to the cockpit. In this situation, the relative position within the plane is the relevant spatial variable.
Notable exceptions to the “crime generally does not occur in exactly the same location” rule include open-air drug markets and hostile surveillance. Repeated identification of similar behavior or activity associated with a common location could suggest possible surveillance activity. Terrorists, burglars, and predatory violent offenders may spend considerable time observing possible target locations or individuals. It is unlikely that the suspect in these situations will use the exact same location repeatedly. Rather, suspicious or unusual behavior will be correlated in the same general location or focused on a common area or target, so it is important to identify qualitative aspects of these locations. For example, one person may be observed watching the same critical facility from several different vantage points. In this case, the observation point is important, but the target of the observation can be even more critical to the analysis.
Two people to consider when recoding spatial data are the suspect and the end user. Particularly in threat assessment and surveillance detection, it is important to identify the object of the suspect’s interest. For example, if a suspicious person was observed filming a fire drill in front of a bank, spatial variables of interest would include not only the location of the suspect but also the target of interest: the bank. Thinking in terms of the end user, the information regarding the position of the suspect can be used to guide surveillance detection operations. The object of the suspect’s interest, however, has significant implications for threat assessment and related activities. Therefore, clarification of the potential target can help refine the analysis further, as well as provide specific guidance for the threat assessment. For example, noting that the suspect was observing the north face of a school is good, but specifying interest in a specific aspect of the building, like the school bus loading zone, provides even more information regarding likely intentions and related operational value.
Always remember, though, to recode rather than replace. In some situations, the focus will change over time as the suspect refines his approach or plan. Being able to document these changes can be extraordinarily valuable from an operational perspective, particularly if it can be used to highlight increasing specificity of a threat or efficacy of target hardening and deterrence. So be sure to retain the original spatial measures to support subsequent analyses as the behavior or interpretation of the behavior changes.
Nature of the Incident or Threat
The line between the spatial attributes of the incident and the nature of the incident or threat becomes increasingly blurred as the location is examined with progressively more thought to the potential threat. For example, in a review of stranger rapists, we found prior burglaries to be a reliable predictor.3 Further analysis revealed that preferential targeting of occupied dwellings was an even better indicator. While this feature could be considered as a spatial qualifier, it also had relevance in the evaluation of the nature of the incident or threat. A link between the behavioral aspects of an incident and the location can be a particularly relevant variable when common behaviors are observed in the same or similar locations. For example, observing someone taking a photograph of a building may not be relevant until it is noted that the same or similar buildings have been photographed multiple times previously.
Some qualitative aspects can be used to document changes or infer escalation. For example, in an analysis of suspicious behavior in and around a critical facility, I categorized the behaviors generally into “photography,” which was confined to still photography; “video,” which included videotaped observation; “approach,” which included probing the perimeter, attempting to gain access, or asking security-related questions of facility personnel; and “suspicious situations,” which encompassed everything that did not fit into another category.4 The results of the analysis are covered in more detail in Chapter 14; however, recoding the nature of the activity into four discrete categories facilitated characterization, analysis, and interpretation of the behavior, which would not have been possible if the data remained in its native, unstructured form. Perhaps more importantly, this recoding strategy and analysis revealed a shift in the suspicious behavior over time from still photography to more operationally relevant surveillance, including video and security probes—highlighting this particular facility as worthy of additional evaluation and focus.
Recoding offense information to highlight the nature of the incident or threat can be particularly time consuming, as this information is almost always included in the unstructured, narrative portion of the offense report, as well as in supplementary investigative notes and even case briefings. Moreover, it is not always readily apparent what is important, or even what the most relevant recoding strategy might be at the beginning of an analysis. Over time, however, as the data are analyzed and/or additional cases come to the attention of the analyst, a recoding strategy or organization generally will emerge. Most analysts realize the importance of this information, particularly as it relates to MO, and already engage in a certain amount of recoding. Common strategies and themes are addressed in Chapter 10.
6.3 Duplication
As mentioned in the previous chapter, law enforcement and security data frequently contain significant amounts of duplication, which can inflate the numbers for certain types of calls and skew analysis. For example, shots fired in an area can prompt several individuals to call 911. While it can be interesting to speculate about what it means when several people call in one neighborhood while another neighborhood has less citizen involvement, police executives and command staff generally are more interested in what happened. That is, their focus is on how many specific incidents of random gunfire occurred in a particular area at a specific time, not on how many people called in to report the incident. Working within the parameters of the particular data set (How are calls numbered? Are duplicate calls identified and flagged?) will depend on the specifics for each complaint database. The important thing, though, is that the analyst always is aware of the potential for duplication within data and can identify ways to address it if it will skew the analysis or results.
6.4 Data Imputation
Data imputation is the technical term for “filling in the blanks” when missing data are encountered in a sample. There are multiple methods for data imputation, but they all generally can be described as methods of determining a likely value for missing data based on an analysis of available data. Many data mining software tools and statistical packages include methods and tools for “filling in the blanks” associated with missing data. Like almost anything, though, just because you can do something does not necessarily mean that you should.
Missing data is a frequent occurrence in public safety and security analysis. In some situations, missing data can be important in and of itself. For example, an individual perpetrating fraud might complete every section on a fraudulent credit application in the mistaken belief that this is routine practice for most applicants. The presence of missing data or common skip patterns in these applications could be an important indicator of a valid application. Similarly, some interviewing techniques or statement analysis tools (e.g., Scientific Content ANalysis, or SCAN), specifically look for missing information in a statement or interview as a possible indicator of deception. In those particular situations, the missing data are noteworthy in their absence, and to use data imputation techniques would obscure that finding.
On the other hand, many incidents or events of interest to public safety and security analysts are extremely rare. Missing data can seriously limit or even preclude meaningful analysis of these data, and it would seem that data imputation would represent the only recourse in these situations. Further compounding the challenge associated with infrequent events, however, is the finding that these rare events frequently tend to be heterogeneous. In other words, they may differ between each other in important ways. Data imputation methods are based on the assumption that the available data can be used to identify a reasonable proxy for the missing data. By using data imputation techniques, which fill in missing data based on an analysis of complete records, unusual findings might be magnified or overrepresented. Again, just because a technique is available to the analyst does not mean that it should be used. In some cases it is better to accept the existing limitations of the data, even if this means termination of the analysis, rather than to misdirect resources or otherwise compromise public safety.
6.5 Telephone Data
Analysis of telephone data can be extremely tedious. However, it is one area in which data mining and predictive analytics can make a huge difference in analytical capacity. By using reverse lookup programs or websites, some value can be added to telephone numbers, even if specific information or identifiers associated with a particular number is unobtainable. For example, in the absence of specific subscriber information or content, the telephone numbers themselves can be decomposed, aggregated, and recoded to reveal additional information regarding location. While staring at a page full of numeric data is not much fun, manipulation of these data can reveal a considerable amount about relationships, timelines, transactions, and a variety of other information that holds value to public safety and security analysis. Therefore, telephone records comprise an extremely valuable data resource that can be exploited very well through the use of automated methods.
There are several initial recoding steps that can add value to telephone data almost immediately. Many of these can be time intensive, but the major time commitment in data mining frequently involves the initial cleaning and preparation of data. This time investment almost always pays high dividends by increasing both the data quality and our understanding of the data. Through the data preparation process, knowledge is increased, and subsequent analyses frequently become apparent as the data are explored and prepared.
Most analysts know the value of reverse lookup tables and websites. In addition, many analysts also know that telephone numbers can be decomposed into separate components that have value, even if the specific subscriber cannot be identified. For example, a fair amount of information can be obtained from the following telephone numbers:
011-202-633-XXXX
011-201-228-XXXXX
The first number is associated with a telephone number in Cairo, Egypt, while the second number is linked to a cell phone in Egypt. As illustrated in Table 6-1, some generic recoding can be done by breaking the numbers up into their component parts in a database. This will add value to subsequent analyses.

By using reverse lookup tables, information can be added to provide geographic and regional specificity to the data. In some cases, individual subscribers can be linked to a specific number. It is also frequently possible to identify or link a particular service provider to a telephone number, even if the number is unpublished or associated with a cell phone. This service provider information can then be used to generate a subpoena for additional subscriber information, if necessary. Building on Table 6-1, information can be added through recoding, as shown in Table 6-2.

While this can seem tedious, recoding telephone numbers in this fashion adds value to the data that can be used later to identify and cluster seemingly unique numbers based on geography and regions. This can be of tremendous value in and of itself and can be essential if additional, geographically specific data (e.g., shipping records) are added to the analysis.
Additional points to consider include the fact that telephone numbers can vary in length and how the numbers are divided into sections. For example, some international numbers, like the Egyptian mobile phone number listed above, do not have seven digits. Additional numbers associated with various extensions or routing within a system can increase the variability in telephone numbers. This information comes at the end of a telephone number and may (but does not always) include the “#” or “*” symbols to indicate the selection of additional extensions. These differences can be accommodated, however, if the analyst is aware of or can anticipate them and includes some flexibility in the data set.
The analysis of telephone data can become complicated further when the target of an investigation utilizes multiple telephone numbers. For example, many people now have cell phones in addition to home telephones. While adding a work or business phone greatly increases the amount of information that needs to be integrated and correlated, many new analytical packages can readily accommodate this. In these cases, the use of date as a common linking variable or key generally represents a good option. Additional information including meetings, delivery schedules, and financial transactions might all add to the complexity of analyzing criminals and related organizations; however, it can greatly enhance the analytical process. Again, the use of some common linking variable or key, such as date, can greatly facilitate analysis and interpretation of the results.
6.6 Conference Call Example
The next example is based on an actual analysis, but many of the details have been changed to protect the confidentiality of the information and any associated investigations. This example highlights how complicated the analysis of telephone records can become, while highlighting the insight that data mining and predictive analytics can provide. In short, it would not have been possible to analyze these data without the application of data mining and predictive analytics.
Recent advancements in telecommunications have influenced the way that many of us do business, and criminals are no exception. It now is possible to hold a meeting with individuals from the United States, South America, and the Middle East without any of the participants needing to leave their home or office.
In the past, traditional surveillance techniques were used to determine relationships and organizational structure by documenting liaisons and activities. While these techniques will always have value, the same telephone and Internet conferencing techniques that save time and money for businesses also afford a greater degree of anonymity to those wishing to keep their relationships and activities hidden.
The following example is based on real case materials. While many of the details have been changed, the analytical approach and techniques are identical.
The local police department received a thirty-seven-page invoice that was associated with a large, unpaid bill (Figure 6-1). The telephone conference call service quickly determined that the information used to establish the account was fraudulent, and they had no additional leads to pursue. Additional information from the company suggested that this series of calls might have been associated with a particular criminal enterprise. Therefore, it was determined that analysis of these data might provide some clues regarding the identity of the participants, so that the teleconference company might attempt to recover its losses. This case also gave us an opportunity to gain additional insight into this organization and how similar criminal organizations might use and exploit teleconferencing to plan operations and disseminate information.
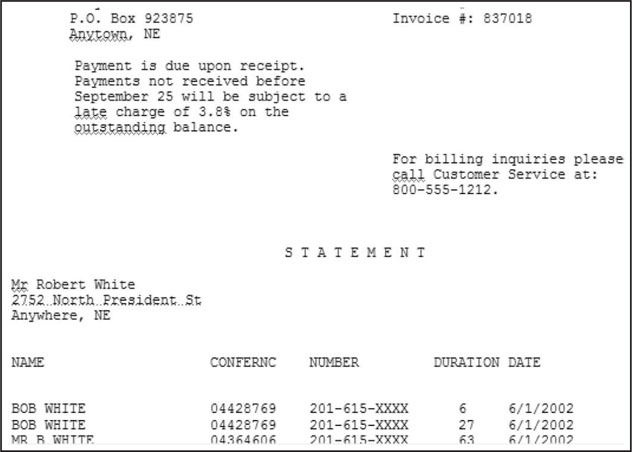
The first step in the process was to obtain an electronic copy of the bill, which arrived in text format. Unfortunately, this is not always possible. Rekeying data is both tedious and fraught with error, but it is necessary in some cases.
Like most invoices, this bill had a large amount of extraneous information that needed to be removed, including header information and additional text related to the organization’s invoice process (Figure 6-2). After this information had been removed, the resulting document included the conference IDs (a unique number assigned by the conference call company), the participants’ telephone numbers, the duration of the calls, and the dates. A name was present in less than 5% of the cases. While it was assumed that these names were fraudulent, they were retained in the data because they could be used for additional linking.
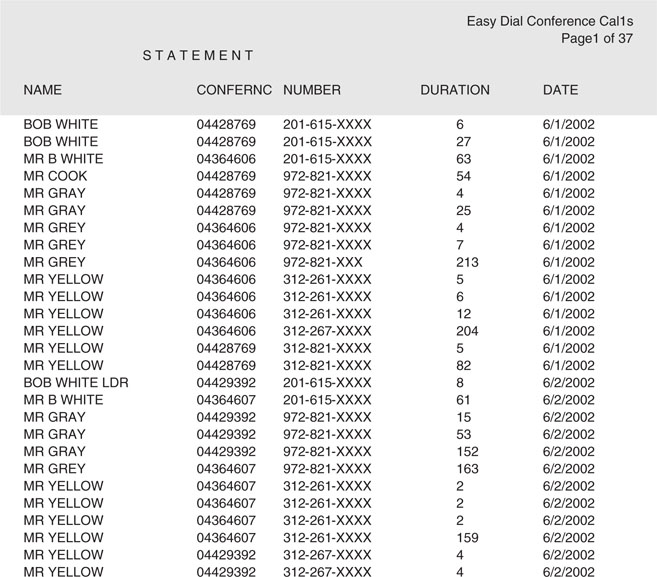
Figure 6-2 An electronic version of the invoice was used as the starting point in the creation of a database. This invoice included a large amount of unnecessary information and formatting that had to be removed, including headers, which have been highlighted.
This information was then pulled into a statistical package. At this point, the area code was separated from the rest of the information, because area codes can be recoded to unique locations and used for additional linking or aggregating of the information (Figure 6-3).

Figure 6-3 After the headers and other unnecessary information were removed, the data were pulled into a spreadsheet program for additional cleaning and recoding. During this step, the country code or regional area code was separated from the rest of the telephone number to facilitate additional geographic recoding.
Initial recoding included linking a location to the area code and telephone prefix (the first three digits of the telephone number). The date was converted into day of the week. Date frequently is important for determining timelines and sequencing, while the day of the week can reveal other patterns (Figure 6-4).
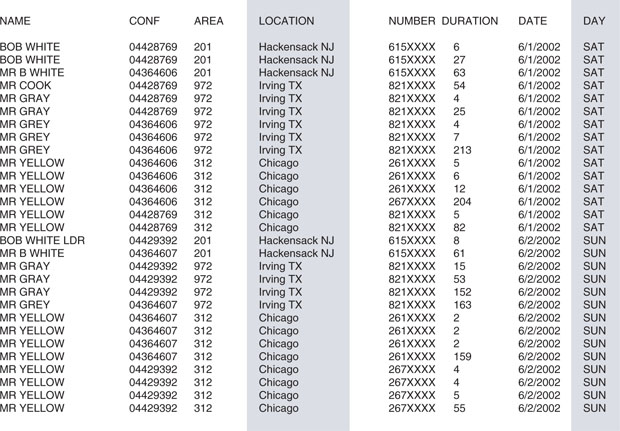
Figure 6-4 An additional variable was re-created, which indicated the country or general geographic area associated with the recoded country and area codes. The date also was converted into day of the week.
An initial review of the data indicated 2,017 unique calls or records. A quick visual check of the data, however, suggested that within particular conferences, the same individual might have dialed in more than once. Frequently, one of the calls was much longer while the others were of a minute’s duration or less.While this might be meaningful in some way, the most likely explanation was that these individuals had difficulty connecting to or maintaining a connection with the teleconference. Duplication between unique conferences, on the other hand, had value, as it was important in the characterization of particular individuals as well as the various conference calls. Therefore, a decision was made to remove the duplicate calls within a conference while retaining the duplication across conferences.
As can be seen in Figure 6-5, duplicate numbers within a unique conference call were deleted, while duplicated numbers across different conference calls were retained. Culling the duplicates revealed 1,042 unique calls. Again, these calls were confined exclusively to those without duplication of the same telephone number within a single conference, while maintaining duplication across conferences.

Figure 6-5 The data were culled to remove some duplicative calls that were determined to be unnecessary for subsequent analyses.
Finally, the cleaned and recoded data set was analyzed. Using an unsupervised learning process, which is covered in Chapter 7, three groups or clusters of similar calls were identified based on the day of the month that the conference occurred and the number of participants involved in a particular call (Figure 6-6). Further analysis of the participants involved in these calls suggested the possibility that the short calls early in the month involved the key participants or leaders in the process. The gap in activity noted in the middle of the month possibly allowed the organizers of this criminal enterprise to ensure that their activity had not been detected. After it was determined that it was safe to continue, activity resumed later in the month, which escalated to a brisk pace.

Figure 6-6 An unsupervised learning algorithm was used to cluster the calls into similar groups. This resulted in the identification of three distinct clusters of calls, based on the number of participants and the day of the month that the conference occurred. Additional information suggested possible operational differences between the clusters. (Screenshot of Two-Step output taken by the author is from Clementine 8.5; SPSS, Inc.)
The small and medium groups again involved many of the key participants from early in the month, which might have been associated with the relative importance of these calls, their purpose, and some of the other participants. The extremely large conference calls were consistent with the dissemination of information to large groups, such as lectures or fund raising. This activity continued until the end of the month, at which time it ceased abruptly. Termination of activity at this time probably was preplanned, because the end of the month also represented the end of the billing cycle, which was when this fraud was identified. By terminating activity, access to those involved was also terminated, which significantly limited investigative options.
This example highlights the increased complexity associated with telephone records, as well as the value of recoding information and the fact that quite a bit of valuable information can be elicited from telephone data without access to the actual content of the calls or even specific subscriber information. This information can be modeled and applied to new data sets, which can reveal new information regarding the possible nature of the activity and related participants.
Key points include the importance of recoding telephone numbers in as much detail as possible. In addition, reverse lookup tables can provide information on country, area, and regional coding within telephone numbers, as well as specific subscriber information in some cases. Again, it is not always necessary to identify the specific subscriber. Mining the data to identify regional geographic specificity can be adequate. This is particularly true in the development of scoring algorithms or classification systems. In those cases, specific subscriber information might limit the identification of a meaningful model that can be applied to new data. If it is essential to identify a specific subscriber, provider information associated with the number can facilitate the information request process.
6.7 Internet Data
Surveillance detection is addressed in Chapter 14, but it is worth mentioning here. Methods of physical surveillance detection are very good; however, large categories of information might be overlooked if surveillance detection is confined exclusively to physical surveillance. Increasingly, terrorists and extremist groups are utilizing Internet resources for preoperational surveillance and information collection. “Correlation” in surveillance detection frequently refers to seeing the same person or vehicle in space or time. Given the interest in technology, it might be time to extend this definition to include correlation between physical surveillance and surveillance activities on the Internet. For example, what happens if physical surveillance has been detected, and vigorous correlated activity is noted on a related website? Data mining tools have the analytical muscle necessary to combine these relatively disparate and unrelated data resources, integrate them, and analyze them in the same environment. By combining web mining tools with analysis of the products of traditional physical surveillance detection, a more compete model of surveillance activity can be developed.
One aid in the task of characterizing and modeling web browsing patterns are “cookies.” Briefly, Internet “cookies” are similar to electronic breadcrumbs that we leave behind as we move through the Internet. There are two types of cookies: session cookies and persistent cookies. Session cookies are temporary and only track your movement through a web site during a single visit or session. Persistent cookies, on the other hand, track your movement throughout the Internet. In some ways, persistent cookies have more value to law enforcement because they can help link information from a variety of websites or call out repeat visits to the same site over a longer duration of time. These tend to be intrusive, however, particularly from a privacy standpoint, and many people turn them off as a matter of general principle. Unfortunately, many law enforcement and intelligence agencies do not set cookies on their websites, either for privacy reasons or because they have not thought of it. Not to worry, though; if your agency does not set cookies, it still is possible to analyze and even characterize activity, since this type of behavior tends to be relatively unique yet specific, and very infrequent. These features allow the analyst to putatively link activity based on common IP address or browsing patterns. Although not perfect, it can represent a viable option for further analysis of suspicious activity.
6.8 Operationally Relevant Variable Selection
After recoding, another area for consideration is determining which variables will have value to the investigation, proposed operation, or analysis and should be included in subsequent steps. This is not to suggest that some information should be discarded or excluded, but not every piece of information will have the same amount of value in the analytical process. For example, middle names frequently are collected and entered into law enforcement records management systems. I can honestly state that I have never seen this particular piece of information have any predictive value whatsoever. I certainly would not start a movement to discard this information, because it does have value in terms of identifying unique individuals, particularly those with common first and last names, but it is not something that I would ever consider using in an analysis other than in some sort of link analysis or organizational chart.
Like data mining and analysis in other professions, data quality should be considered first. Issues regarding reliability and validity as well as the frequency of missing data will directly affect confidence in the results and interpretation of the findings. While analysts in the applied public safety and security setting generally need to go with what they have, there will be situations where the data quality issues so significantly limit their ability to effectively analyze the data and trust the results that they must question whether it is even prudent to proceed. These decisions will almost always be situation dependent, but analysts should always exercise caution regarding less than optimal data.
Two additional factors to consider in the selection of operationally relevant variables are determining whether the variables of interest are available and are actionable. Even the most relevant variable has limited value if it is not available when it is needed. For example, studies have shown that significant progress needs to be made quickly on a death investigation if the case is going to be solved.5 Therefore, any information required for a motive determination model should be available quickly if the model is intended to provide investigative support. This is situation dependent. The identification of predictive variables that are not available in time for the immediate investigation could be considered for information-based prevention strategies or cold case investigation, where time is not an issue.
The next consideration is whether inclusion of the variable will result in a model that is actionable. Referring back to the use of census data in models predicting crime, we noted that census tract boundaries change and may not match existing patrol boundaries. Therefore, while the information contained in census records might result in more accurate models, if the results cannot be used in the applied setting, they have limited value. It is important to remember that even if the relationships identified are not immediately actionable, they may be considered for other venues. For example, in an analysis of drug-related violence, we found that victims’ employment status was related to the risk for drug-related violence in one specific location. The victims assaulted in one particular location were more likely to be employed, while in almost every other location studied the victims tended to be unemployed. Although it was possible to identify the victims’ employment status in a timely fashion, it appeared that this variable had limited value for deployment, because it was not clear how resources could be deployed to specifically address the employment status of potential victims. After additional consideration, however, we speculated that the assaults in these areas were related to robberies of individuals buying drugs. Using this working hypothesis, it was determined that the risk to these victims could be reduced if they did not come into this particular area to buy drugs. The resulting operational strategy then focused on demand reduction in this location in an effort to reduce the risk for this specific group of victims.
There are other data elements with little or no value in analysis that are not as readily apparent. Many times these elements emerge in a model as a result of errors in logic. For example, we found that the suspect’s involvement in substance use and drug selling was a strong predictor of motive in drug-related murders.6 Knowledge of the suspect’s substance use patterns and criminal history would require knowing the suspect’s identity. If we knew who did it, then we could just ask them why. Generally, identification of a specific motive is used to direct the investigation toward a possible suspect, rather than the other way around. Therefore, while inclusion of specific details regarding the suspect might result in a highly predictive motive determination model, it would have little value to the investigative process because the model requires specific suspect information to predict the motive, which is being designed to predict likely suspects. In retrospect, the circular logic is obvious, but in the analytical environment, errors in logic such as these are not always obvious. It is always important to keep focused on the ultimate goals of analysis and what is likely to be available for inclusion in the applied setting or operational environment. Variable selection will be revisited during the modeling process.
Additional options for variable selection are available. These include stepwise selection approaches, where the user provides an array of possible variables and the most relevant or predictive variables are selected, and user-defined variable inclusion strategies, where the user specifically selects the variables that will be included in the analysis. Each approach has its own strengths and weaknesses, which are covered in Chapter 7.
Variable selection relies as much on analytical tradecraft as on science. This is particularly true in the applied public safety and security setting, where additional consideration regarding the availability, data quality, and operational relevance also come into play. In the movie Apollo 13, the engineers are tasked with creating a system that will make two incompatible carbon dioxide scrubbing filters work together. The only catch is that they can only use parts already aboard the spacecraft. The team leader walks into a conference room with a box of assorted items that they might use to create this system, and later walks out with an ugly contraption that utilizes miscellaneous junk and a fair amount of duct tape—but it works. It certainly is not elegant or state of the art, but it gets the job done. Analysts are faced with a similar task, particularly when analyzing information associated with the investigative process. Frequently, we are given a box of seemingly useless information and are asked to create something that will assist in the investigative process. At times, I have discussed my analytical work within the operational environment with academic researchers and felt like the proverbial country bumpkin, with my shoddy little models cobbled together with the equivalent of spare parts and duct tape. But that frequently is what is required in the applied setting. It certainly is possible to create extremely elegant, highly predictive models, but if they require information that is not readily available, have no relevance to the operational setting, or are so obtuse as to be inactionable, then they have no value. This can be a difficult concept to stay on top of, but the operational personnel will yank the analyst right back into reality with a roll of their eyes and a request for how they should know the suspect’s middle name when they have not yet determined the possible motive.
Ultimately, variable selection is an area in which analysts must rely on their domain expertise to identify and select variables that are both appropriate and relevant for inclusion in the analysis. Because only those variables selected will be considered, the analysts’ preconceived notions and biases can play a role in this process. All of the variables selected for inclusion in the analysis, whether appropriate or not, will at least be considered, if not included in any models developed. Although correlation does not mean causality, inclusion of a particular variable in a predictive model may have implications that extend well beyond the specific analysis. Again, any preconceived notions or biases will be reflected in the variables selected. These are important issues to consider, as criminal justice research is an area of science that has experienced its share of controversy. Throughout history, individuals have used questionable research supported by loosely correlated relationships to confirm theories of criminality and deviance based on prejudice and bias.7 As always, common sense and judgment is an excellent partner to probable cause and ethics in the analytical process.
6.9 Bibliography
1. Helberg, C. (2002). Data mining with confidence, 2nd ed. SPSS, Inc., Chicago, IL.
2. Howell, D. (1992). Statistical methods for psychology, 3rd ed. Duxbury Press, Belmont, CA.
3. McCue, C., Smith, G.L., Diehl, R.L., Dabbs, D.F., McDonough, J.J., and Ferrara, P.B. (2001). Why DNA databases should include all felons. Police Chief, 68, 94–100.
4. McCue, C. (2004). Lecture presented to Diplomatic Security Service personnel at U.S. Department of State (ArmorGroup, International Training), Rosslyn, VA, May 14, June 25.
5. Wellford, C. and Cronin, J. (2000). Clearing up homicide clearance rates. National Institute of Justice Journal, 243, 1–7.
6. McLaughlin, C.R., Daniel, J., and Joost, T.F. (2000). The relationship between substance use, drug selling and lethal violence in 25 juvenile murderers. Journal of Forensic Sciences, 45, 349–353.
7. See Gould, S.J. (1981).The mismeasure of man. WW Norton & Company, New York; and Lewontin, R.C., Rose, S., and Kamin, L.J. (1984). Not in our genes. Pantheon Books, New York.