Chapter 2. A Modern Data Infrastructure
Before deciding on products and design for building pipelines, it’s worth understanding what makes up a modern data stack. As with most things in technology, there’s no single right way to design your analytics ecosystem or choose products and vendors. Regardless, there are some key needs and concepts that have become industry standard and set the stage for best practices in implementing pipelines.
Let’s take a look at the key components of such an infrastructure as displayed in Figure 2-1. Future chapters explore how each component factor into the design and implementation of data pipelines.

Figure 2-1. The key components of a modern data infrastructure.
Diversity of Data Sources
The majority of organizations have dozens, if not hundreds of data sources that feed their analytics endeavors. Data sources vary across many dimensions covered in this section.
Source System Ownership
It’s typical for an analytics team to ingest data from source systems that are built and owned by the organization as well as from third-party tools and vendors. For example, an e-commerce company might store data from their shopping cart in a Postgres database behind their web app. They may also use a third-party web analytics tools such as Google Analytics to track usage on their website. The combination of the two data sources (illustrated in Figure 2-2) is required to get a full understanding of customer behavior leading up to a purchase. Thus, a data pipeline which ends with an analysis of such behavior starts with the ingestion of data from both sources.

Figure 2-2. A simple pipeline with data from multiple sources loaded into an S3 Bucket and then a Redshift Database
Note
The term data ingestion is used to refer to extracting data from one source and loading into another.
Understanding the ownership of source systems is important for several reasons. First, for third-party data sources you’re likely limited as to what data you can access and how you can access it. Most vendors make a REST API available, but few will give you direct access to your data in the form of a SQL database. Even fewer will give you much in the way of customization of what data you can access and at what level of granularity.
Internally built systems present the analytics team with more opportunities to customize the data available as well as the method of access. However, they present other challenges as well. Were the systems built with consideration of a data ingestion? Often the answer is no, and that has implications ranging from the ingestion putting unintended load on the system to the inability to load data incrementally. If you’re lucky, the engineering team that owns the source system will have the time and willingness to work with you, but in the reality of resource constraints you may find it’s not dissimilar to working with an external vendor.
Ingestion Interface and Data Structure
Regardless of who owns the source data, how you get it and in what form is the first thing a data engineer will examine when building a new data ingestion. First, what is the interface to the data? Some of the most common include the following.
-
A database behind an application, such as a Postgres or MySQL database
-
A layer of abstraction on top of a system such as a REST API
-
A stream processing platform such as Apache Kafka
-
A network share or cloud storage bucket containing logs, CSVs and other flat files
-
A data warehouse or data lake
-
Data in HDFS (Hadoop Distributed File System) or HBase database
In addition to the interface, the structure of the data will vary. Here are some common examples.
-
JSON from a REST API
-
Well structured data from a MySQL database
-
JSON within columns of a MySQL database table
-
Semi-structured log data
-
CSVs and other flat files
-
JSON in flat files
-
Stream output from Kafka
Each interface and data structure presents its own challenges and opportunities. Well structured data is often easiest to work with, but it’s often structured in the interest of an application or web site. Beyond the ingestion of the data, further steps in the pipeline will likely be necessary to clean and transform into a structure better suited for an analytics project.
Semi-structured data such as JSON is increasingly common, and has the advantage of the structure of attribute-value pairs and nesting of objects. However, unlike a relational database, there is no guarantee that each object in the same dataset will have the same structure. As you’ll see later in this text, how one deals with missing or incomplete data in a pipeline is context dependent and increasingly necessary as the rigidity of the structure in data is reduced.
Unstructured data is common for some analytics endeavors. For example, Natural Language Processing (NLP) models require vast amounts of free text data to train and validate. Computer Vision (CV) projects require images and video content. Even less advanced projects such as scraping data from web pages have a need for free text data from the web in addition to the semi-structured HTML markup of a web page.
Data volume
Though data engineers and hiring managers alike enjoy bragging about petabyte-scale datasets, the reality is that most organizations value small datasets as much as large ones. In addition, it’s common to ingest and model small and large datasets in tandem. Though the design decisions at each step in a pipeline must take data volume into consideration, high volume does not mean high value.
All that said, most organizations have at least one dataset that is both key to analytical needs as well as high volume. What’s high volume? There’s no easy definition, but as it pertains to pipelines it’s best to think in terms of a spectrum rather than a binary definition of high and low volume datasets.
Note
As you’ll see throughout this Pocket Reference, there’s as much danger in oversimplifying data ingestion and processing with the result being long and inefficient runs as there is in overengineering pipeline tasks when the volume of data or complexity of the task is low.
Data Cleanliness and Validity
Just as there is great diversity in data sources, the quality of source data varies greatly. As the old saying goes, “garbage in, garbage out.” It’s important to understand the limitations and deficiencies of source data and address them in the appropriate sections of your pipelines.
There are many common characteristics of “messy data,” including but not limited to:
-
Duplicate or ambiguous records
-
Orphaned records
-
Incomplete or missing records
-
Text encoding errors
-
Inconsistent formats (for example, phone numbers with/without dashes)
-
Mislabeled data
Of course there are numerous others, as well as data validity issues specific to the context of the source system.
There’s no magic bullet for ensuring data cleanliness and validity, but in a modern data ecosystem there are key characteristics and approaches that we’ll see throughout this book.
-
Assume the worst, expect the best. Pristine datasets only exist in academic literature. Assume your input datasets will contain numerous validity and consistency issues, but build pipelines that identify and cleanse data in the interest of clean output.
-
Clean and validate data in the system best suited to do so. There are times that it’s better to wait to clean data until later in a pipeline. For example, modern pipelines tend to follow an ELT (Extract-Load-Transform) rather than ETL (Extract-Transform-Load) approach for data warehousing (more in Chapter 3). It’s sometimes optimal to load data into a data lake in a fairly raw form, and worry about structuring and cleaning later in the pipeline. In other words, use the right tool for the right job rather than rushing cleaning and validation.
-
Validate often. Even if you don’t clean up data early in a pipeline, don’t wait until the end of the pipeline to validate it. You’ll have a much harder time determining where things went wrong. Conversely, don’t validate once early in a pipeline and assume all will go well in subsequent steps.
Chapter 8 digs deeper into validation
Latency and Bandwidth of the Source System
The need to frequently extract high volumes of data from source systems is a common use case in a modern data stack. Doing so presents challenges, however. Data extraction steps in pipelines must contend with API rate limits, connection timeouts, slow downloads, and unhappy source system owners due to strain placed on their systems.
Note
As discussed in Chapter 4 in more detail, data ingestion is the first step in most data pipelines. Understanding the characteristics of source systems and their data is thus the first step in designing pipelines and making decisions regarding infrastructure further downstream.
Cloud Data Warehouses and Data Lakes
Three things changed the landscape of analytics and data warehousing over the last 10 years, and they’re all related to the emergence of the major public cloud providers (Amazon, Google, and Microsoft)
-
The ease of building and deploying data pipelines, data lakes, warehouses, and analytics processing in the cloud. No more waiting on IT departments and budget approval for large upfront costs. Managed services, databases in particular, have become mainstream.
-
Continued drop in storage costs in the cloud
-
The emergence of highly scalable, columnar databases such as Amazon Redshift, Snowflake and Google Big Query.
These changes breathed new life into data warehouses and introduced the concept of a data lake. Though Chapter 4 covers data warehouses and data lakes in more detail, it’s worth briefly defining both now in order to clarify their place in a modern data ecosystem.
A data warehouse is a database where data from different systems is stored and modeled to support analysis and other activities related to answering questions with it. Data in a data warehouse is structured and optimized for reporting and analysis queries.
A data lake is where data is stored, but without the structure or query optimization of a data warehouse. It will likely contain a high volume of data as well as a variety of data types. For example, a single data lake might contain a collection of blog posts stored as text files, flat files extracts from a relational database, and JSON objects containing events generated by sensors in an industrial system. It can even store structured data like a standard database, though it’s not optimized for querying such data in the interest of reporting and analysis
There is a place for both data warehouses and data lakes in the same data ecosystem and data pipelines often move data between both.
Data Ingestion Tools
The need to ingest data from one system to another is common to nearly all data pipelines. As previously discussed in this chapter, data teams must contend with a diversity of data sources in which to ingest data from. Thankfully, a number of commercial and open-source tools are available in a modern data infrastructure.
In this Pocket Reference I discuss some of the most common of these tools and frameworks including the following.
-
Singer
-
Stitch
-
Fivetran
Despite the prevalence of these tools, some teams decide to build custom code to ingest data. Some even develop their own frameworks. The reasons vary by organization, but are often related to cost, a culture of build over buy, and concerns about the legal and security risks of entrusting an external vendor. In Chapter 4, I discuss the build vs. by trade offs that are unique to data ingestion tools. Of particular interest is whether the value in considering a commercial solution to data ingestion is to make it easier for data engineers to build data ingestions into their pipelines or to enable non-data engineers (such as data analysts) to build ingestions themselves.
As Chapter 4 also discusses, data ingestion is traditionally both the Extract and Load steps of an ETL (Extract-Transform-Load) or ELT (Extract-Load-Transform) process. Some tools focus on just these steps, while others provide the user with some Transform capabilities as well. In practice, I find most data teams choose to limit the amount of transformations they make during data ingestion, and thus stick to ingestion tools that are good at two things: extracting data from a source and loading it into a destination.
Data Transformation and Modeling Tools
Though the bulk of this chapter has thus far focused on moving data between sources and destinations (data ingestion), there is much more to data pipelines and the movement of data. Pipelines are also made up of tasks that transform and model data for new purposes such as machine learning, analysis, and reporting.
The terms data modeling and data transformation are often used interchangeably, however for the purposes of this text I will differentiate them.
- Data Transformation
-
Transforming data is a broad term that is signified by the T in an ETL or ELT process. A transformation can something as simple as converting a timestamp stored in a table from one timezone to another. It can also be a more complex operation that creates a new metric from multiple source columns which are aggregated and filtered through some business logic.
- Data Modeling
-
Data modeling is a more specific type of data transformation. A data model structures and defines data in a format that is understood and optimized for data analysis. A data model is usually represented as one or more tables in a data warehouse. The process of creating data models is discussed in more detail in Chapter 5.
Like data ingestion, there are a number of methodologies and tools that are present in a modern data infrastructure. As previously noted, some data ingestion tools provide some level of data transformation capabilities, but these are often quite simple. For example, for the sake of protecting personally identifiable information (PII) it may be desirable to turn an email address into a hashed value that is stored in the final destination. Such a transformation is usually performed during the ingestion process.
For more complex data transformations and data modeling I find it desirable to seek out tools and frameworks specifically designed for the task. In addition, data transformation is often quite context specific and can be written in a language familiar to data engineers and data analysts such as SQL or Python.
Data models that will be used for analysis and reporting are typically defined and written in SQL or via point-and-click user interfaces. Just like build vs. buy trade-offs, there are considertions is choosing to build models using SQL vs. a no-code tool. SQL is a highly accessible language that is common to both data engineers and analysts. It empowers the analyst to work directly with the data and optimize the design of models for their needs. It’s also used in nearly every organization, thus providing a familiar entry point for new hires to a team. In most cases, choosing a transformation framework that supports building data models in SQL rather than via a point-and-click user interface is desirable.
Workflow Orchestration Platforms
As the complexity and number of data pipelines in an organization grows, it’s important to introduce a workflow orchestration platform to your data infrastructure. These platforms manage the scheduling and flow of tasks in a pipeline. Imagine a pipeline with a dozen tasks ranging from data ingestions written in Python to data transformations written in SQL that must run in a particular sequence throughout the day. It’s not a simple challenge to schedule and manage dependencies between each task. Every data team faces this challenge, but thankfully there are numerous workflow orchestration platforms available to allieve the pain.
Note
Workflow orchestration platforms are also referred to as workflow management systems (WMS), orchestration platforms, or orchestration frameworks. I use these terms interchangeably in this text.
Some platforms, like Apache Airflow, Luigi, and AWS Glue are designed for more general use cases and are thus used for a wide variety of data pipelines. Others, such as Kubeflow Pipelines, are designed for more specific use cases and platforms (Machine Learning workflows built on Docker containers in the case of Kubeflow Pipelines).
Directed Acyclic Graphs
Nearly all modern orchestration frameworks represent the flow and dependencies of tasks in a pipeline as a graph. However, pipeline graphs have some specific constraints.
Pipeline steps are always directed, meaning they start with a task or multiple tasks and end with a specific task or tasks. This is required to guarantee a path of execution. In other words, it ensures that tasks do not run before all their dependent tasks are completed successfully.
Pipeline graphs must also be acyclic, meaning that a task cannot point back to a previously completed task. In other words, it cannot cycle back. If it could, then a pipeline could run endlessly!
With these two constraints in mind, orchestration pipelines produce graphs called Directed Acyclic Graphs or DAGs for short. A simple DAG is illustrated in Figure 2-3. In this example, Task A must complete before Tasks B and C can start. Once they are both completed then Task D can start. Once Task D is complete, the pipeline is completed as well.
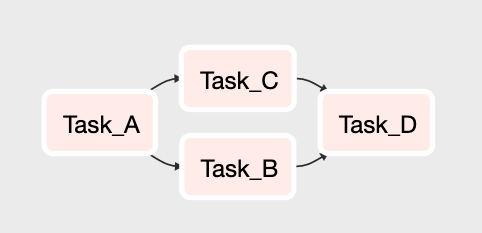
Figure 2-3. A DAG with 4 tasks. After Task A completes, Task B and Task C run. When they both complete, Task D runs.
DAGs are a representation of a set of tasks and not where the logic of the tasks is defined. An orchestration platform is capable of running tasks of all sorts.
For example, consider a data pipeline with 3 tasks. It it represented as a DAG in Figure 2-4.
-
The first executes a SQL script that queries data from a relational database and stores the result in a CSV file.
-
The second runs a Python script that loads the CSV file, cleans and then reshapes the data before saving a new version of the file.
-
Finally, a third task which runs the COPY command in SQL loads the CSV created by the second task into a Snowflake data warehouse.

Figure 2-4. A DAG with 3 tasks that run in sequence in order to extract data from a SQL database, clean and reshape the data using a Python script, and then load the resulting data into a data warehouse.
The orchestration platform executes each task, but the logic of the tasks exist as SQL and Python code which runs on different systems across the data infrastructure.
Chapter 7 discusses workflow orchestration platforms in more detail and provides hands on examples of orchestrating a pipeline in Apache Airflow.
Customizing Your Data infrastructure
It’s rare to find two organizations with exactly the same data infrastructure. Most pick and choose tools and vendors that meet their specific needs, and build the rest on their own. Though I speak in detail to some of the most popular tools and products throughout this book, there’s many more coming to market each year.
As previously noted, depending on the culture and resources in of your organization you may be encouraged to build most of your data infrastructure on your own, or to rely on SaaS vendors instead. Regardless of which way you lean on the build vs. buy scale, you can build a high quality data infrastructure necessary to build high quality data pipelines.
What’s important is understanding your constraints (dollars, engineering resources, security and legal risk tolerance) and the resulting trade-offs. I speak to these throughout the text and call out key decision points in making a product or tooling selection.